IND Inverse_v1
Download script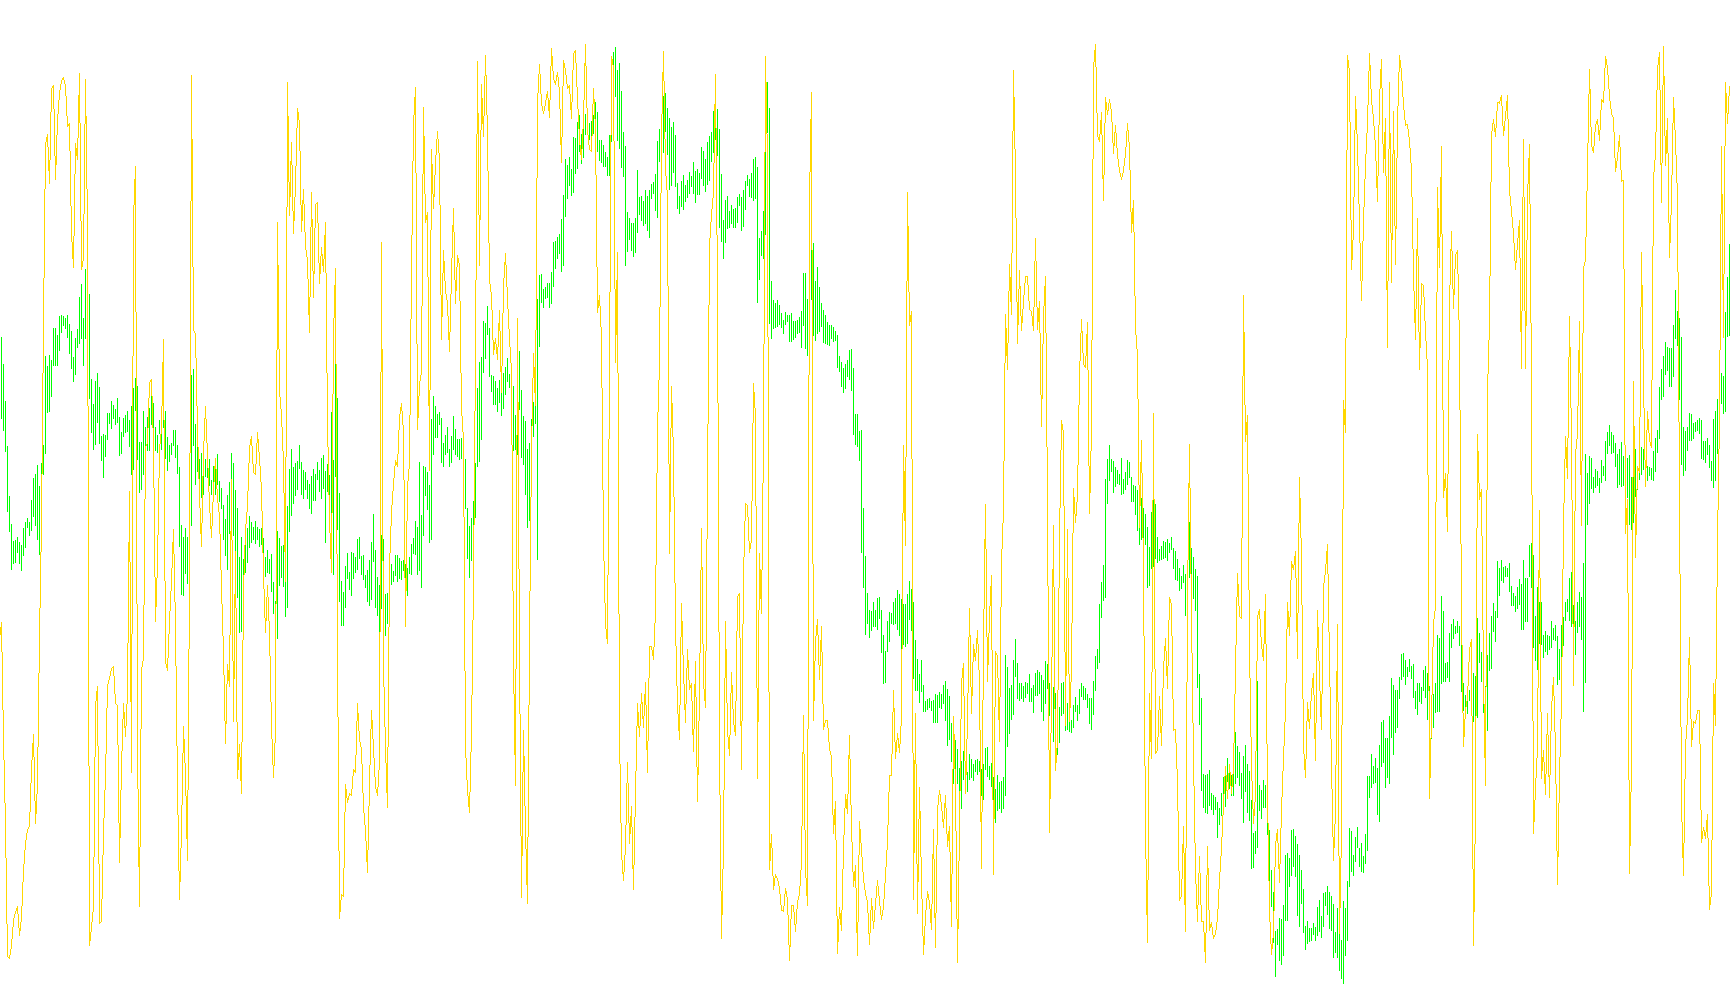
This technical tool is designed to provide visual feedback on price action by analyzing the relationship between current market closing prices and historical volatility. Rather than simply tracking the price itself, it focuses on how far the market has moved relative to its recent extremes.
How the Logic Works
The script operates by constantly scanning a specific window of previous price data (determined by the user-defined period) to identify two critical points:
- The High: The highest price reached during that timeframe.
- The Low: The lowest price reached during that same timeframe.
By identifying these two boundaries, the tool calculates the Amplitude, which is the total vertical distance between the peak and the valley of the recent market movement.
The Core Calculation
Once the amplitude is established, the script determines where the current closing price sits within that range. It specifically measures the distance between the current price and the high point, then adjusts this value based on the total size of the movement.
The final output is a normalized value that scales based on your chosen period. This creates a unique line that reacts to market pressure:
- It highlights how "stretched" the price is compared to its recent highs and lows.
- It converts raw price movements into a distinct visual signal, making it easier to perceive the intensity of the current trend relative to the recent historical range.
Key Takeaway for the User
This tool does not just show you where the price is; it shows you where the price is sitting in relation to its recent boundaries. It effectively "filters" the market noise to show you a scaled representation of price momentum, helping you visualize how far the market has traveled from its extremes.
/*-----------------------------+
|			       |
| Shared by www.Aptrafx.com    |
|			       |
+------------------------------*/

//+------------------------------------------------------------------+
//|                                               IND Inverse.mq4 |
//+------------------------------------------------------------------+
#property copyright "Copyright © 2006, ..."
#property link      "http://www.forex-tsd.com/"

#property indicator_separate_window
#property indicator_buffers 1
#property indicator_color1 Silver
//---- input parameters
//---- buffers
double Buffer[];

extern int iPeriod = 1;

//----
//+------------------------------------------------------------------+
//| Init                                                             |
//+------------------------------------------------------------------+
int init()
{
//---- indicators
    IndicatorBuffers(1);
    IndicatorDigits(Digits+2);
    SetIndexStyle(0,DRAW_LINE);
    SetIndexBuffer(0,Buffer);
//----
    return(0);
}

//+------------------------------------------------------------------+
//| Parabolic Sell And Reverse system                                |
//+------------------------------------------------------------------+
int start()
  {
   int limit;
   int counted_bars=IndicatorCounted();

//---- check for possible errors
   if(counted_bars<0)
   {
      return(-1);
   }
//---- last counted bar will be recounted
   if(counted_bars>0) counted_bars--;
   limit=Bars-counted_bars;

//---- do it


    for(int i=0; i<limit; i++)
    {
        // Easy to read
        double HD = High[Highest(NULL,0,MODE_HIGH,(iPeriod* 20),i)];
        double LD = Low[Lowest(NULL,0,MODE_LOW,(iPeriod* 20),i)];
        double amplitude = HD - LD;
        Buffer[i]= (((Close[i]-HD-(amplitude/2)))/amplitude) * iPeriod;
    }

//----
   return(0);
  }
//+------------------------------------------------------------------+
Comments