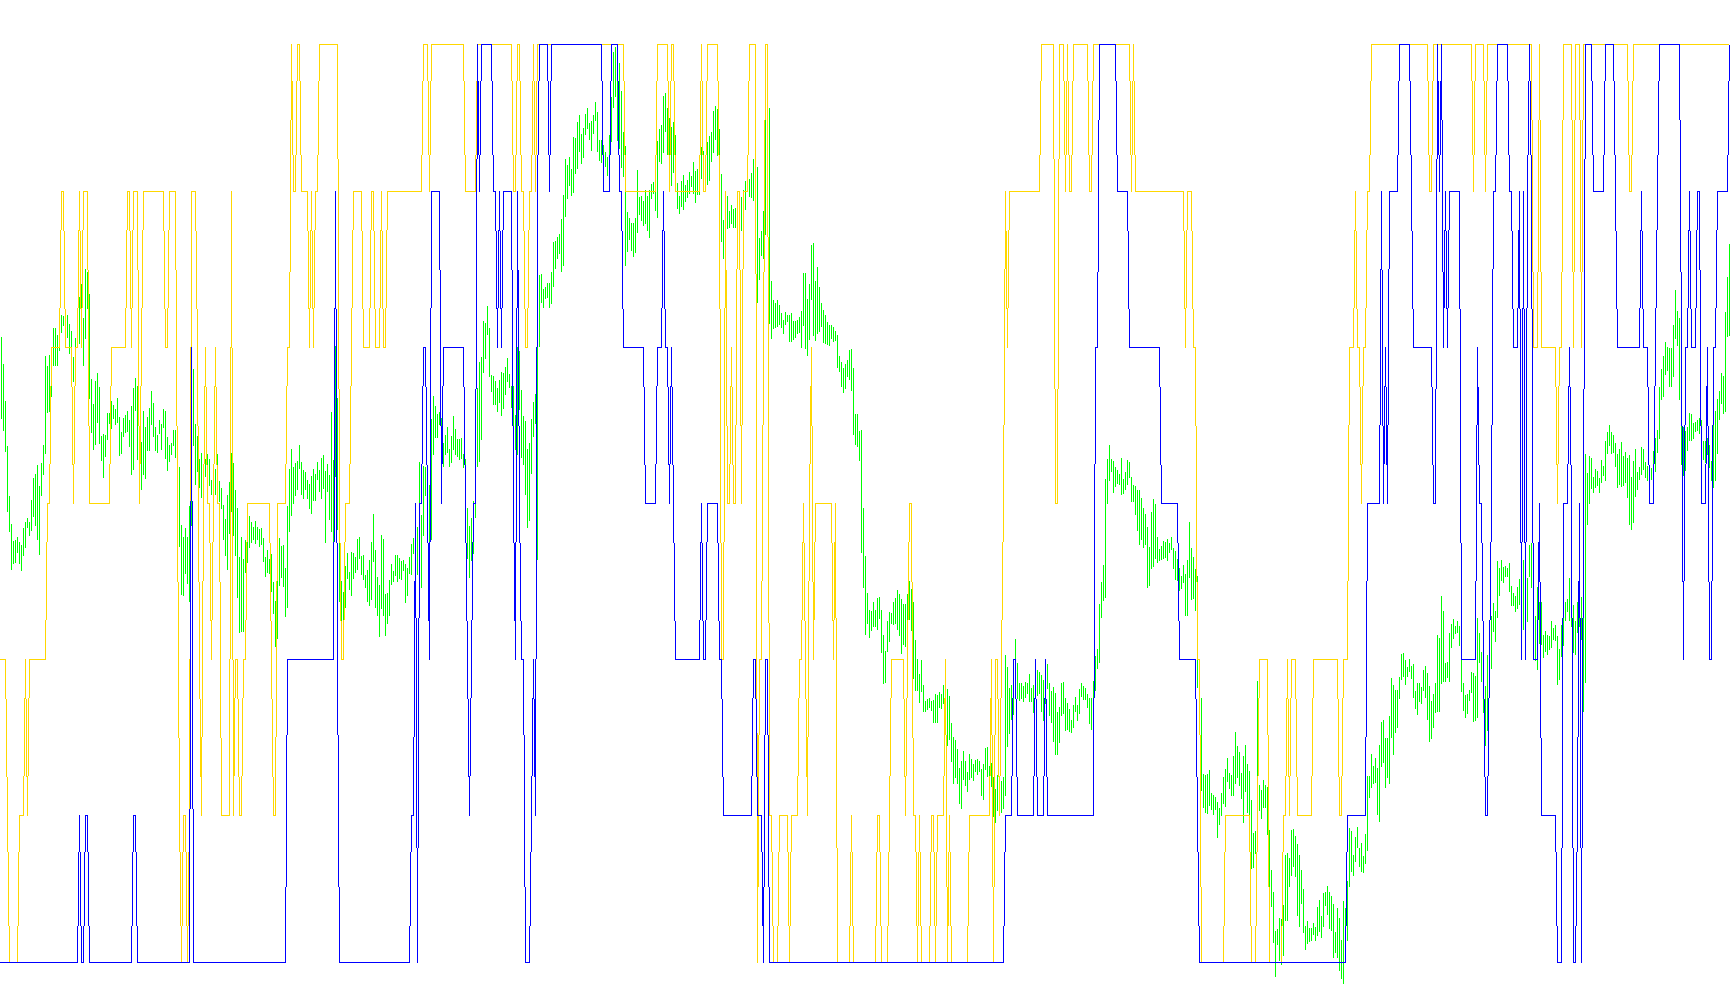
The Ind-Widners Oscillator is a specialized technical analysis tool designed to help traders visualize market momentum by tracking the relationship between recent price extremes and current closing prices. Instead of simply looking at where the price is going, this indicator focuses on how "stretched" the price has become relative to its recent history.
Core Logic and Methodology
The script operates by identifying specific price milestones—specifically the highest highs and the lowest lows—over a user-defined period of time. It then compares these historical peaks and troughs against the current market closing price to calculate two distinct values:
- Lower Range Analysis (Blue Line): The logic identifies the six most recent "lowest" points within the specified timeframe. It calculates how many times these low prices can fit into the current closing price. By averaging these results, the indicator determines the intensity of the downward pressure or the proximity of the price to its recent floor.
- Upper Range Analysis (Red Line): Similarly, the script identifies the six most recent "highest" points. It performs a comparable calculation based on how many times these peaks fit into the current closing price to measure upward momentum and proximity to the ceiling.
How it Functions on a Chart
The oscillator translates these complex mathematical relationships into a readable scale ranging from 0 to 100:
- Momentum Measurement: The indicator generates two separate lines. One represents the "support" side of the market, and the other represents the "resistance" side.
- Normalization: The script includes a safety mechanism to ensure the lines stay within the visual boundaries of the window. If a calculation would result in an extreme value (0 or 100), the logic automatically adjusts it slightly to keep the data points visible and consistent.
- Visual Interpretation: By observing these two lines, a trader can see whether the price is overextended. When the lines move toward the upper or lower boundaries, it indicates that the market is reaching significant historical extremes relative to recent price action.
In essence, this tool acts as a "pressure gauge," showing you not just where the price is, but how much room it has left to move based on its recent behavior over a specific timeframe.
//+------------------------------------------------------------------+
//|                                        Ind-Widners Oscilator.mq4 |
//|                    Copyright © 2004, http://www.expert-mt4.nm.ru |
//|                                      http://www.expert-mt4.nm.ru |
//+------------------------------------------------------------------+
#property copyright "Copyright © 2004, http://www.expert-mt4.nm.ru"
#property link      "http://www.expert-mt4.nm.ru"
//----
#property indicator_separate_window
#property indicator_minimum 1
#property indicator_maximum 100
#property indicator_buffers 2
#property indicator_color1 Red
#property indicator_color2 Blue
//----
extern int nPeriod=9;
extern int Limit=350;
///---- int Widners Oscilator
int cnt,nCurBar;
//---- buffers
double wso[];
double wro[];
//+------------------------------------------------------------------+
//| Custom indicator initialization function                         |
//+------------------------------------------------------------------+
int init()
  {
//---- indicators
   SetIndexStyle(0,DRAW_LINE);
   SetIndexBuffer(0,wso);
   SetIndexStyle(1,DRAW_LINE);
   SetIndexBuffer(1,wro);
//----
   return(0);
  }
//+------------------------------------------------------------------+
//| Custor indicator deinitialization function                       |
//+------------------------------------------------------------------+
int deinit()
  {
//---- TODO: add your code here
//----
   return(0);
  }
//+------------------------------------------------------------------+
//| Custom indicator iteration function                              |
//+------------------------------------------------------------------+
int start()
  {
//---- TODO: add your code here
   double r1,r2,r3,r4,r5,r6;
   double s1,s2,s3,s4,s5,s6;
//---- ????? ????????????? ? ?????????
   if(Bars>Limit) Limit=Bars-nPeriod;
   for(nCurBar=Limit; nCurBar>0; nCurBar--)
     {
      if(Low[nCurBar+(nPeriod-1)/2]==Low[Lowest(NULL,0,MODE_LOW,nPeriod,nCurBar)])
        {
         s6=s5; s5=s4; s4=s3; s3=s2; s2=s1; s1=Low[nCurBar+(nPeriod-1)/2];
        }
      if(High[nCurBar+(nPeriod-1)/2]==High[Highest(NULL,0,MODE_HIGH,nPeriod,nCurBar)])
        {
         r6=r5; r5=r4; r4=r3; r3=r2; r2=r1; r1=High[nCurBar+(nPeriod-1)/2];
        }
      //----
      wso[nCurBar]=100*(1-(MathFloor(s1/Close[nCurBar])+
                  MathFloor(s2/Close[nCurBar])+
                  MathFloor(s3/Close[nCurBar])+
                  MathFloor(s4/Close[nCurBar])+
                  MathFloor(s5/Close[nCurBar])+
                  MathFloor(s6/Close[nCurBar]))/6);
      if(wso[nCurBar]==0) wso[nCurBar]=wso[nCurBar]+1;
      if(wso[nCurBar]==100) wso[nCurBar]=wso[nCurBar]-1;
      wro[nCurBar]=100*(1-(MathFloor(r1/Close[nCurBar])+
                  MathFloor(r2/Close[nCurBar])+
                  MathFloor(r3/Close[nCurBar])+
                  MathFloor(r4/Close[nCurBar])+
                  MathFloor(r5/Close[nCurBar])+
                  MathFloor(r6/Close[nCurBar]))/6);
      if(wro[nCurBar]==0) wro[nCurBar]=wro[nCurBar]+1;
      if(wro[nCurBar]==100) wro[nCurBar]=wro[nCurBar]-1;
     }
//----
   return(0);
  }
//+------------------------------------------------------------------+
Comments