IND InverseB
Download script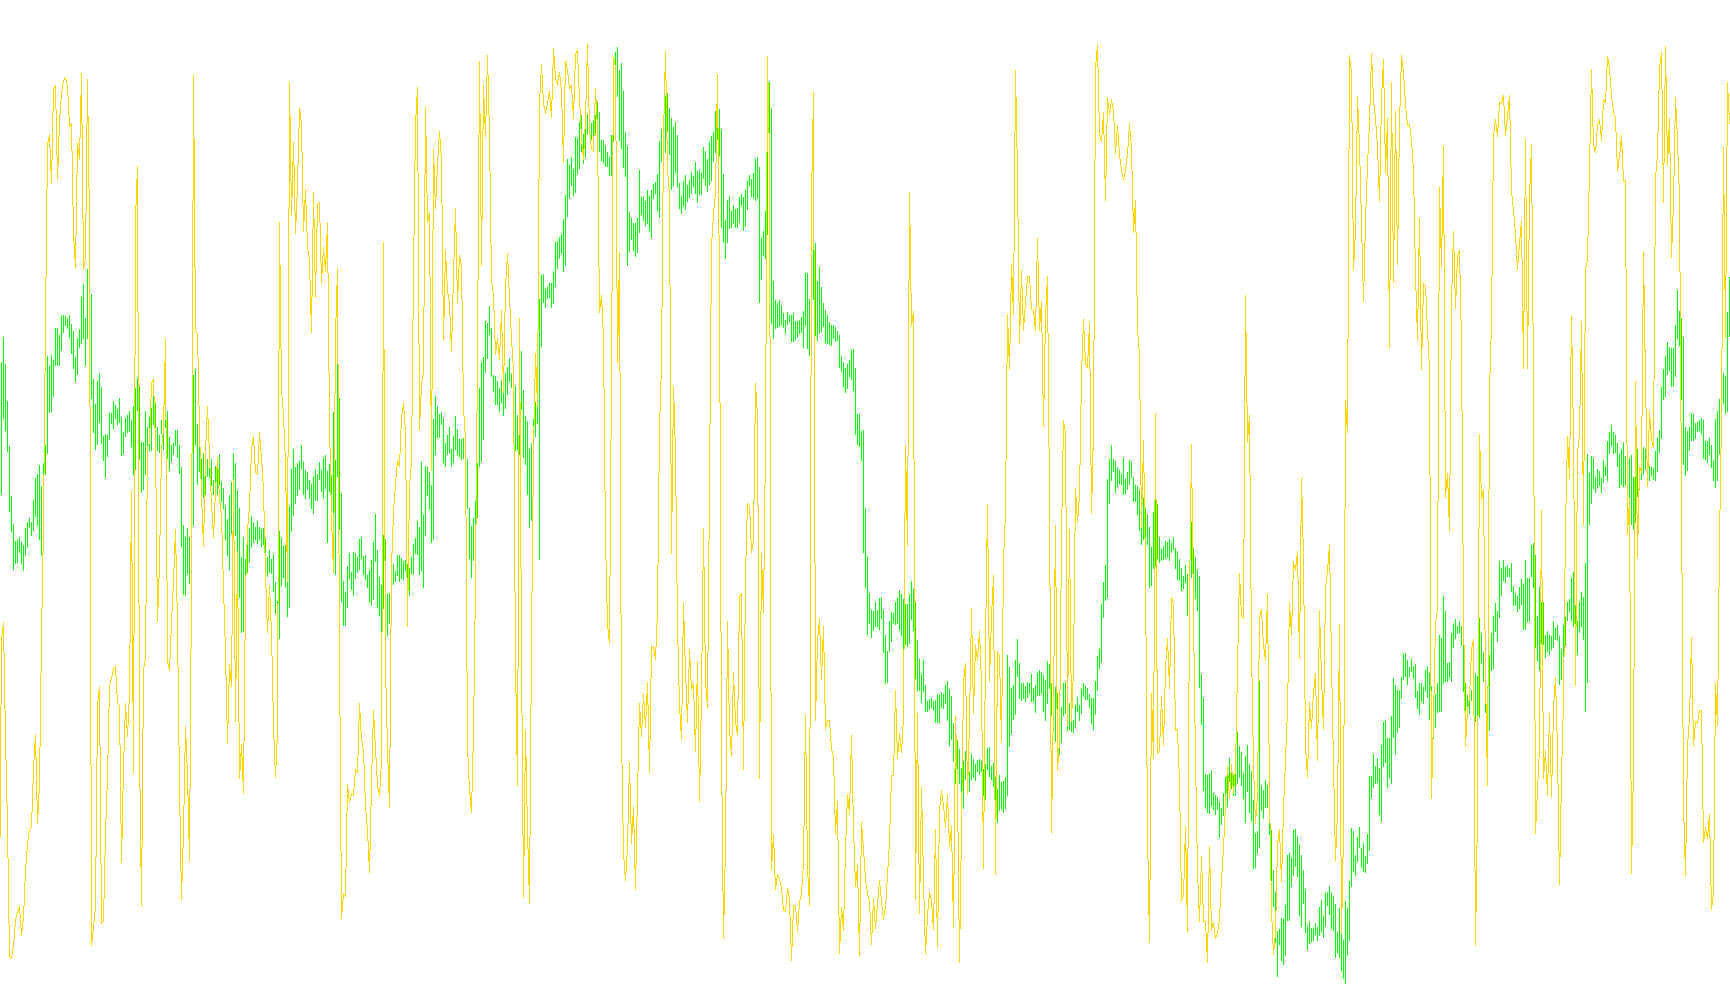
This tool functions as a visual market analyst that helps traders understand the current price position relative to recent market volatility. Instead of just showing the raw price, it transforms complex price movements into a simplified numerical scale, making it easier to see where the "center" of the action lies.
How the Logic Works
The script operates by constantly scanning a specific window of historical data (based on the user-defined period) to identify two key boundaries:
- The Ceiling: The highest price reached within that time frame.
- The Floor: The lowest price reached within that time frame.
By identifying these two extremes, the tool calculates the total Amplitude, which represents the entire range of movement for that period.
Translating Price to a Value
Once the script knows the "Floor" and the "Ceiling," it determines the exact midpoint of that range. It then looks at where the current closing price sits in relation to that midpoint:
- Relative Positioning: The tool measures how far the current price has moved away from the top of the range.
- Normalization: It converts this distance into a relative value. Essentially, it "flattens" the market data so that you can see if the price is leaning toward the top, the bottom, or hovering in the middle.
The Final Output
The result displayed on your chart is a continuous line that reflects this normalized movement. This allows a trader to ignore minor "noise" and focus on the broader trend:
- When the value is high, it indicates the price is dominating the upperend of its recent range.
- When the value is low, it suggests the price is pulling back toward the lower end.
In short, this script acts as a filter that strips away the complexity of raw price ticks to show you the "momentum" and relative positioning of the market at a glance.
//+------------------------------------------------------------------+
//|                                               IND Inverse.mq4 |
//+------------------------------------------------------------------+
#property copyright "Copyright © 2006, ..."
#property link      "http://www.forex-tsd.com/"

#property indicator_separate_window
#property indicator_buffers 1
#property indicator_color1 Silver
//---- input parameters
//---- buffers
double Buffer[];

extern int iPeriod = 1;

//----
//+------------------------------------------------------------------+
//| Init                                                             |
//+------------------------------------------------------------------+
int init()
{
//---- indicators
    IndicatorBuffers(1);
    IndicatorDigits(Digits+2);
    SetIndexStyle(0,DRAW_LINE);
    SetIndexBuffer(0,Buffer);
//----
    return(0);
}

//+------------------------------------------------------------------+
//| Parabolic Sell And Reverse system                                |
//+------------------------------------------------------------------+
int start()
  {
   int limit;
   int counted_bars=IndicatorCounted();

//---- check for possible errors
   if(counted_bars<0)
   {
      return(-1);
   }
//---- last counted bar will be recounted
   if(counted_bars>0) counted_bars--;
   limit=Bars-counted_bars;

//---- do it


    for(int i=0; i<limit; i++)
    {
        // Easy to read
        double HD = High[Highest(NULL,0,MODE_HIGH,(iPeriod* 20),i)];
        double LD = Low[Lowest(NULL,0,MODE_LOW,(iPeriod* 20),i)];
        double amplitude = HD - LD;
        Buffer[i]= ((Close[i]-(HD-(amplitude/2)))/amplitude) * iPeriod;
    }

//----
   return(0);
  }
//+------------------------------------------------------------------+
Comments