Ind-GG01M_sw
Download script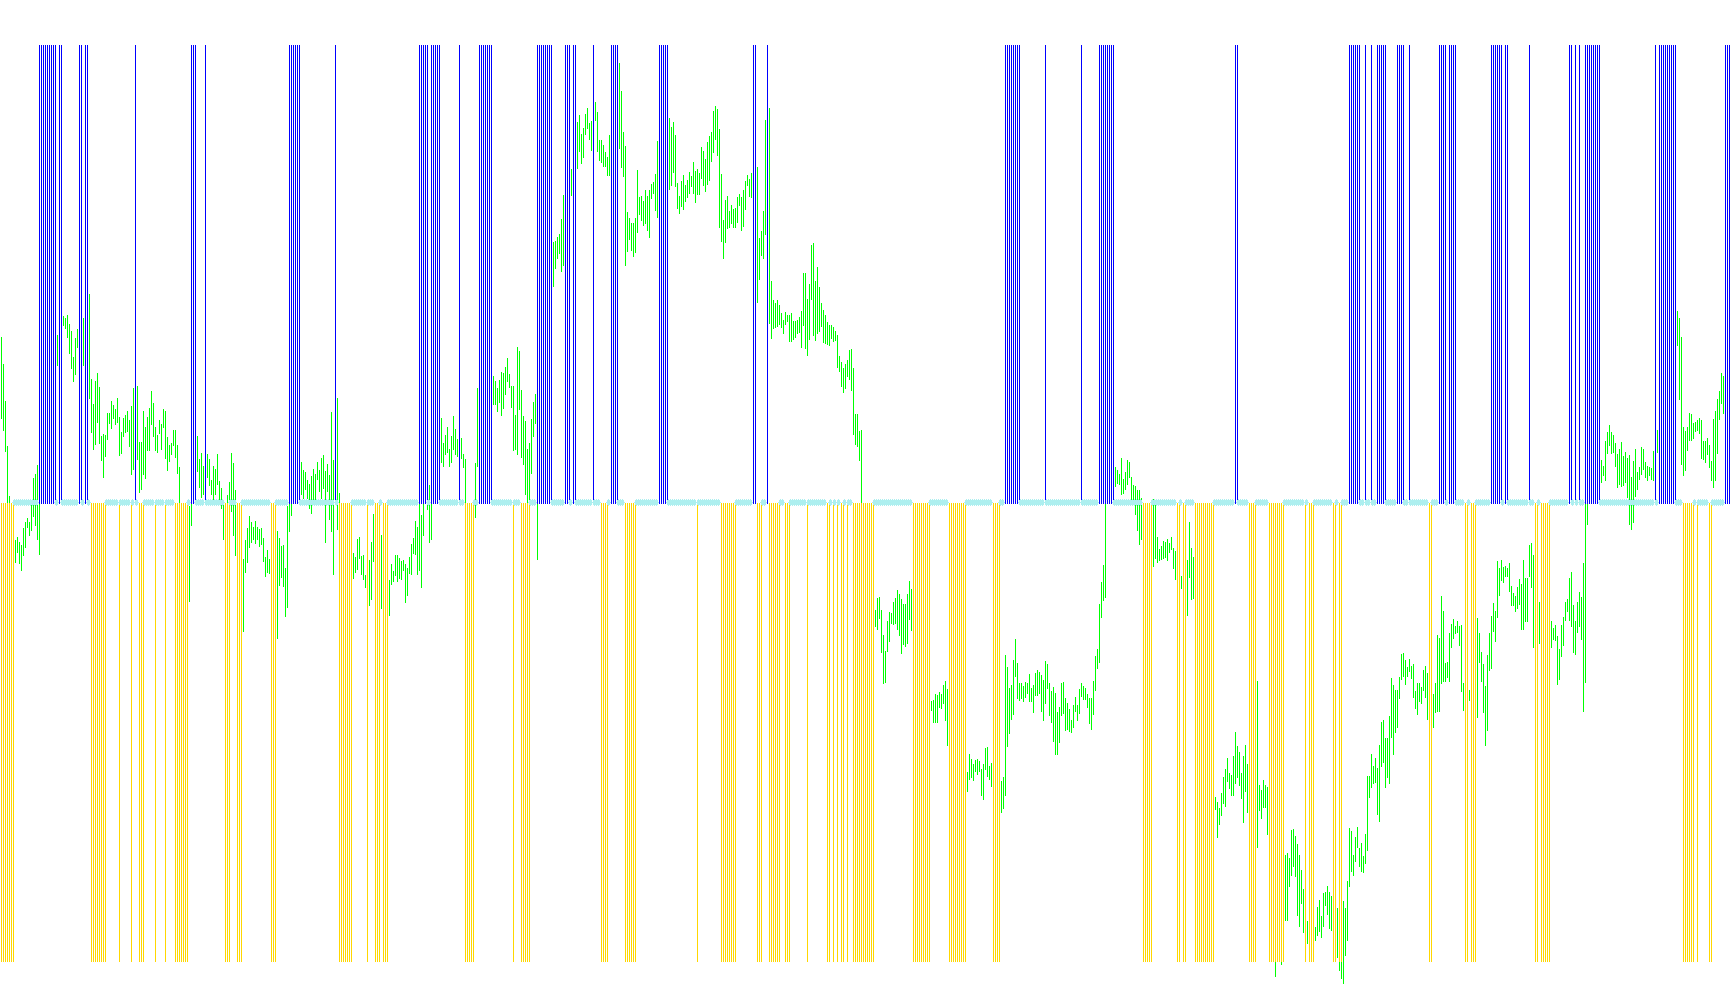
This technical indicator is designed to identify specific market trend reversals by analyzing multiple layers of price action data simultaneously. Instead of relying on a single metric, it combines moving averages, volatility bands, and momentum indicators to filter out "noise" and highlight high-probability entry points.
Core Analytical Components
The logic operates by monitoring four primary data streams:
- Moving Averages: The script tracks the current smoothed price average and compares it against its previous value to determine the immediate direction of the trend.
- Parabolic SAR (Stop and Reverse): This is used as a momentum filter. It helps the indicator distinguish between a temporary price fluctuation and a sustained shift in market direction.
- Bollinger Bands: The tool measures the "spread" or distance between the upper and lower volatility bands. By calculating the difference between these bands, it determines if the market has enough expansion (volatility) to sustain a move.
- Customized Smoothing (CABuf): The script uses a unique mathematical calculation to smooth out price data dynamically. It compares the current volatility against historical variance to decide how much of the new price movement should be factored into the final signal.
Signal Logic
The indicator generates visual signals based on a strict set of "confluence" rules—meaning all conditions must be met at the same time for a signal to appear.
Buy Signals (Bullish Momentum) A buy signal is triggered when the following conditions align:
- The current smoothed price average moves above its custom smoothed value.
- The price average is maintaining or increasing its upward trajectory.
- The Parabolic SAR indicates that price momentum has flipped to the upside.
- The volatility (Bollinger Band spread) is expanding significantly and is currently wider than it was in the previous period.
Sell Signals (Bearish Momentum) A sell signal is triggered when these conditions align:
- The current smoothed price average drops below its custom smoothed value.
- The price average is maintaining or increasing its downward trajectory.
- The Parabolic SAR indicates that price momentum has flipped to the downside.
- The volatility (Bollinger Band spread) is expanding significantly and is currently wider than it was in the previous period.
Visual Representation
To make this information easy to read on a chart, the indicator translates these complex calculations into three distinct visual elements:
- Red Histograms: Indicate potential sell opportunities.
- Lime Histograms: Indicate potential buy opportunities.
- Gold Arrows/Markers: Provide a secondary confirmation of the trend state.
By requiring the volatility to be increasing (bollingerdiff0 > bollingerdiff1), the logic ensures that signals are generated during active market participation, helping traders avoid "flat" markets where price movements lack conviction.
//+------------------------------------------------------------------+
//|                                                     Ind-GG01.mq4 |
//|                                                           GGekko |
//|                                                                  |
//+------------------------------------------------------------------+
//mod 2009fxtsd
#property copyright "GGekko"
#property link      ""

#property indicator_separate_window
#property indicator_buffers 3
#property indicator_color1 Red
#property indicator_color2 Lime
#property indicator_color3 Gold
#property indicator_width1 2
#property indicator_width2 2
#property indicator_width3 1
#property indicator_minimum -2
#property indicator_maximum 2

//---- buffers
double ExtMapBuffer1[];
double ExtMapBuffer2[];
double ExtMapBuffer3[];
double CABuf[];

double ma0,ma1;
double ca;
double psar;
double boll_upper0,boll_upper1;
double boll_lower0,boll_lower1;
double bollingerdiff0,bollingerdiff1;

extern int period_ma=5;
extern int period_ca=5;
extern int method_=MODE_SMMA;
extern int price_=PRICE_CLOSE;
extern double step_psar=0.01;
extern double max_psar=0.3;
extern int period_boll=14;
extern int dev_boll=2;
extern int bolldiff=15;

extern int barsToProcess=1500;

/*
PRICE_CLOSE	0	Close price.
PRICE_OPEN	1	Open price.
PRICE_HIGH	2	High price.
PRICE_LOW	3	Low price.
PRICE_MEDIAN	4	Median price, (high+low)/2.
PRICE_TYPICAL	5	Typical price, (high+low+close)/3.
PRICE_WEIGHTED	6	Weighted close price, (high+low+close+close)/4.

MODE_SMA	0	Simple moving average,
MODE_EMA	1	Exponential moving average,
MODE_SMMA	2	Smoothed moving average,
MODE_LWMA	3	Linear weighted moving average.
*/

//+------------------------------------------------------------------+
//| Custom indicator initialization function                         |
//+------------------------------------------------------------------+
int init()
  {
//---- indicators
   IndicatorBuffers(4);

   SetIndexStyle(0,DRAW_HISTOGRAM);
   SetIndexBuffer(0,ExtMapBuffer1);
   SetIndexEmptyValue(0,EMPTY_VALUE);
   SetIndexStyle(1,DRAW_HISTOGRAM);
   SetIndexBuffer(1,ExtMapBuffer2);
   SetIndexEmptyValue(1,EMPTY_VALUE);
   SetIndexStyle(2,DRAW_ARROW);
   SetIndexArrow(2,115);
   SetIndexBuffer(2,ExtMapBuffer3);
   SetIndexBuffer(3, CABuf);

   IndicatorShortName("GG01 ("+period_ma+","+period_ca+","+bolldiff+")");
//----
   return(0);
  }
//+------------------------------------------------------------------+
//| Custom indicator deinitialization function                       |
//+------------------------------------------------------------------+
int deinit()
  {
//----

//----
   return(0);
  }
//+------------------------------------------------------------------+
//| Custom indicator iteration function                              |
//+------------------------------------------------------------------+
int start()
  {
   int    counted_bars=IndicatorCounted(), limit;
   int i=0;
   if(counted_bars<0) return(-1);
   if(counted_bars>0)
      counted_bars--;

   limit=Bars-counted_bars;
         limit=MathMin(limit,barsToProcess);
   for (i=limit-1; i>= 0; i--)

   {

   ma0=iMA(NULL,0,period_ma,0,method_,price_,i);
   ma1=iMA(NULL,0,period_ma,0,method_,price_,i+1);

// ca=iCustom(NULL,0,"i-CAi",period_ca,method_,price_,0,i);

   psar=iSAR(NULL,0,step_psar,max_psar,i);
   boll_lower0=iBands(NULL,0,period_boll,dev_boll,0,PRICE_CLOSE,MODE_LOWER,i);
   boll_upper0=iBands(NULL,0,period_boll,dev_boll,0,PRICE_CLOSE,MODE_UPPER,i);
   bollingerdiff0=(boll_upper0-boll_lower0)/Point;
   boll_lower1=iBands(NULL,0,period_boll,dev_boll,0,PRICE_CLOSE,MODE_LOWER,i+1);
   boll_upper1=iBands(NULL,0,period_boll,dev_boll,0,PRICE_CLOSE,MODE_UPPER,i+1);
   bollingerdiff1=(boll_upper1-boll_lower1)/Point;

      double v1, v2, k;

      v1=MathPow(iStdDev(NULL, 0, period_ca, 0, method_, price_, i), 2);
      v2=MathPow(CABuf[i+1] - ma0, 2);
      k=0;
      if (v2 < v1 || v2==0) k=0; else k=1 - v1/v2;

      CABuf[i]=CABuf[i+1] + k*(ma0-CABuf[i+1]);
      ca=CABuf[i];

   //SELL SIGNAL
   if(ma0<ca && ma0<=ma1 && psar>Close[i] && bollingerdiff0>bolldiff && bollingerdiff0>bollingerdiff1)
      ExtMapBuffer1[i]=-1;
   else ExtMapBuffer1[i]=EMPTY_VALUE;


   //BUY SIGNAL
   if(ma0>ca && ma0>=ma1 && psar<Close[i] && bollingerdiff0>bolldiff && bollingerdiff0>bollingerdiff1)
      ExtMapBuffer2[i]=1;
   else ExtMapBuffer2[i]=EMPTY_VALUE;


   if(ExtMapBuffer1[i]==EMPTY_VALUE && ExtMapBuffer2[i]==EMPTY_VALUE)
      ExtMapBuffer3[i]=0;
   else ExtMapBuffer3[i]=EMPTY_VALUE;


//   i++;
   }

//   Comment("GG01 ("+period_ma+","+period_ca+","+bolldiff+")");

//----
   return(0);
  }
//+------------------------------------------------------------------+
Comments