Ind-TRWscalper
Download script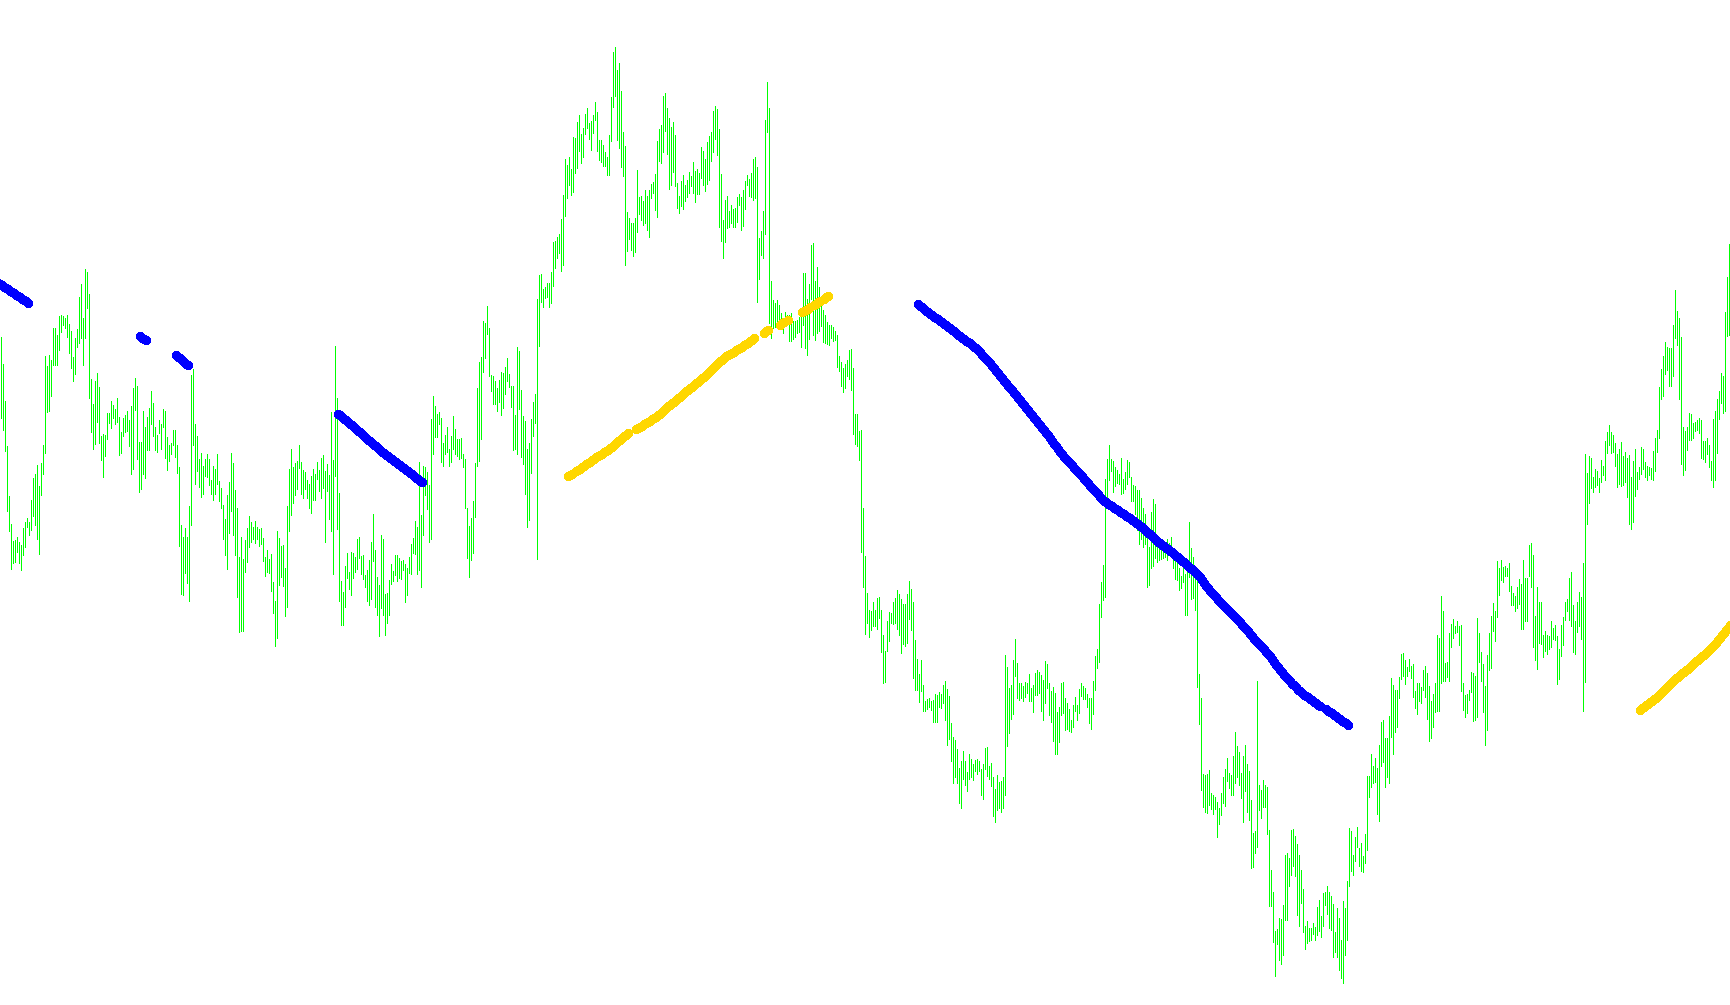
This tool is designed to help traders identify significant trend shifts by monitoring the movement of a long-term moving average. Instead of reacting to every minor price fluctuation, the script filters out "market noise" to highlight sustained momentum in either an upward or downward direction.
How the Logic Works
The indicator operates by analyzing a Simple Moving Average (SMA) over a specific period (defaulted to 220 bars). It looks at the relationship between three consecutive data points of this moving average to determine if a trend is gaining strength.
1. Upward Trend Detection (Bullish Signal) The script identifies a potential upward move when it detects a "staircase" effect in the moving average. Specifically, it checks if:
- The current value is higher than the previous value.
- The previous value is higher than the value before that.
- The difference between the current and previous value is significant enough to cross a specific sensitivity threshold.
When these conditions are met, the script places a visual marker (a lime-colored arrow) on the chart. This suggests that the price momentum is moving consistently higher.
2. Downward Trend Detection (Bearish Signal) Similarly, the script looks for a consistent "downward staircase" to identify selling pressure. It triggers a signal when:
- The current value is lower than the previous value.
- The previous value is lower than the value before that.
- The difference between the current and previous value exceeds the set sensitivity threshold.
When this occurs, the script places a visual marker (a red-colored arrow) on the chart, indicating that the price momentum is moving consistently lower.
Key Features for the User
- Sensitivity Control: Through the Cross_Over_Threshold setting, users can decide how "aggressive" the indicator should be. A smaller number will pick up minor shifts, while a larger number will ensure the script only alerts you to major, high-conviction moves.
- Historical Analysis: The tool is designed to process a large amount of historical data (up to 5,000 bars), allowing traders to see how past trends behaved and identify recurring patterns.
- Visual Clarity: Rather than cluttering the screen with lines or complex data tables, the script provides clean, actionable visual cues directly on the price chart, making it easier to spot entry or exit points at a glance.
//+------------------------------------------------------------------+
//| ADX Crossing.mq4
//| Amir
//+------------------------------------------------------------------+
#property  copyright "Author - Amir"

#property indicator_chart_window
#property indicator_buffers 2
#property indicator_color1 Lime
#property indicator_color2 Red

//---- input parameters
extern int Ma_Period=220;
extern double Cross_Over_Threshold=0.00003;
extern int CountBars=5000;

//---- buffers
double val1[];
double val2[];
double Ma0,Ma1,Ma2;
//+------------------------------------------------------------------+
//| Custom indicator initialization function                         |
//+------------------------------------------------------------------+
int init()
  {
   string short_name;
//---- indicator line
   IndicatorBuffers(2);
   SetIndexStyle(0,DRAW_ARROW);
   SetIndexArrow(0,108);
   SetIndexStyle(1,DRAW_ARROW);
   SetIndexArrow(1,108);
   SetIndexBuffer(0,val1);
   SetIndexBuffer(1,val2);
//----
   return(0);
  }
//+------------------------------------------------------------------+
//| AltrTrend_Signal_v2_2                                            |
//+------------------------------------------------------------------+
int start()
  {
   if (CountBars>=Bars) CountBars=Bars;
   SetIndexDrawBegin(0,Bars-CountBars);
   SetIndexDrawBegin(1,Bars-CountBars);
   int i,shift,counted_bars=IndicatorCounted();


   //---- check for possible errors
   if(counted_bars<0) return(-1);

   //---- initial zero
   if(counted_bars<1)
     {
      for(i=1;i<=CountBars;i++) val1[CountBars-i]=0.0;
      for(i=1;i<=CountBars;i++) val2[CountBars-i]=0.0;
     }

for (shift = CountBars; shift>=0; shift--)
{

  Ma0=iMA(Symbol(),Period(),Ma_Period, 0, MODE_SMA, PRICE_MEDIAN,shift  );
  Ma1=iMA(Symbol(),Period(),Ma_Period, 0, MODE_SMA, PRICE_MEDIAN,shift+1);
  Ma2=iMA(Symbol(),Period(),Ma_Period, 0, MODE_SMA, PRICE_MEDIAN,shift+2);


 if  (( MathAbs(Ma0-Ma1)>Cross_Over_Threshold) && Ma0>Ma1 && Ma1>Ma2)

{
	val1[shift]=Ma0;
}


 if  (( MathAbs(Ma0-Ma1)>Cross_Over_Threshold) && Ma0<Ma1 && Ma1<Ma2)

{
	val2[shift]=Ma0;
}

}
   return(0);
  }
//+------------------------------------------------------------------+
Comments