ind3
Download script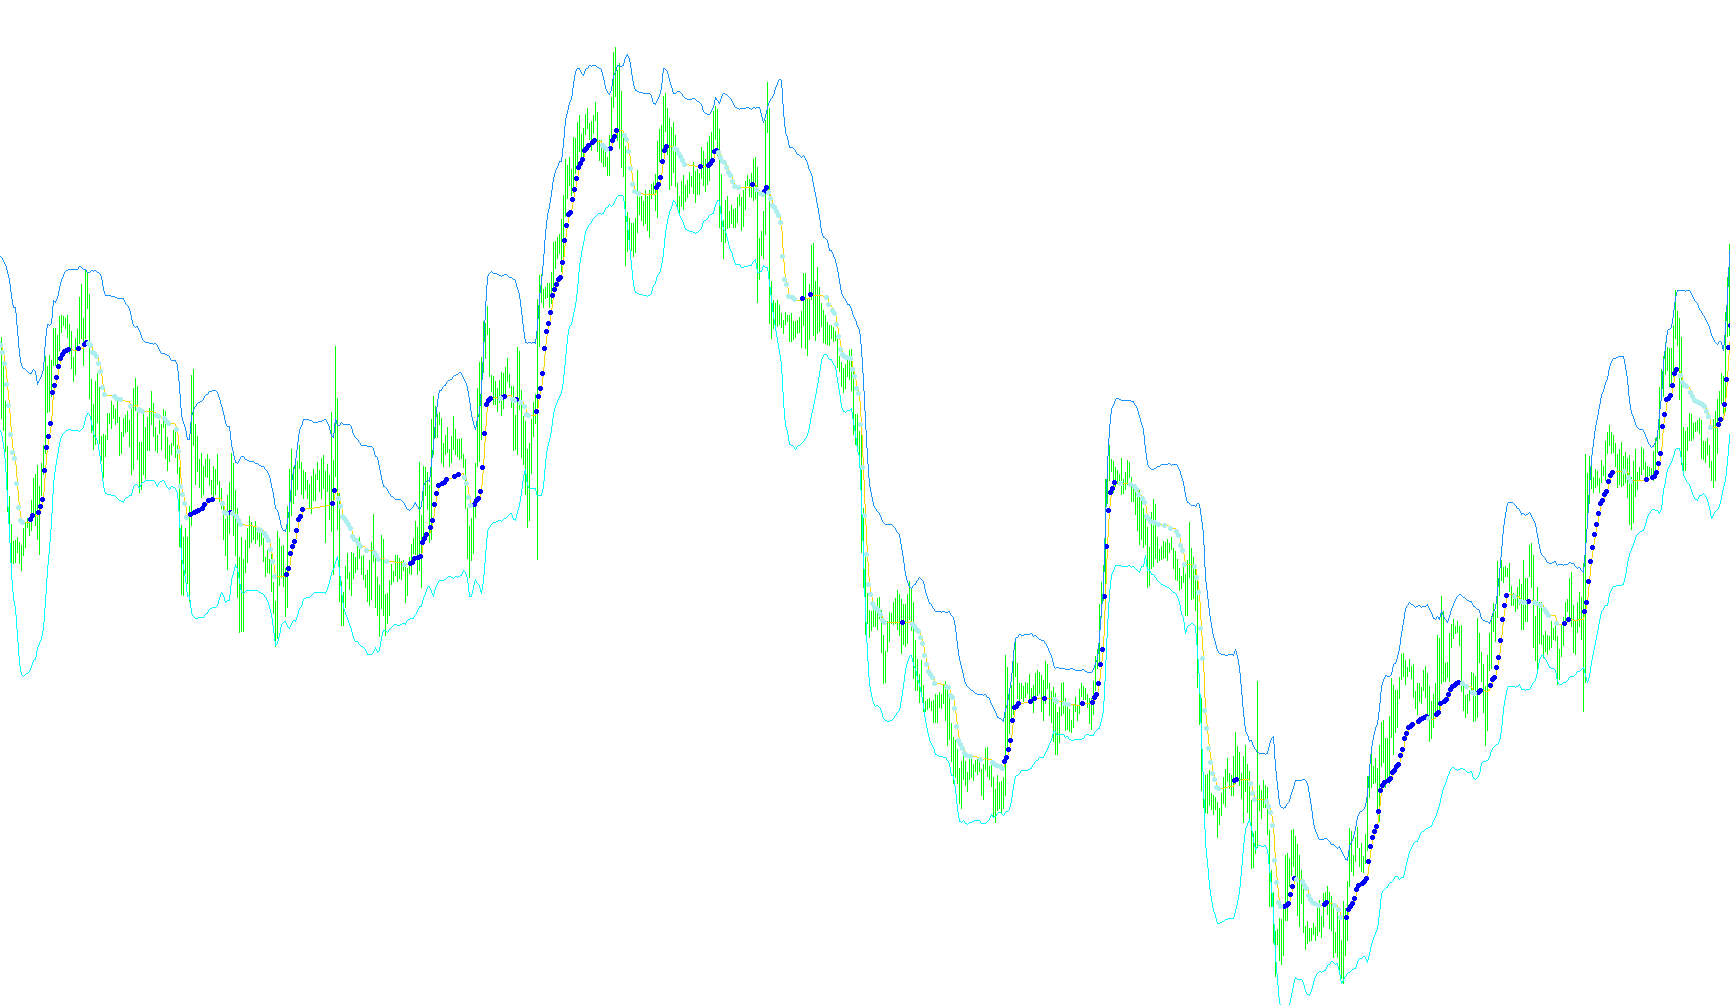
This tool is designed to help traders identify market trends and specific momentum shifts by analyzing price movement through a series of mathematical filters. Instead of just looking at raw price action, it processes the data to smooth out "market noise" and highlight significant changes in direction.
Core Mechanics
The logic operates by calculating a sophisticated moving average that reacts differently to different types of market conditions:
- Volatility Awareness: The tool measures the difference between current prices and prices from a set period ago. It then compares this change against the general volatility (noise) of the market. This allows the indicator to distinguish between a meaningful price move and a random, minor fluctuation.
- Dynamic Smoothing: It uses a customized formula to blend fast and slow market speeds. By doing this, the tool creates a "smoothed" trend line that stays closer to the actual price during strong movements but remains steady during consolidation.
Visual Components and Signals
The indicator provides three primary layers of information on your chart:
- The Trend Line: A continuous line that represents the smoothed average of the price. This serves as the baseline for understanding the current market direction.
- Volatility Bands: The script calculates "bands" (similar to Bollinger Bands) based on the standard deviation of the price relative to the smoothed trend. These bands help visualize the range of normal price behavior; when the price pushes toward or beyond these boundaries, it indicates high volatility.
- Directional Alerts: The tool automatically identifies specific points where the trend changes significantly. It looks for instances where the distance between the current smoothed average and the previous value exceeds a specific threshold.
- When a significant upward shift is detected, an arrow appears to signal a potential bullish move.
- When a significant downward shift is detected, an arrow appears to signal a potential bearish move.
Summary for the Trader
Essentially, this script filters out the "jitter" of the market to show you the underlying path of the price. It provides a visual guide for the trend, defines the boundaries of normal volatility, and places specific markers on the chart when the momentum shifts strongly enough to warrant attention.
#property copyright ""
#property link      ""

#property indicator_chart_window
#property indicator_buffers 5
#property indicator_color1 Sienna
#property indicator_color2 DeepSkyBlue
#property indicator_color3 Gold
#property indicator_color4 White
#property indicator_color5 White

//---- input parameters
extern int       periodAMA=9;
extern int       nfast=2;
extern int       nslow=30;
extern double    G=2.0;
extern double    dK=2.0;
extern int BollingerPeriod=20;
extern double K_Bollinger=2.0;
//---- buffers
double kAMAbuffer[];
double kAMAupsig[];
double kAMAdownsig[];
double UpBand[];
double DownBand[];
//+------------------------------------------------------------------+

int    k=0, cbars=0, prevbars=0, prevtime=0;

double slowSC,fastSC;

//+------------------------------------------------------------------+
//| Custom indicator initialization function                         |
//+------------------------------------------------------------------+
int init()
  {
//---- indicators
   SetIndexStyle(0,DRAW_LINE);
   SetIndexStyle(1,DRAW_ARROW);
   SetIndexArrow(1,159);
   SetIndexStyle(2,DRAW_ARROW);
   SetIndexArrow(2,159);
   SetIndexStyle(3,DRAW_LINE);
   SetIndexStyle(4,DRAW_LINE);
   //SetIndexDrawBegin(0,nslow+nfast);
   SetIndexBuffer(0,kAMAbuffer);
   SetIndexBuffer(1,kAMAupsig);
   SetIndexBuffer(2,kAMAdownsig);
   SetIndexBuffer(3,UpBand);
   SetIndexBuffer(4,DownBand);

   IndicatorDigits(4);

//----
   return(0);
  }
//+------------------------------------------------------------------+
//| Custom indicator deinitialization function                       |
//+------------------------------------------------------------------+
int deinit()
  {
   return(0);
  }
//+------------------------------------------------------------------+
//| Custom indicator iteration function                              |
//+------------------------------------------------------------------+
int start()
  {
   int    i,pos=0;
   double noise=0.000000001,AMA,AMA0,signal,ER;
   double dSC,ERSC,SSC,ddK;
   int counter_Boll;
   double deviation;

   if (prevbars==Bars) return(0);

//---- TODO: add your code here
   slowSC=(2.0 /(nslow+1));
   fastSC=(2.0 /(nfast+1));
   cbars=IndicatorCounted();
   if (Bars<=(periodAMA+2)) return(0);
//---- check for possible errors
   if (cbars<0) return(-1);
//---- last counted bar will be recounted
   if (cbars>0) cbars--;
   pos=Bars-periodAMA-2;
   AMA0=Close[pos+1];
   while (pos>=0)
     {
      kAMAupsig[pos]=NULL;
      kAMAdownsig[pos]=NULL;
      if(pos==Bars-periodAMA-2) AMA0=Close[pos+1];
      signal=MathAbs(Close[pos]-Close[pos+periodAMA]);
      noise=0.000000001;
      for(i=0;i<periodAMA;i++)
       {
        noise=noise+MathAbs(Close[pos+i]-Close[pos+i+1]);
       };
      ER =signal/noise;
      dSC=(fastSC-slowSC);
      ERSC=ER*dSC;
      SSC=ERSC+slowSC;
      AMA=AMA0+(MathPow(SSC,G)*(Close[pos]-AMA0));
      kAMAbuffer[pos]=AMA;
      deviation=0;
      for (counter_Boll=0;counter_Boll<BollingerPeriod;counter_Boll++) deviation=deviation+MathPow(Close[pos+counter_Boll]-kAMAbuffer[pos+counter_Boll],2);
      deviation=MathSqrt(deviation/BollingerPeriod);
      UpBand[pos]=AMA+deviation*K_Bollinger;
      DownBand[pos]=AMA-deviation*K_Bollinger;
      ddK=(AMA-AMA0);
      if ((MathAbs(ddK) > (dK*Point)) && (ddK > 0))  kAMAupsig[pos]  =AMA;
      if ((MathAbs(ddK)) > (dK*Point) && (ddK < 0))  kAMAdownsig[pos]=AMA;

      AMA0=AMA;
      pos--;
     };
//----
   prevbars=Bars;
   return(0);
  }
Comments