IND InverseB_v1
Download script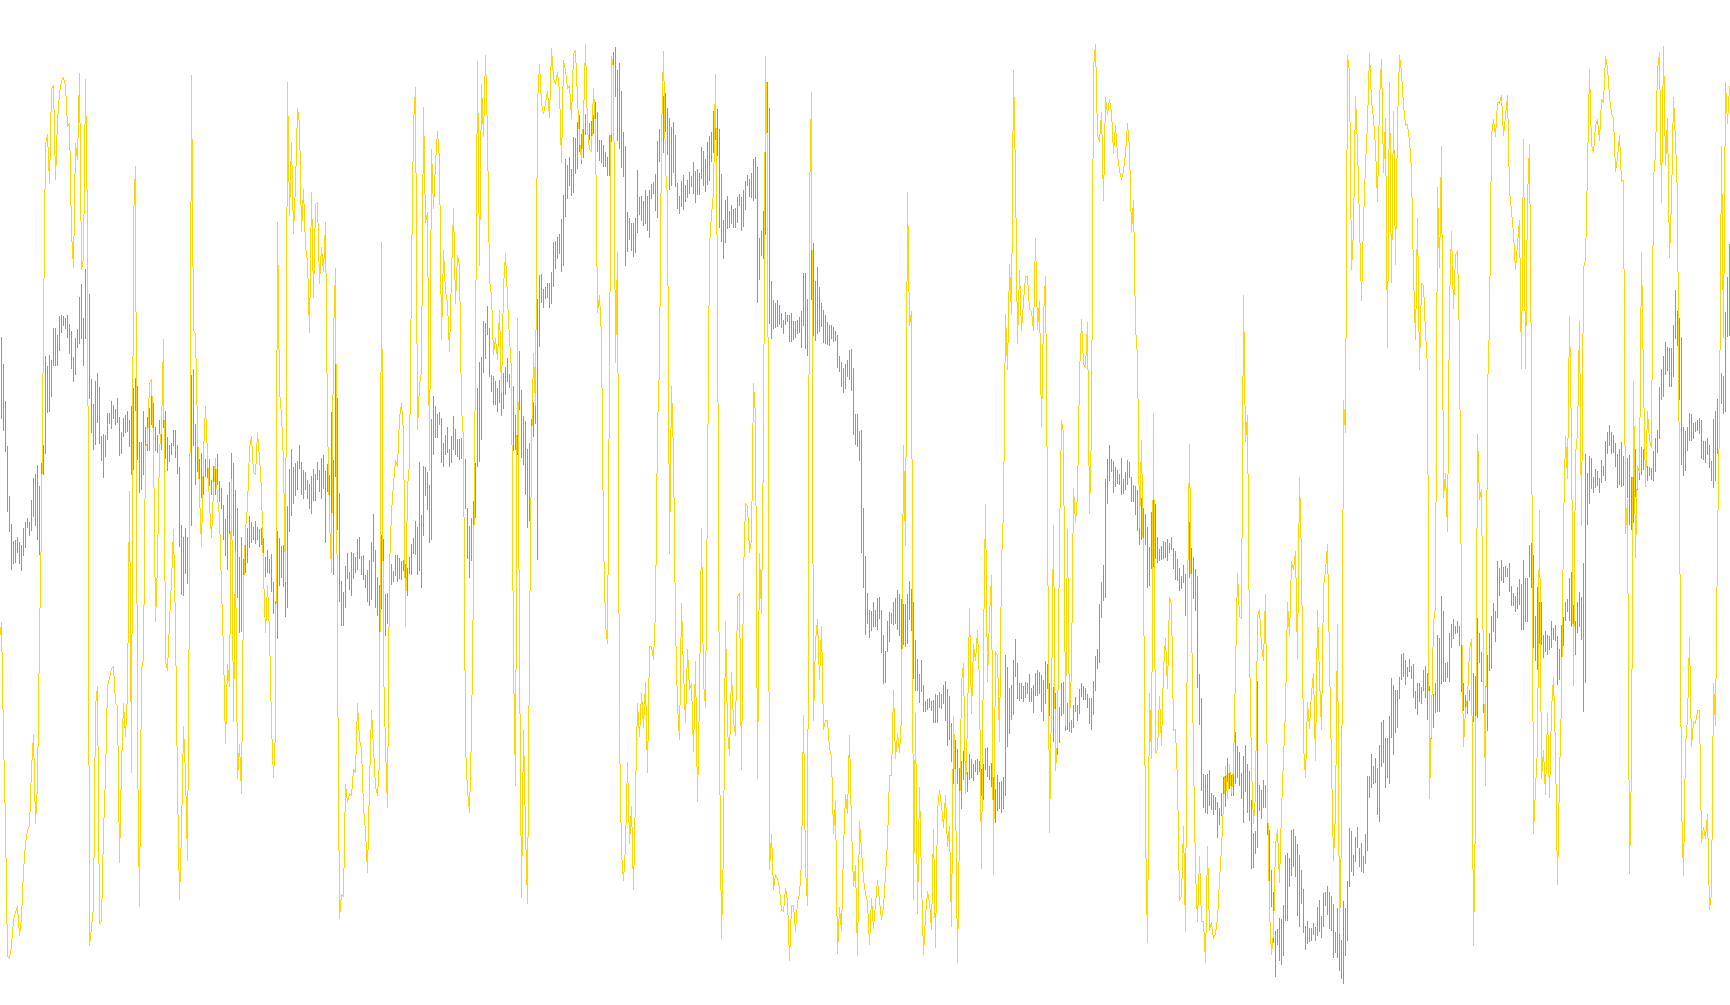
This indicator is designed to provide visual analysis of price action by calculating the relative position of the current market price within a specific range. Instead of showing the raw price of an asset, it creates a normalized value that helps traders visualize where the price sits between historical highs and lows.
How the Logic Works
The script operates by scanning a specific window of recent price data to establish a "trading zone." Here is the step-by-step logic:
- Identifying Extremes: The tool looks back at a set number of candles (determined by the user input) to identify two key levels: the highest price reached and the lowest price reached during that timeframe.
- Calculating Amplitude: Once these two extremes are found, the script calculates the total distance between them. This distance represents the "range" or "volatility" of the current market movement.
- Determining the Midpoint: The logic then finds the exact center point of that range. This serves as a baseline for measuring price strength.
- Relative Positioning: Finally, the script looks at the most recent closing price and determines how far it sits above or below that midpoint relative to the total range.
What it Shows You
The result is displayed as a line on a separate window in your trading platform. Rather than showing you "how much" a currency is worth, it shows you "where" the price is moving within its recent range.
When the line moves toward the upper limit of its scale, it indicates that the price is currently trading near its recent highs. When it moves toward the lower limit, it suggests the price is hugging its recent lows. This allows traders to see the momentum and "stretch" of the market in a simplified, standardized format.
/*-----------------------------+
|			       |
| Shared by www.Aptrafx.com    |
|			       |
+------------------------------*/

//+------------------------------------------------------------------+
//|                                               IND Inverse.mq4 |
//+------------------------------------------------------------------+
#property copyright "Copyright © 2006, ..."
#property link      "http://www.forex-tsd.com/"

#property indicator_separate_window
#property indicator_buffers 1
#property indicator_color1 Silver
//---- input parameters
//---- buffers
double Buffer[];

extern int iPeriod = 1;

//----
//+------------------------------------------------------------------+
//| Init                                                             |
//+------------------------------------------------------------------+
int init()
{
//---- indicators
    IndicatorBuffers(1);
    IndicatorDigits(Digits+2);
    SetIndexStyle(0,DRAW_LINE);
    SetIndexBuffer(0,Buffer);
//----
    return(0);
}

//+------------------------------------------------------------------+
//| Parabolic Sell And Reverse system                                |
//+------------------------------------------------------------------+
int start()
  {
   int limit;
   int counted_bars=IndicatorCounted();

//---- check for possible errors
   if(counted_bars<0)
   {
      return(-1);
   }
//---- last counted bar will be recounted
   if(counted_bars>0) counted_bars--;
   limit=Bars-counted_bars;

//---- do it


    for(int i=0; i<limit; i++)
    {
        // Easy to read
        double HD = High[Highest(NULL,0,MODE_HIGH,(iPeriod* 20),i)];
        double LD = Low[Lowest(NULL,0,MODE_LOW,(iPeriod* 20),i)];
        double amplitude = HD - LD;
        Buffer[i]= ((Close[i]-(HD-(amplitude/2)))/amplitude) * iPeriod;
    }

//----
   return(0);
  }
//+------------------------------------------------------------------+
Comments