Ichimoku_sigTKSCcrossChiko
Indicator

Ichimoku_sigTKSCcrossChiko

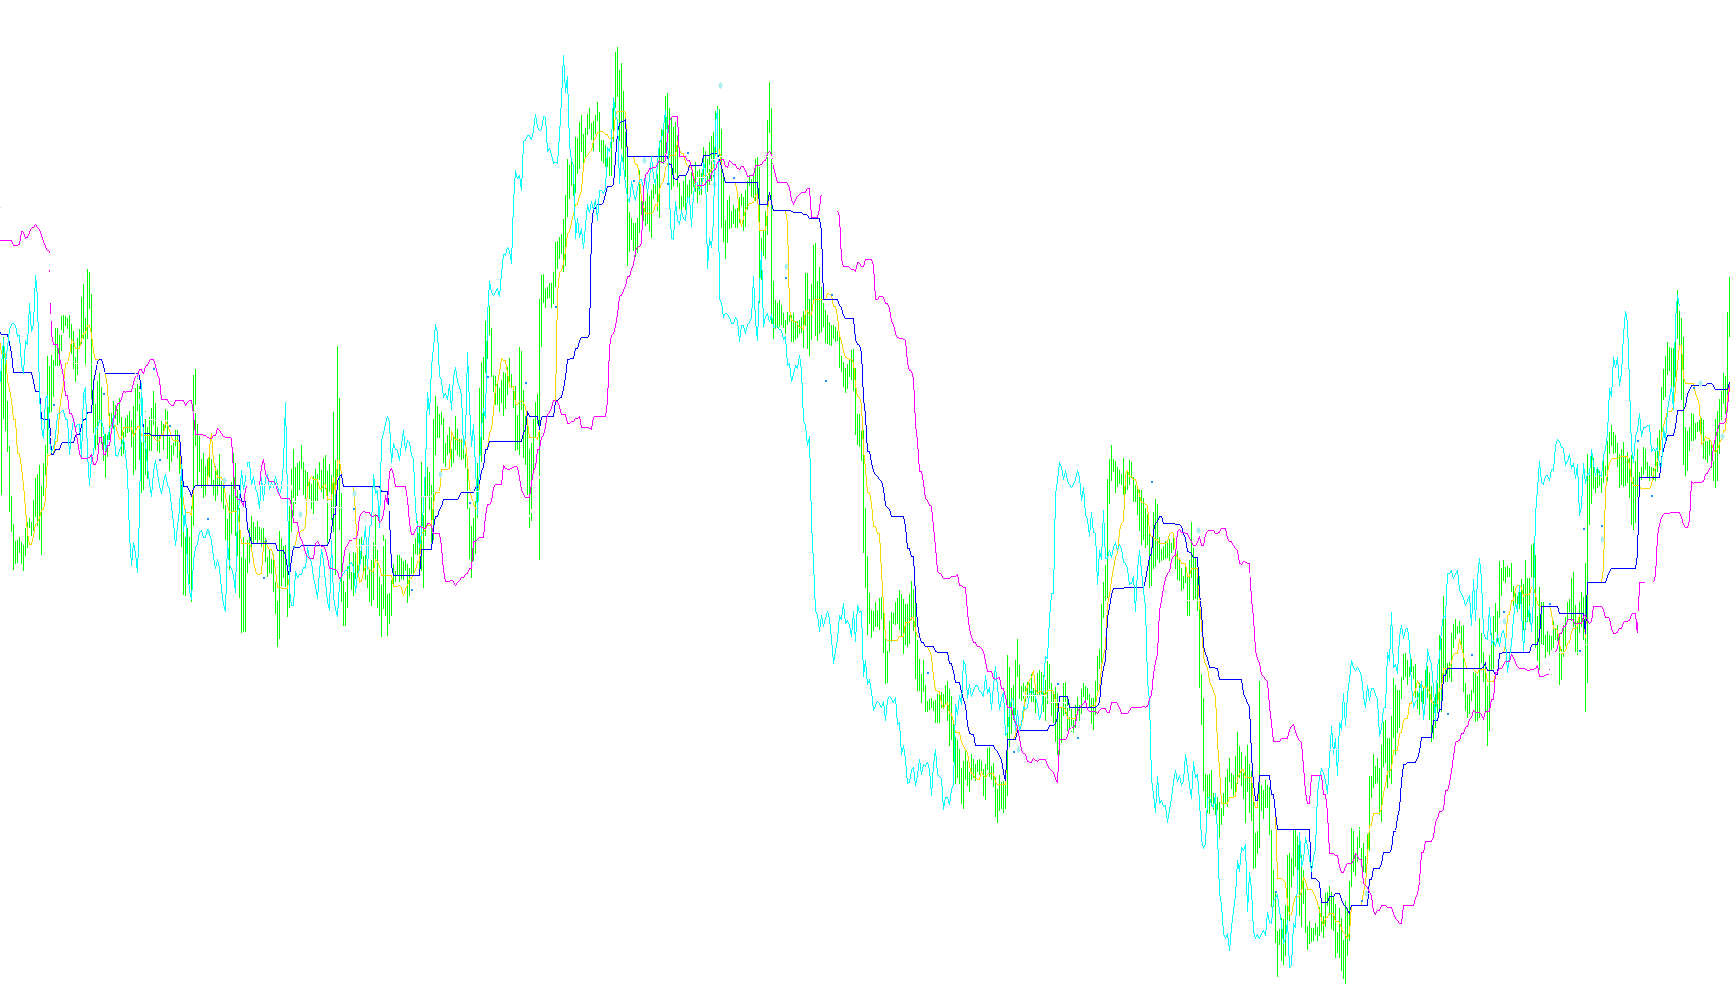
This technical indicator identifies trend reversals and momentum shifts by plotting the Tenkan-Sen, Kijun-Sen, and Senkou Spans while generating visual markers for dynamic line crossovers and cloud penetrations.

Ichimoku_v1
Indicator

Ichimoku_v1

This indicator synthesizes multi-period price extremes to project trend momentum, support zones, and lagging price correlations through a comprehensive geometric framework.

Ichi_KUMOGD_sw
Indicator

Ichi_KUMOGD_sw

iIchimoku
Ichi_KUMO_TC_sw
Indicator

Ichi_KUMO_TC_sw

iIchimoku
Ichi_Tenkan_Kijun_MTF
Indicator

Ichi_Tenkan_Kijun_MTF

iIchimoku
Icho-Trend
Indicator

Icho-Trend

This indicator identifies trend direction by comparing the midpoints of a specific price range against a delayed offset value to detect structural shifts.

Icho-Trend_v1
Indicator

Icho-Trend_v1

Identifies directional bias by comparing the mean price of a primary lookback window against a shifted secondary window to detect structural momentum shifts.

Indicator

ICWR v0.1 beta2

iRSI
Indicator

ICWR v0.1 beta3

iRSI
Indicator

ICWR v0.1 beta4

iMAiRSI
Indicator

ICWR v0.1 beta5

iMAiRSI
Indicator

ICWR v0.1.1 beta5

iMAiRSI
Indicator

ICWR v0.1.1 beta5_v1

iMAiRSI
Indicator

ICWR v0.1BETA

Indicator

ICWR v0

iRSI
Indicator

ICWR v0[1].1_BETA5

iMAiRSI
Indicator

ICWR v0_v1

iRSI
Indicator

ICWR v0_v2

iRSI
ICWR+fib
Indicator

ICWR+fib

iRSI

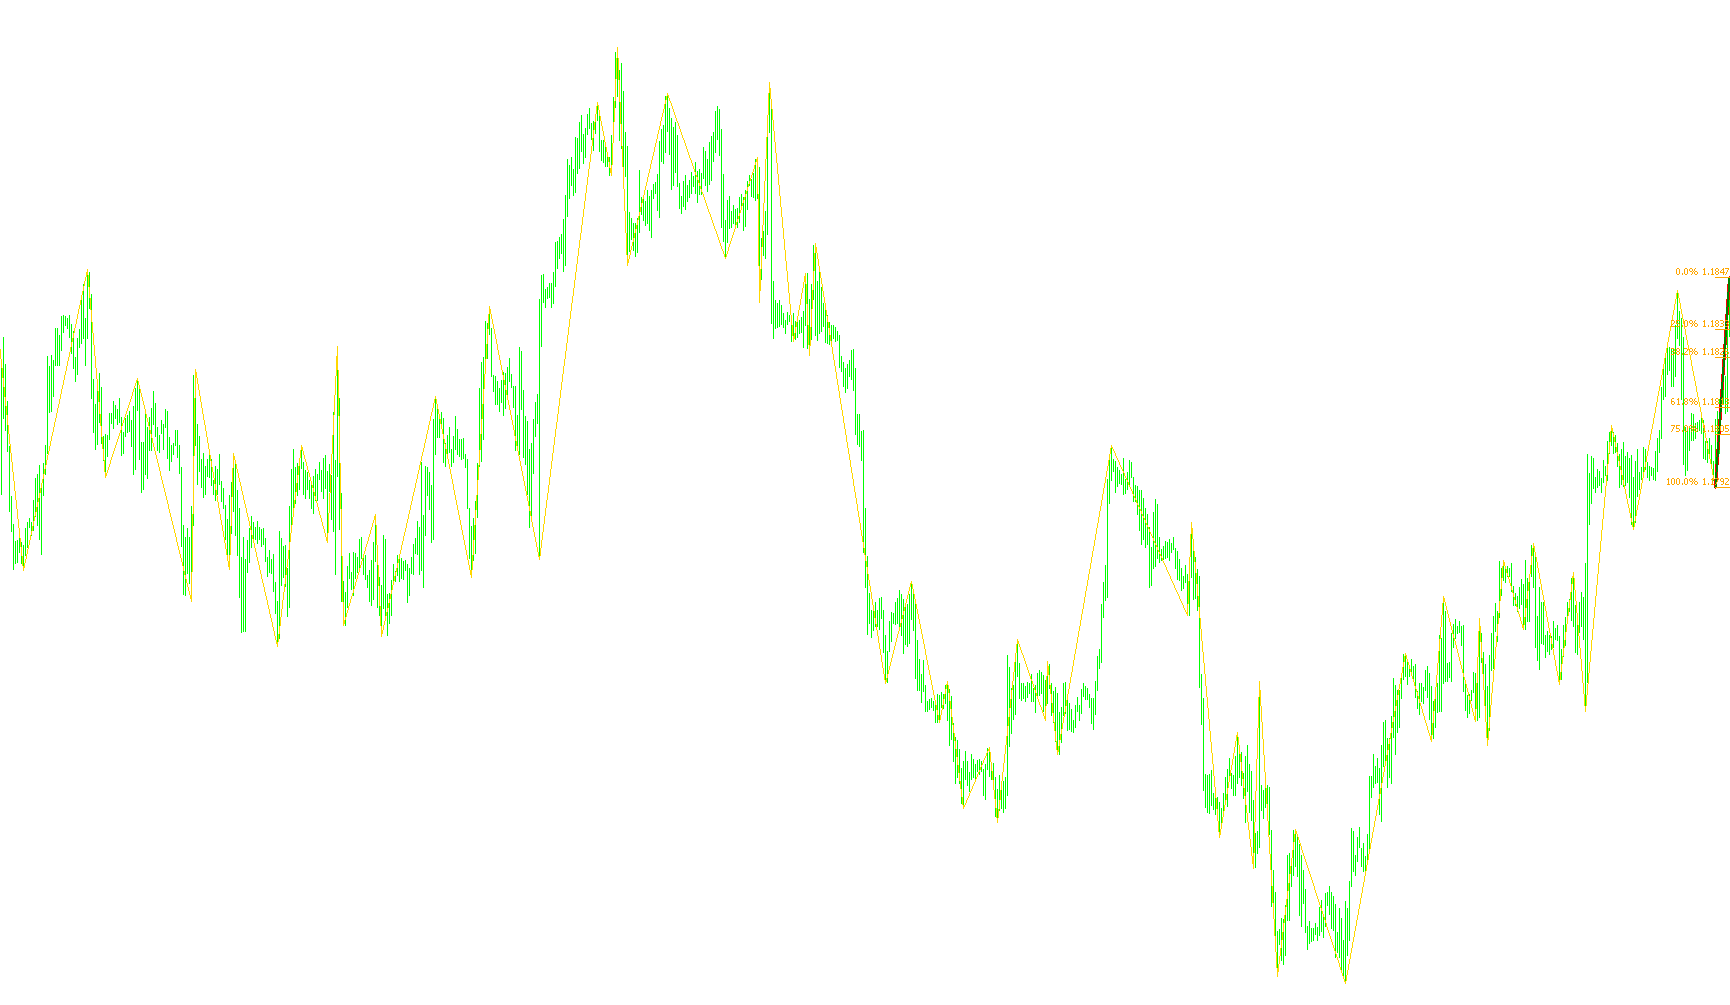
This indicator identifies significant price structural swings by detecting local extrema and automatically projecting Fibonacci retracement levels onto the most recent validated trend wave.

ICWR+HISTORY
Indicator

ICWR+HISTORY

iRSI

This indicator autonomously identifies significant market price swings using a custom zigzag algorithm to project automated Fibonacci retracement levels and structural zones.

ICWR.a
Indicator

ICWR.a

iRSI

This indicator dynamically identifies significant market structural swings using a zigzag algorithm and automatically plots trend waves along with Fibonacci retracement levels for precise pivot analysis.

ICWR.a_v1
Indicator

ICWR.a_v1

iRSI

This indicator identifies structural zig-zag price pivots and automatically projects dynamic Fibonacci retracement levels onto valid trend waves.

ICWR
Indicator

ICWR

iRSI

This indicator identifies significant market structural swings by filtering price extremes into zig-zag patterns and automatically projects Fibonacci retracement levels on the most recent valid wave.

ICWRr
Indicator

ICWRr

This indicator identifies significant price pivot points to automatically detect market waves and calculate key Fibonacci retracement levels.

ICWR_001
Indicator

ICWR_001

This indicator identifies significant price extrema to project structural trend waves and automatically overlay corresponding Fibonacci retracement levels.

ICWR_v2
Indicator

ICWR_v2

This indicator identifies significant structural price swings by filtering extreme price points to automatically plot active trend waves and dynamic Fibonacci retracement levels.

ICWR_v3
Indicator

ICWR_v3

This indicator identifies significant structural price pivots and automatically projects Fibonacci retracement levels based on the most recent high-magnitude price swings.

id
Indicator

id

Calculates and projects potential future price boundaries by analyzing historical daily candle geometry and weighted pivot points.

iDPO
Indicator

iDPO

iMA

This indicator calculates the instantaneous price variance between two moving average periods to isolate cyclical oscillations from overarching market trends.

Indicator

IDT_buy_limit

Indicator

IDT_buy_order

IDT_close_profit_positions
Indicator

IDT_close_profit_positions

Automatically identifies and executes market exit orders for all open positions currently trading in a positive profit state.

IDT_more_profit
Indicator

IDT_more_profit

This script iterates through open positions and incrementally pushes the take-profit levels further in the direction of the current profit to capture extended price movements.

Indicator

IDT_sell_limit

Indicator

IDT_sell_order

IDT_variables
Indicator

IDT_variables

The script identifies market states by comparing recent price ranges and volume to dynamically adjust trading parameters such as profit targets, risk exposure, and expiration times.

iExposure
Indicator

iExposure

This indicator dynamically calculates and displays a real-time tabular summary of open positions across multiple symbols, detailing volume, pricing, net exposure, and aggregated floating profits.

Indicator

iFirebird

IFish
Indicator

IFish

iMAOnArrayiRSI

This indicator applies a linear weight adjustment to RSI values, smooths them via a Linear Weighted Moving Average, and maps the final output through a hyperbolic tangent sigmoid function to normalize price momentum.

IFish_v1
Indicator

IFish_v1

iMAOnArrayiRSI

This indicator transforms a normalized RSI deviation into a hyperbolic tangent mapped signal to identify extreme momentum reversals.

IFish_v2
Indicator

IFish_v2

iMAOnArrayiRSI

This indicator applies a hyperbolic tangent transformation to a Linear Weighted Moving Average of an offset Relative Strength Index to generate bounded momentum signals.

iFractals
Indicator

iFractals

iFractals
iFractals2
Indicator

iFractals2

iFractals
iFXAnalyser
Indicator

iFXAnalyser

iMA

This indicator quantifies market momentum by calculating the first derivative (divergence), velocity (slope), and acceleration of two distinct moving averages.

iFXAnalyser_H4-Open
Indicator

iFXAnalyser_H4-Open

iMA

This indicator calculates the numerical spread between two moving averages to identify trend velocity, slope changes, and acceleration dynamics.

iFXAnalyser_H4-Open1
Indicator

iFXAnalyser_H4-Open1

iMA

This indicator quantifies the spread between two moving averages to identify momentum divergence, its directional slope, and acceleration rates.

iFXAnalyser_H4-Open1_v1
Indicator

iFXAnalyser_H4-Open1_v1

iMA

This indicator quantifies the spread between two moving averages and calculates its rate of change to identify price momentum acceleration.

iFXAnalyser_H4-Open_v1
Indicator

iFXAnalyser_H4-Open_v1

iMA

This indicator quantifies market momentum by calculating the variance between two moving averages and deriving its first-order rate of change to detect slope acceleration.

iFXAnalyser_H4
Indicator

iFXAnalyser_H4

iMA

The indicator quantifies market momentum by calculating the instantaneous spread between two fast-moving averages and identifying the subsequent rate of change in that divergence.

iFXAnalyser_H4_Ron_v011
Indicator

iFXAnalyser_H4_Ron_v011

iMA

This indicator calculates the numerical variance between fast and slow moving averages to identify extreme price velocity and momentum shifts via threshold-based signaling.