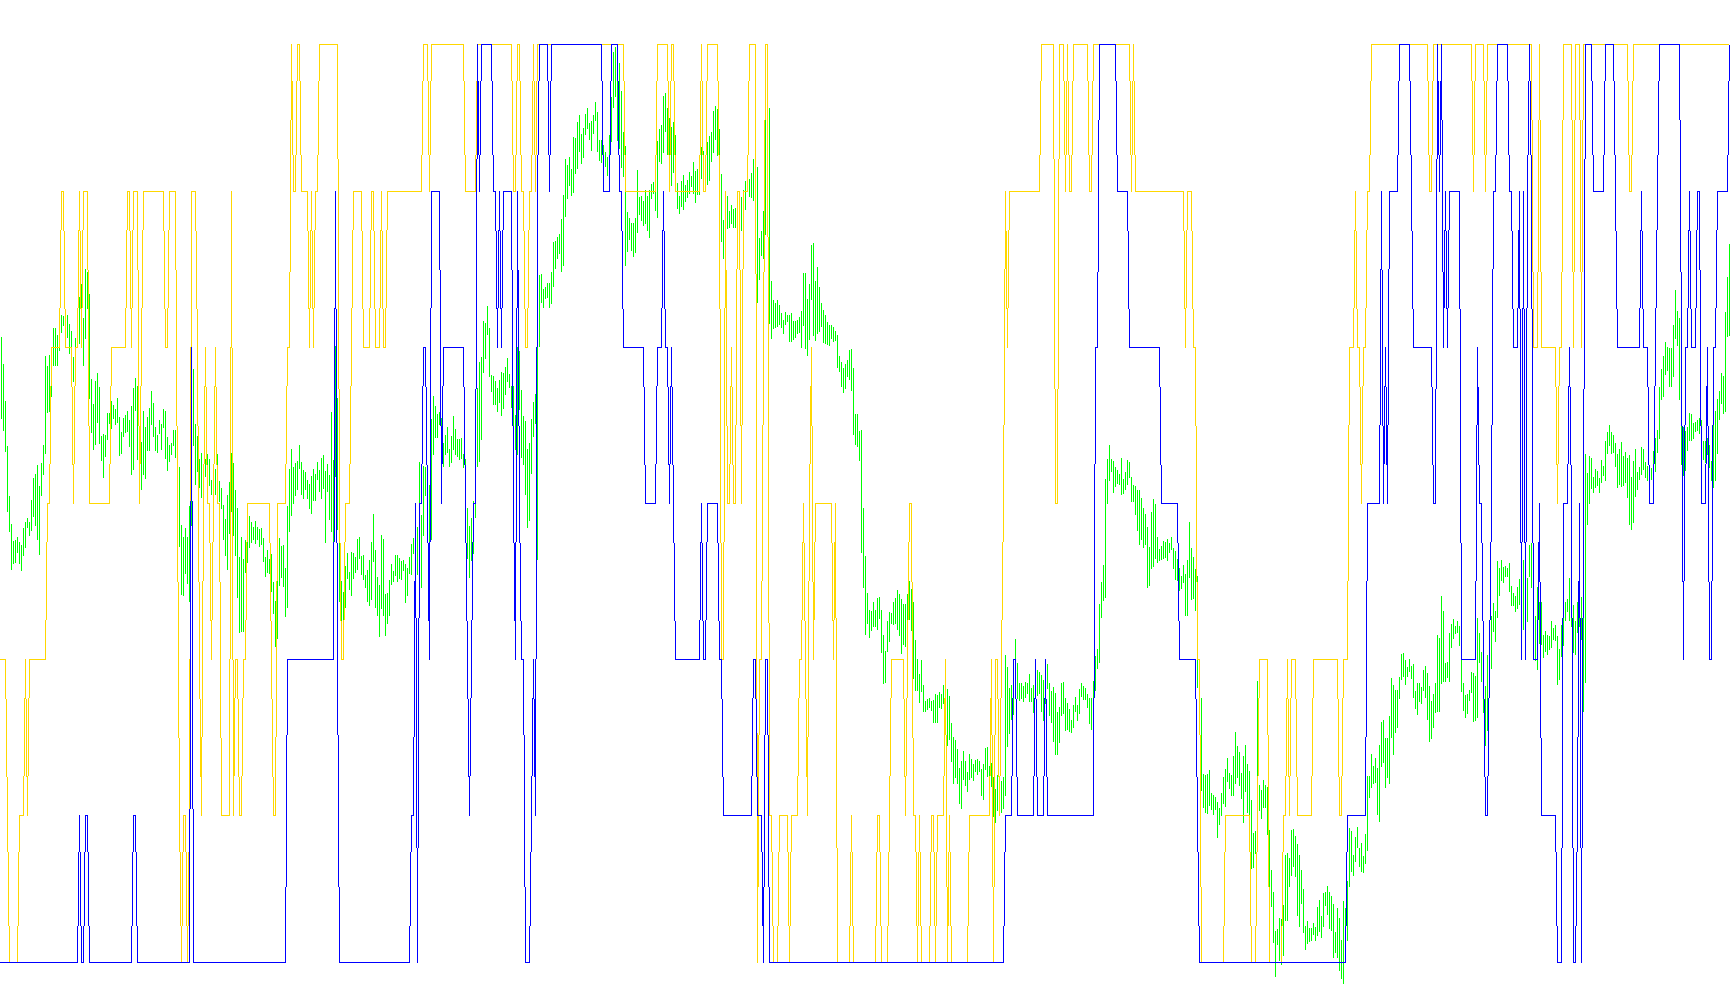
The Ind-Widners Oscillator is a custom technical analysis tool designed to provide traders with visual insights into market momentum and price extremes. Instead of simply tracking the direction of price, this script focuses on identifying significant historical "highs" and "lows" within specific rolling windows to calculate a percentage-based oscillator.
How the Logic Works
1. Identifying Price Extremes The core logic of the tool revolves around scanning a set period of historical data (the "Lookback Period"). During every calculation cycle, the script identifies the highest price point and the lowest price point reached within that specific window. By focusing on these extremes, the oscillator filters out minor market noise and highlights the boundaries of current price action.
2. Capturing Historical Trends The script doesn't just look at the most recent peak or trough; it maintains a memory of the six most significant extreme points. As new highs and lows are formed in the market, the oldest data points are cycled out, and the newest ones are recorded. This allows the tool to build a mathematical profile of where the price has been "pushing" against resistance and support over time.
3. The Oscillator Calculation Once these six historical extremes (for both highs and lows) are identified, the script performs a calculation based on the current closing price:
- It compares the current market price against these six recorded highs and lows.
- These values are then normalized into a percentage scale between 0 and 100.
- This creates two distinct lines: one representing the downward pressure (based on historical lows) and one representing upward pressure (based on historical highs).
4. Visual Feedback and Bounds The resulting data is plotted in a separate window below the main price chart. The oscillator values are designed to stay within a defined range. To ensure the lines remain visible and useful for analysis, the logic includes "buffers" that prevent the lines from hitting the absolute limits of 0 or 100, ensuring smooth transitions during volatile market movements.
Summary for Traders
Essentially, this tool acts as a momentum gauge. By comparing current prices to a rolling history of significant peaks and valleys, it helps traders visualize whether the market is currently trading at an extreme relative to its recent range, providing a clearer picture of potential overbought or oversold conditions.
//+------------------------------------------------------------------+
//|                                        Ind-Widners Oscilator.mq4 |
//|                    Copyright © 2004, http://www.expert-mt4.nm.ru |
//|                                      http://www.expert-mt4.nm.ru |
//+------------------------------------------------------------------+
#property copyright "Copyright © 2004, http://www.expert-mt4.nm.ru"
#property link      "http://www.expert-mt4.nm.ru"

#property indicator_separate_window
#property indicator_minimum 1
#property indicator_maximum 100
#property indicator_buffers 2
#property indicator_color1 Blue
#property indicator_color2 ForestGreen
#property indicator_width1 2

extern int nPeriod=9;
extern int Limit=350;
///---- int Widners Oscilator
int cnt,nCurBar;
//---- buffers
double wso[];
double wro[];
//+------------------------------------------------------------------+
//| Custom indicator initialization function                         |
//+------------------------------------------------------------------+
int init()
  {
//---- indicators
   SetIndexStyle(0,DRAW_LINE);
   SetIndexBuffer(0,wso);
   SetIndexStyle(1,DRAW_LINE);
   SetIndexBuffer(1,wro);
//----
   return(0);
  }
//+------------------------------------------------------------------+
//| Custor indicator deinitialization function                       |
//+------------------------------------------------------------------+
int deinit()
  {
//---- TODO: add your code here

//----
   return(0);
  }
//+------------------------------------------------------------------+
//| Custom indicator iteration function                              |
//+------------------------------------------------------------------+
int start()
  {
//---- TODO: add your code here
   double r1,r2,r3,r4,r5,r6;
   double s1,s2,s3,s4,s5,s6;
//---- ????? ????????????? ? ?????????
if(Bars>Limit) Limit=Bars-nPeriod;
for(nCurBar=Limit; nCurBar>0; nCurBar--)
   {
   if(Low[nCurBar+(nPeriod-1)/2] == Low[Lowest(NULL,0,MODE_LOW,nPeriod,nCurBar)])
      {
      s6=s5; s5=s4; s4=s3; s3=s2; s2=s1; s1=Low[nCurBar+(nPeriod-1)/2];
      }
   if(High[nCurBar+(nPeriod-1)/2] == High[Highest(NULL,0,MODE_HIGH,nPeriod,nCurBar)])
      {
      r6=r5; r5=r4; r4=r3; r3=r2; r2=r1; r1=High[nCurBar+(nPeriod-1)/2];
      }
//----
   wso[nCurBar]=100*(1-(MathFloor(s1/Close[nCurBar])+
               MathFloor(s2/Close[nCurBar])+
               MathFloor(s3/Close[nCurBar])+
               MathFloor(s4/Close[nCurBar])+
               MathFloor(s5/Close[nCurBar])+
               MathFloor(s6/Close[nCurBar]))/6);
	if(wso[nCurBar]==0) wso[nCurBar]=wso[nCurBar]+1;
	if(wso[nCurBar]==100) wso[nCurBar]=wso[nCurBar]-1;

   wro[nCurBar]=100*(1-(MathFloor(r1/Close[nCurBar])+
               MathFloor(r2/Close[nCurBar])+
               MathFloor(r3/Close[nCurBar])+
               MathFloor(r4/Close[nCurBar])+
               MathFloor(r5/Close[nCurBar])+
               MathFloor(r6/Close[nCurBar]))/6);
	if(wro[nCurBar]==0) wro[nCurBar]=wro[nCurBar]+1;
	if(wro[nCurBar]==100) wro[nCurBar]=wro[nCurBar]-1;
   }
//----
   return(0);
  }
Comments