Ind-GG01-101
Download script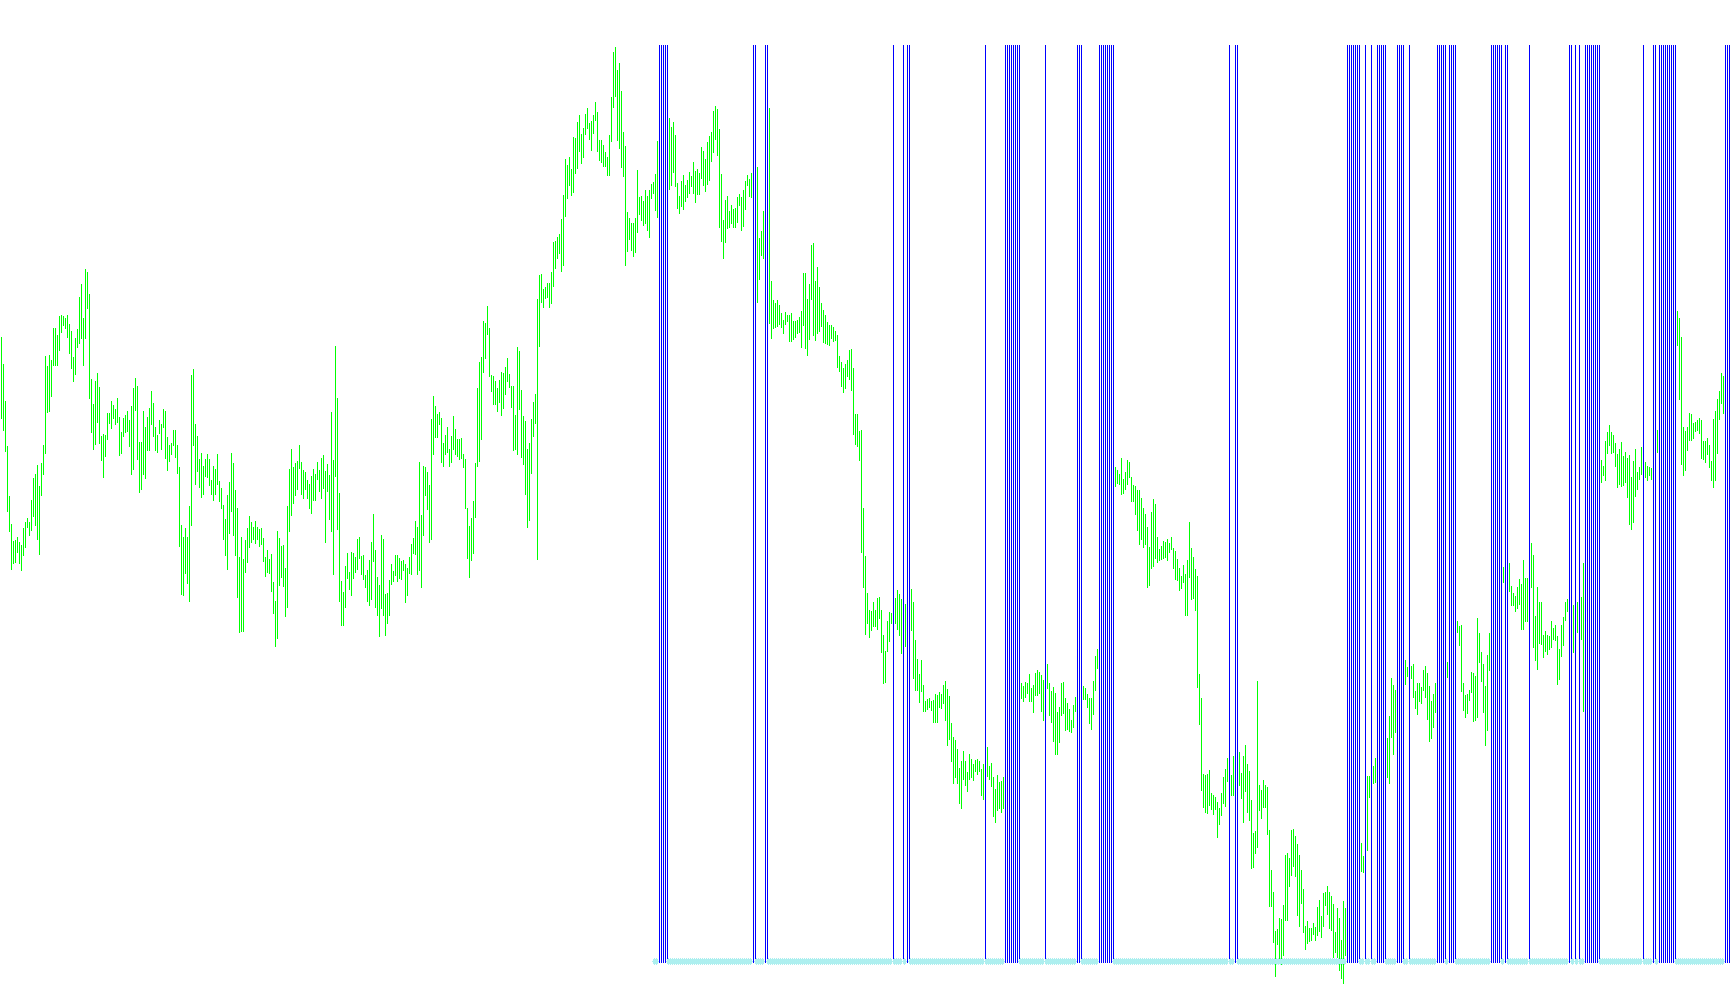
The Ind-GG01-101 is a technical analysis tool designed to identify specific trading opportunities by filtering market noise through multiple mathematical layers. Instead of relying on a single price movement, this script looks for a "confluence" of conditions—meaning it only triggers a signal when several different types of technical indicators agree with one another simultaneously.
Here is a breakdown of the logic used to determine market signals:
Core Components
The tool monitors five distinct market variables to make its decisions:
- Moving Averages: It tracks the general trend and momentum using smoothed averages.
- Custom Trend Analysis (i-CAi): It utilizes a secondary custom calculation to compare against the primary moving average.
- Parabolic SAR: This is used to identify potential reversal points in the price trend.
- Bollinger Bands: The script measures the "volatility" or the distance between the upper and lower boundaries of the market price.
How Signals Are Generated
The script looks for specific "sweet spots" where momentum, volatility, and trend direction align.
Buy Signals (Green)
For a Buy signal to appear, the tool requires four conditions to be met at once:
- Trend Alignment: The primary moving average must be above the custom trend line and trending upwards (or staying steady).
- Price Positioning: The current price must be positioned above the Parabolic SAR indicator.
- Volatility Expansion: The market must show a significant amount of "stretch" or movement (the width of the Bollinger Bands must exceed a specific threshold).
- Increasing Momentum: The volatility must be actively expanding compared to the previous candle, suggesting a breakout is occurring.
Sell Signals (Red)
For a Sell signal to appear, the requirements are mirrored:
- Trend Alignment: The primary moving average must fall below the custom trend line and be trending downwards.
- Price Positioning: The current price must be positioned below the Parabolic SAR indicator.
- Volatility Expansion: Similar to the buy signal, the market must show a significant amount of "stretch" or movement.
- Increasing Momentum: The volatility must be actively expanding compared to the previous candle, suggesting a downward break.
Visual Output
The tool provides a clean visual interface in a separate window:
- Histograms: These appear as bars that highlight the strength of the Buy (Lime) and Sell (Red) conditions.
- Neutrality Marker: If neither a Buy nor a Sell condition is met, the script remains neutral, ensuring that you are only notified when the specific criteria for an entry have been satisfied.
In essence, this indicator acts as a "gatekeeper." It ignores minor price fluctuations and only highlights instances where the trend, the volatility, and the price action all point in the same direction at the same time.
//+------------------------------------------------------------------+
//|                                                 Ind-GG01-101.mq4 |
//|                                                           GGekko |
//|                                                                  |
//+------------------------------------------------------------------+
#property copyright "GGekko"
#property link      ""

#property indicator_separate_window
#property indicator_buffers 3
#property indicator_color1 Red
#property indicator_color2 Lime
#property indicator_color3 Gold
#property indicator_width1 2
#property indicator_width2 2
#property indicator_width3 1
#property indicator_minimum -2
#property indicator_maximum 2
//---- buffers
double ExtMapBuffer1[];
double ExtMapBuffer2[];
double ExtMapBuffer3[];

double ma0,ma1;
double ca;
double psar;
double boll_upper0,boll_upper1;
double boll_lower0,boll_lower1;
double bollingerdiff0,bollingerdiff1;
int barsToProcess=500;

extern int period_ma=5;
extern int period_ca=5;
extern int method_=MODE_SMMA;
extern int price_=PRICE_CLOSE;
extern double step_psar=0.01;
extern double max_psar=0.3;
extern int period_boll=14;
extern int dev_boll=2;
extern int bolldiff=15;
/*
PRICE_CLOSE	0	Close price.
PRICE_OPEN	1	Open price.
PRICE_HIGH	2	High price.
PRICE_LOW	3	Low price.
PRICE_MEDIAN	4	Median price, (high+low)/2.
PRICE_TYPICAL	5	Typical price, (high+low+close)/3.
PRICE_WEIGHTED	6	Weighted close price, (high+low+close+close)/4.

MODE_SMA	0	Simple moving average,
MODE_EMA	1	Exponential moving average,
MODE_SMMA	2	Smoothed moving average,
MODE_LWMA	3	Linear weighted moving average.
*/

//+------------------------------------------------------------------+
//| Custom indicator initialization function                         |
//+------------------------------------------------------------------+
int init()
  {
//---- indicators
   SetIndexStyle(0,DRAW_HISTOGRAM);
   SetIndexBuffer(0,ExtMapBuffer1);
   SetIndexEmptyValue(0,EMPTY_VALUE);
   SetIndexStyle(1,DRAW_HISTOGRAM);
   SetIndexBuffer(1,ExtMapBuffer2);
   SetIndexEmptyValue(1,EMPTY_VALUE);
   SetIndexStyle(2,DRAW_ARROW);
   SetIndexArrow(2,115);
   SetIndexBuffer(2,ExtMapBuffer3);
   SetIndexEmptyValue(2,EMPTY_VALUE);

   IndicatorShortName("GG01-101 ("+period_ma+","+period_ca+","+bolldiff+")");
//----
   return(0);
  }
//+------------------------------------------------------------------+
//| Custom indicator deinitialization function                       |
//+------------------------------------------------------------------+
int deinit()
  {
//----

//----
   return(0);
  }
//+------------------------------------------------------------------+
//| Custom indicator iteration function                              |
//+------------------------------------------------------------------+
int start()
  {
   int    counted_bars=IndicatorCounted(), limit;
   int i=0;
   if(counted_bars>0)
      counted_bars--;

   limit=Bars-counted_bars;

   if(limit>barsToProcess)
      limit=barsToProcess;

   while (i<limit)
   {

   ma0=iMA(NULL,0,period_ma,0,method_,price_,i);
   ma1=iMA(NULL,0,period_ma,0,method_,price_,i+1);
   ca=iCustom(NULL,0,"i-CAi",period_ca,method_,price_,0,i);
   psar=iSAR(NULL,0,step_psar,max_psar,i);
   boll_lower0=iBands(NULL,0,period_boll,dev_boll,0,PRICE_CLOSE,MODE_LOWER,i);
   boll_upper0=iBands(NULL,0,period_boll,dev_boll,0,PRICE_CLOSE,MODE_UPPER,i);
   bollingerdiff0=(boll_upper0-boll_lower0)/Point;
   boll_lower1=iBands(NULL,0,period_boll,dev_boll,0,PRICE_CLOSE,MODE_LOWER,i+1);
   boll_upper1=iBands(NULL,0,period_boll,dev_boll,0,PRICE_CLOSE,MODE_UPPER,i+1);
   bollingerdiff1=(boll_upper1-boll_lower1)/Point;


   //SELL SIGNAL
   if(ma0<ca && ma0<=ma1 && psar>Close[i] && bollingerdiff0>bolldiff && bollingerdiff0>bollingerdiff1)
      ExtMapBuffer1[i]=-1;
   else ExtMapBuffer1[i]=EMPTY_VALUE;


   //BUY SIGNAL
   if(ma0>ca && ma0>=ma1 && psar<Close[i] && bollingerdiff0>bolldiff && bollingerdiff0>bollingerdiff1)
      ExtMapBuffer2[i]=1;
   else ExtMapBuffer2[i]=EMPTY_VALUE;


   if(ExtMapBuffer1[i]==EMPTY_VALUE && ExtMapBuffer2[i]==EMPTY_VALUE)
      ExtMapBuffer3[i]=0;
   else ExtMapBuffer3[i]=EMPTY_VALUE;


   i++;
   }


//----
   return(0);
  }
//+------------------------------------------------------------------+
Comments