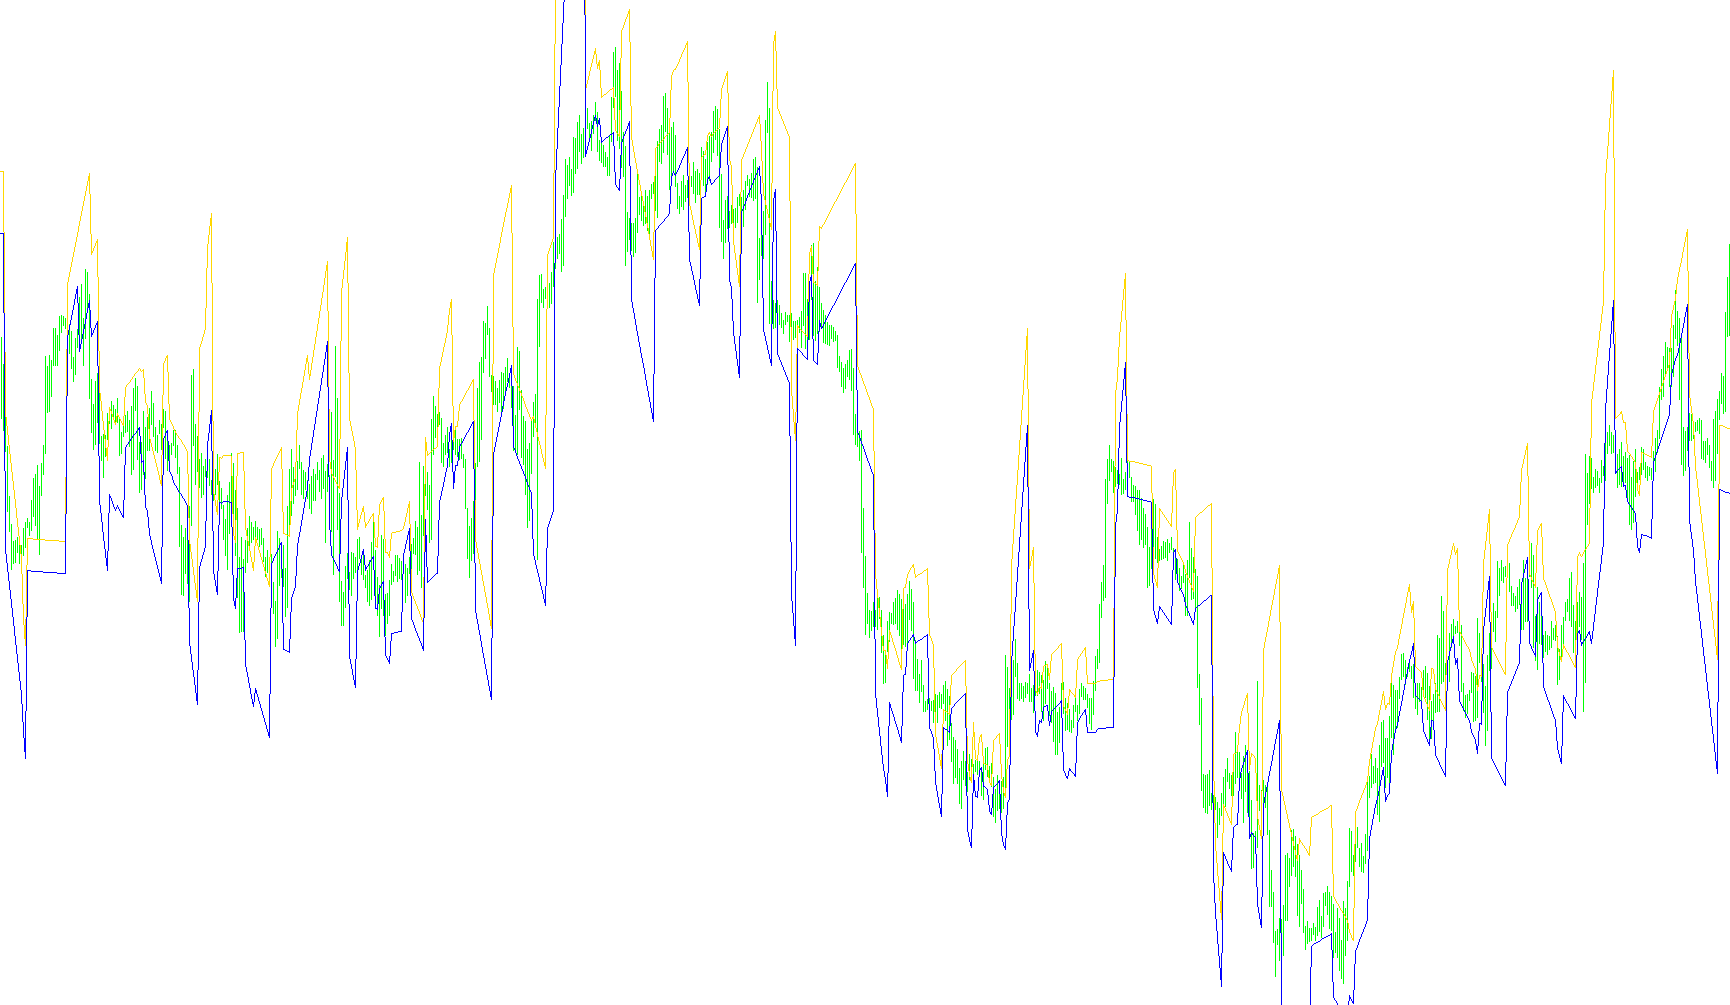
This indicator is designed to assist traders in identifying and visualizing structural price movements by analyzing "Fractals"—specific peaks and valleys in market history. Instead of simply highlighting these points, the script performs a geometric analysis to project potential trend lines based on how these highs and lows relate to one another over time.
Core Operational Logic
1. Identification of Key Market Points The script scans historical price data to locate Upper Fractals (local peaks) and Lower Fractals (local valleys). It focuses specifically on these significant turning points, as they represent areas where the market sentiment shifted from bullish to bearish or vice versa.
2. Dynamic Relationship Mapping Once a new peak or valley is identified, the logic does not treat it in isolation. It searches backward through recent history to find preceding and succeeding fractals. By doing this, the script establishes a relationship between different structural points. It looks for:
- Consecutive highs to determine the trajectory of an upward move.
- Consecutive lows to determine the trajectory of a downward move.
3. Trend Line Calculation After identifying these relevant points, the script calculates the mathematical slope between them. It uses linear interpolation to project trend lines onto your chart. Rather than just drawing a static line between two fixed dots, the logic calculates the "path" the price is taking. This helps in visualizing:
- Support and Resistance levels.
- The angle of momentum.
- Potential "breakout" zones where price might deviate from established patterns.
4. Visual Representation The script outputs several distinct visual elements to the chart:
- Trend Lines: These provide a continuous visual guide of the market's structural flow, helping traders see the "skeleton" of the price movement.
- Signal Arrows: The logic includes specific triggers that appear as arrows on the chart. These act as visual cues, highlighting specific moments where the fractal analysis identifies a significant shift in trend or a completed structural cycle.
Summary for the Trader
Essentially, this tool automates the tedious process of manually connecting highs and lows. It looks at the "history" of the current price movement to determine the underlying structure of the market, drawing lines that represent the prevailing trend and providing arrow signals to help pinpoint where those trends might be forming or completing.
/*-----------------------------+
|			       |
| Shared by www.Aptrafx.com    |
|			       |
+------------------------------*/

//+------------------------------------------------------------------+
//|                                                    Ind-SKB-1.mq4 |
//|                            Copyright © 2005, Kara Software Corp. |
//|                                                                  |
//+------------------------------------------------------------------+
#property copyright "Copyright © 2005, Kara Software Corp."
#property link      ""

#property indicator_chart_window
#property indicator_buffers 6
#property indicator_color1 Red
#property indicator_color2 Green
#property indicator_color3 Blue
#property indicator_color4 Blue
#property indicator_color5 FireBrick
#property indicator_color6 FireBrick
//---- buffers
double ExtMapBuffer1[];
double ExtMapBuffer2[];
double ExtMapBuffer3[];
double ExtMapBuffer4[];
double ExtMapBuffer5[];
double ExtMapBuffer6[];
//+------------------------------------------------------------------+
//| Custom indicator initialization function                         |
//+------------------------------------------------------------------+
int init()
  {
//---- indicators
   SetIndexStyle(0,DRAW_LINE);
   SetIndexBuffer(0,ExtMapBuffer1);
   SetIndexStyle(1,DRAW_LINE);
   SetIndexBuffer(1,ExtMapBuffer2);
   SetIndexStyle(2,DRAW_LINE);
   SetIndexBuffer(2,ExtMapBuffer3);
   SetIndexStyle(3,DRAW_LINE);
   SetIndexBuffer(3,ExtMapBuffer4);
   SetIndexStyle(4,DRAW_ARROW);
   SetIndexArrow(4,217);
   SetIndexBuffer(4,ExtMapBuffer5);
   SetIndexEmptyValue(4,0.0);
   SetIndexStyle(5,DRAW_ARROW);
   SetIndexArrow(5,218);
   SetIndexBuffer(5,ExtMapBuffer6);
   SetIndexEmptyValue(5,0.0);
//----
   return(0);
  }
//+------------------------------------------------------------------+
//| Custor indicator deinitialization function                       |
//+------------------------------------------------------------------+
int deinit()
  {
//----

//----
   return(0);
  }
//+------------------------------------------------------------------+
//| Custom indicator iteration function                              |
//+------------------------------------------------------------------+
int start()
  {
   double FU,FL;
   int CCU1,CCU2,CCL1,CCL2,shift,i,j;

   CCU1=0;CCU2=0;CCL1=0;CCL2=0;
   for(shift=Bars-100;shift>=0;shift--)
     {
      FU=0;FL=0;
      FU=iFractals(NULL,0,MODE_UPPER,shift+3);
      FL=iFractals(NULL,0,MODE_LOWER,shift+3);
      if(FU>0)
        {
         i=shift+3+1;
         while(iFractals(NULL,0,MODE_UPPER,i)==0)i++;
         for(j=shift+3;j<=i;j++)
           {
            if(iFractals(NULL,0,MODE_LOWER,j)>0)
              {
               CCU1=shift+3;
               CCU2=i;
               if(CCL1==0)CCL1=j;
               else
                 if(Low[j]<Low[CCL1])CCL1=j;
               CCL2=0;
              }
           }
         if(j==i && High[i]>High[shift+3])FU=0;
        }
      if(FL>0)
        {
         i=shift+3+1;
         while(iFractals(NULL,0,MODE_LOWER,i)==0)i++;
         for(j=shift+3;j<=i;j++)
           {
            if(iFractals(NULL,0,MODE_UPPER,j)>0)
              {
               if(CCU1==0)CCU1=j;
               else
                 if(High[j]>High[CCU1])CCU1=j;
               CCU2=0;
               CCL1=shift+3;
               CCL2=i;
              }
           }
        }


      if(CCU1>0 && CCU2>0)
        {
         if(High[CCU1]>High[CCU2])
           {
            ExtMapBuffer1[shift]=High[CCU1]+(High[CCU1]-High[CCU2])/(CCU2-CCU1)*(CCU1-shift);
            ExtMapBuffer2[shift]=Low[CCL1]+(High[CCU1]-High[CCU2])/(CCU2-CCU1)*(CCL1-shift);
           }
         if(High[CCU1]<High[CCU2])
           {
            ExtMapBuffer1[shift]=High[CCU1]-(High[CCU2]-High[CCU1])/(CCU2-CCU1)*(CCU1-shift);
            ExtMapBuffer2[shift]=Low[CCL1]-(High[CCU2]-High[CCU1])/(CCU2-CCU1)*(CCL1-shift);
           }
        }
      if(CCL1>0 && CCL2>0)
        {
         if(Low[CCL1]<Low[CCL2])
           {
            ExtMapBuffer1[shift]=High[CCU1]-(Low[CCL2]-Low[CCL1])/(CCL2-CCL1)*(CCU1-shift);
            ExtMapBuffer2[shift]=Low[CCL1]-(Low[CCL2]-Low[CCL1])/(CCL2-CCL1)*(CCL1-shift);
           }
         if(Low[CCL1]>Low[CCL2])
           {
            ExtMapBuffer1[shift]=High[CCU1]+(Low[CCL1]-Low[CCL2])/(CCL2-CCL1)*(CCU1-shift);
            ExtMapBuffer2[shift]=Low[CCL1]+(Low[CCL1]-Low[CCL2])/(CCL2-CCL1)*(CCL1-shift);
           }
        }
     }
   return(0);
  }
//+------------------------------------------------------------------+
Comments