pipvaluecalculatorv1_02
Indicator

pipvaluecalculatorv1_02

This tool dynamically computes the monetary worth of individual pips and points relative to the account base currency based on current market tick values and lot sizes.

PivotCustom_4TimeFramesmonthlyweekly
Indicator

PivotCustom_4TimeFramesmonthlyweekly

This indicator dynamically renders comprehensive Fibonacci-style pivot levels, including support and resistance boundaries, across 4-hour, daily, weekly, and monthly timeframes simultaneously.

pivotpoints
Indicator

pivotpoints

This indicator computes high-precision daily, weekly, and monthly pivot levels using a customizable UTC closing time anchor to identify key structural support and resistance zones.

pivotpoint_mtf_2_2_fix_1
Indicator

pivotpoint_mtf_2_2_fix_1

This indicator dynamically calculates and visualizes comprehensive pivot levels, including standard R/S supports and intermediate midpoints, across 4-hour, daily, weekly, and monthly intervals simultaneously.

PivotsMultiTimes
Indicator

PivotsMultiTimes

This indicator calculates and projects dynamic floor and ceiling price levels by synthesizing high/low/close data from specific historical timeframes.

Pivots_Weekly_SR_AIMEfx
Indicator

Pivots_Weekly_SR_AIMEfx

This indicator calculates and plots weekly pivot points, support levels, and resistance zones based on the high, low, and close prices of the preceding week to identify structural turning points.

pivot_only
Indicator

pivot_only

This indicator visualizes the arithmetic mean of high, low, open, and close prices across hourly, 4-hour, daily, weekly, and monthly intervals to identify key structural balance points.

Pivot_Star
Indicator

Pivot_Star

This indicator projects dynamic support and resistance levels by calculating various pivot methodologies including Fibonacci, Camarilla, Woodie, and DeMark based on user-defined historical periods.

Post-zigzag
Indicator

Post-zigzag

This indicator identifies significant market structural pivots by dynamically filtering price extrema based on depth, deviation, and backstep parameters to delineate swing points.

precision_trend_2
Indicator

precision_trend_2

This indicator determines market direction by comparing price action against a dynamically adjusted volatility band derived from historical range averages and sensitivity coefficients.

precision_trend_histo_2
Indicator

precision_trend_histo_2

This indicator identifies directional shifts by monitoring price breaches of an adaptive volatility-adjusted range derived from historical high-low spread averages.

Indicator

PriceAction AHA 0_2

priceaction
Indicator

priceaction

This indicator dynamically identifies and categorizes bullish and bearish Pin Bar, Inside Bar, and Engulfing candle patterns based on geometric relative proportions and multi-bar historical context.

PriceAlert_Ver_1-2
Indicator

PriceAlert_Ver_1-2

This tool monitors real-time mid-price breaches of user-defined geometric trendlines or horizontal boundaries to trigger multi-channel notifications.

PriceChange
Indicator

PriceChange

This indicator calculates the absolute price difference between the opening and closing values of each bar, scaled by a specific decimal factor to quantify price movement intensity.

pricedegrees
Indicator

pricedegrees

This indicator quantifies price movement into a 360-degree angular coordinate system relative to daily volatility, triggering real-time alerts on structural trend reversals and momentum shifts.

pricehistgram_onclick
Indicator

pricehistgram_onclick

This indicator visualizes historical price distribution across multiple timeframes using an interactive click event to generate a volumetric histogram based on localized price bins.

pricehistogram_channel
Indicator

pricehistogram_channel

This indicator constructs a volume-weighted price density profile over a specific multi-day period to identify key support, resistance, and peak zones.

PriceLines
Indicator

PriceLines

This script automatically generates and visualizes equidistant horizontal price lines across a calculated volatility range to assist in identifying structural currency fluctuations.

pricepercentrange
Indicator

pricepercentrange

iMAiMAOnArray

This indicator quantifies price relative position within a 100-bar volatility window and identifies structural trend shifts by synthesizing Fibonacci retracement levels with nested moving average dynamics.

PricePosition
Indicator

PricePosition

iMA

This indicator identifies dynamic price pivot points by calculating the intersection of smoothed moving averages to determine bullish or bearish structural transitions.

price_channel_central
Indicator

price_channel_central

This indicator identifies the rolling high, low, and median price points over a specified period to generate real-time bullish and bearish crossover signals.

Price_DJIA_NK_NQ_Time_v2
Indicator

Price_DJIA_NK_NQ_Time_v2

This indicator overlays real-time price feeds for major indices (DJIA, NK, NQ) and Forex pairs (USDJPY, EURJPY, GBPJPY) alongside a live candle countdown timer on the chart.

Price_Quote
Indicator

Price_Quote

Displays real-time price fluctuations, high/low boundaries, and percentage deviations relative to specific timeframe pivots.

primelevelsblack
Indicator

primelevelsblack

This indicator identifies and renders horizontal support/resistance zones by calculating price points based on the modulo of the current bid relative to user-defined integer digit suffixes.

profit
Indicator

profit

This indicator parses historical trade data to generate a structured on-screen panel that categorizes monthly profits, losses, and total volume for a specified fiscal year.

ProfitInfo
Indicator

ProfitInfo

A real-time on-screen display that aggregates and categorizes floating profit, swap costs, and commission totals across specific trading symbols or magic numbers.

profitline
Indicator

profitline

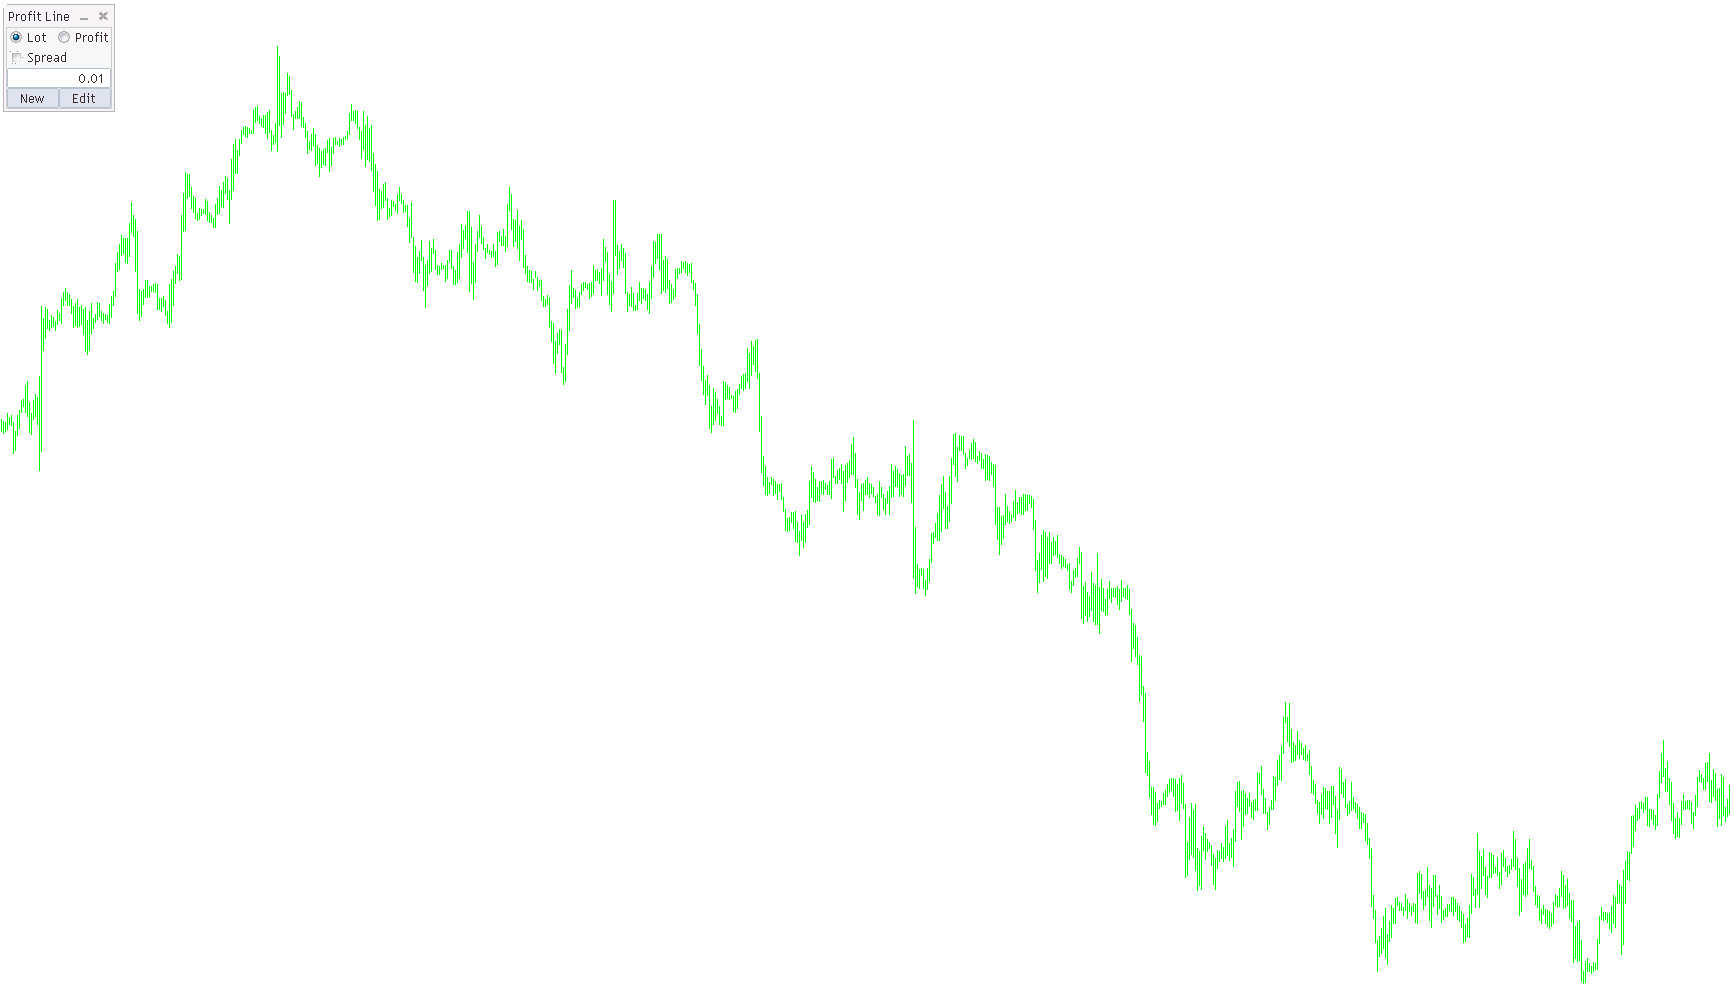
An interactive on-chart utility that allows traders to visualize real-time monetary profit or required lot sizes by dragging trendlines across price points.

ProfitOnDrop
Indicator

ProfitOnDrop

This indicator calculates and visualizes the real-time projected profit or loss of current open positions at a specific user-defined price point on the chart.

Profitstat
Indicator

Profitstat

This indicator parses historical trade data to aggregate and display real-time profit totals and closing volumes for the current and previous calendar days directly on the chart.

prsi_pcci
Indicator

prsi_pcci

iCCIiRSI

This indicator synchronizes primary and signal variations of RSI and CCI across different timeframes to visualize price momentum dynamics and trend shifts via histogram overlays.

PSAR_2B_Line
Indicator

PSAR_2B_Line

iSAR

This indicator identifies potential reversal zones by correlating Parabolic Stop and Reverse levels across current and higher timeframes to filter price action noise.

pwo_svs
Indicator

pwo_svs

iMA

This indicator synthesizes multiple moving average variances and differential offsets into a four-layered histogram to visualize complex price momentum shifts.

PZ_DeleteAllPendingOrders
Indicator

PZ_DeleteAllPendingOrders

Automatically purges all active buy/sell stop and limit orders from the current instrument to clear the order book.

p_FanSimple8_for_me
Indicator

p_FanSimple8_for_me

iMA

This indicator synchronizes price action and moving average sequences across multiple concurrent timeframes to visualize trend confluence and directional bias.

q-Spread
Indicator

q-Spread

This indicator calculates and renders the real-time pip difference between Ask and Bid prices directly onto the chart overlay.

QEMA
Indicator

QEMA

iMAiMAOnArray

This indicator calculates a specialized smoothing curve by applying a quintuple recursive exponential moving average sequence and synthesizing them through a weighted polynomial coefficients formula.

qema_percent_app_pr
Indicator

qema_percent_app_pr

This indicator calculates a complex smoothing value by applying a weighted linear combination of five nested exponential moving averages.

qShowTrades
Indicator

qShowTrades

This indicator parses historical order data to render visual trendline markers on the chart, color-coding entries and exits based on realized profit or loss.

qsiLagrange
Indicator

qsiLagrange

The indicator identifies local extrema to construct a Lagrange interpolating polynomial, mapping historical price curves and projecting potential future trajectories based on mathematical regression.

Quantile_bands_1.3
Indicator

Quantile_bands_1.3

This indicator calculates dynamic volatility boundaries by sorting historical price instances into statistical quantiles to visualize trend momentum and mean reversion zones.

QuickFib
Indicator

QuickFib

This indicator automatically maps Fibonacci retracement levels and trend contour lines based on the price extremes of the currently visible chart area.

Rads HAS Ext
Indicator

Rads HAS Ext

iMA

This indicator identifies momentum shifts by visualizing the intersection of four distinct Exponential Moving Averages calculated from Close, Open, and Median price points across varied timeframes.

Raghee Vague
Indicator

Raghee Vague

iMA

This indicator identifies trend momentum and volatility by plotting EMA-based price boundaries and detecting specific crossovers between the closing price and 34-period high/low smoothing lines.

Raghee5minutes
Indicator

Raghee5minutes

iMA

This indicator calculates exponential moving averages while dynamically switching between high and low price sources based on the trigonometric angle of a 60-minute trend slope.

RagheeCandleVagueBars
Indicator

RagheeCandleVagueBars

iMA

This indicator identifies directional bias by calculating the arctangent of Exponential Moving Average slopes and filtering them against predefined angular thresholds to highlight significant trend momentum.

RangeBoundMA
Indicator

RangeBoundMA

iMA

This indicator calculates the absolute maximum price differential between three distinct Simple Moving Averages to identify and visualize market consolidation zones.

range_predictor
Indicator

range_predictor

This indicator dynamically identifies price action structures by analyzing statistical frequency of high-low ranges and open-close steps to project expected boundary levels on Range, Renko, and Mean Renko charts.

RDI_ForexForecast
Indicator

RDI_ForexForecast

This indicator identifies historical price structural echoes through weighted correlation coefficients to project potential future price trajectories based on multi-sample geometric similarity.

realvalue
Indicator

realvalue

This indicator calculates a dynamic price trajectory by balancing current mid-point shifts against an average of historical range variances to filter out erratic price noise.