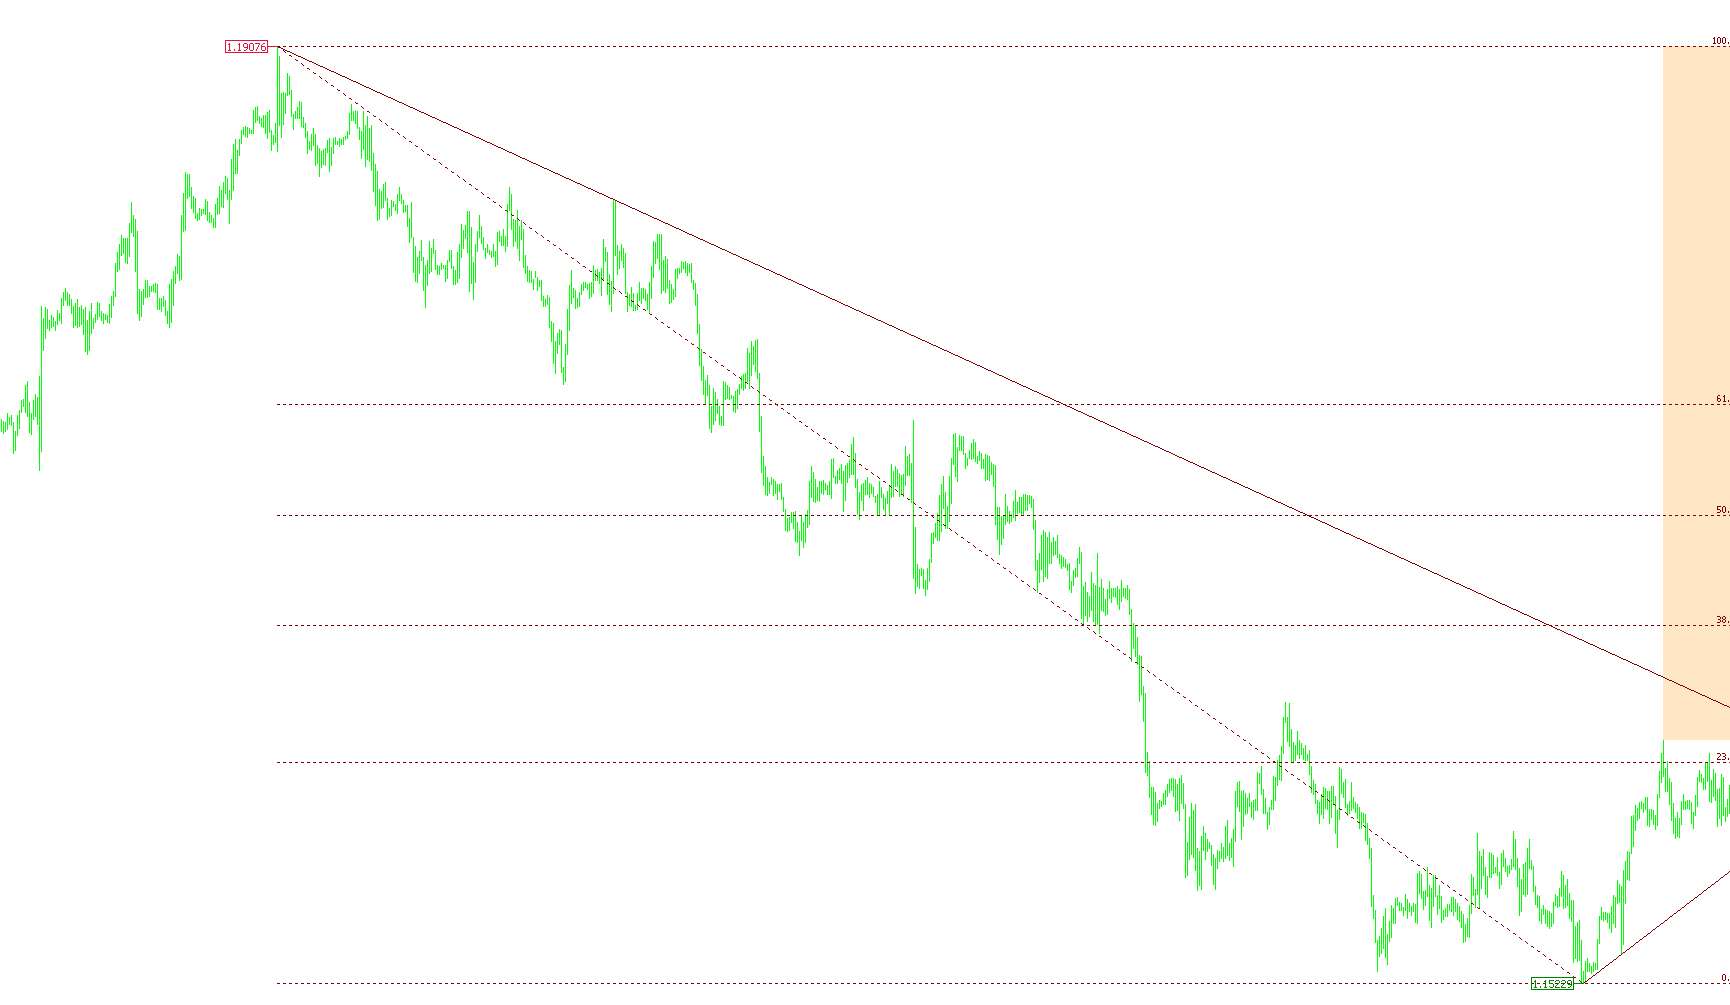
The QuickFib script is designed to provide traders with an automated, visual summary of the current price action by dynamically identifying key market boundaries. Rather than requiring manual placement of technical indicators, this tool automatically scans the visible area of your trading chart to calculate and display essential structural data.
Core Functionality
The primary purpose of this script is to identify the "high water mark" and the "low water mark" within your current view. Based on these two points, it performs the following actions:
- Dynamic Fibonacci Projection: The tool automatically draws a Fibonacci retracement level between the highest high and the lowest low found in your visible window. It intelligently detects the direction of the trend—distinguishing between an uptrend and a downtrend—and adjusts the orientation of the Fibonacci levels accordingly to reflect the current market flow.
- Trend Visualization: To help with immediate visual identification, the script uses distinct color coding for different market states. For example, it applies specific colors to represent uptrends versus downtrends, ensuring that the primary direction of price movement is clear at a glance.
Key Visual Features
To provide a deeper context beyond simple lines, the script includes several advanced visual elements:
- Contour Lines: The tool calculates the "slope" of the price movement. It identifies the most aggressive trajectory from both the highest and lowest points to create "contour lines." These lines help traders visualize the momentum and the path the market is taking as it moves away from its peaks or troughs.
- Retracement Blocks: When enabled, the script draws a shaded rectangle to highlight the "remaining" portion of a retracement. This allows traders to see how much of a price pullback has already occurred versus how much room remains in the current corrective move.
- Price Flags: The tool places clear markers (flags) at the exact coordinates of the highest high and lowest low. These serve as anchors, making it easy to identify the extreme boundaries of the current trading range.
User Experience
The script is designed to be "set and forget." Every time the chart updates or the user scrolls through different timeframes, the tool automatically cleans up old drawings and recalculates the data based on what is currently on your screen. This ensures that your technical analysis is always synchronized with the specific price action you are focusing on at any given moment.
//+------------------------------------------------------------------+
//|                                                     QuickFib.mq4 |
//|                                                                  |
//| Draw the fib from the highest high in the currently visibly bars |
//| to the lowest low, and a couple "contour lines" to show the      |
//| basic range that the pair is trading in.                         |
//|                                                                  |
//|                                   Copyright © 2010, Jason Hooper |
//|                                         http://www.chartbin.net/ |
//+------------------------------------------------------------------+
#property indicator_chart_window
#property indicator_buffers         0

extern color ColorUptrend = DarkSlateGray;
extern color ColorDowntrend = Maroon;
extern color ColorRetracementRemaining = Bisque;
extern color ColorHighPrice = Crimson;
extern color ColorLowPrice = Green;
extern bool DrawRetracementBlocks = true;

string indId = "QuickFib_";

//+------------------------------------------------------------------+
//| Custom indicator initialization function                         |
//+------------------------------------------------------------------+
int init()
{
   IndicatorBuffers(0);

   return(0);
}

int deinit()
{
   DeleteAllObjects();

   return(0);
}

int start()
{
   // Lazy, could be improved to redraw only what needs to be redrawn
   DeleteAllObjects();
   PlotObjects();

   return(0);
}


void DeleteAllObjects()
{
   // Delete all objects created by the indicator
   for (int i = ObjectsTotal() - 1;  i >= 0;  i--)
   {
      string name = ObjectName(i);

      if (StringSubstr(name, 0, StringLen(indId)) == indId)
         ObjectDelete(name);
   }
}

void PlotObjects()
{
   int bar = WindowFirstVisibleBar();

   // If price breaking out to new highs or lows, don't redraw the fib until the next bar
   // That's what the -1 and 1 are for.
   int shiftLowest = iLowest(NULL, 0, MODE_LOW, bar - 1, 1);
   int shiftHighest = iHighest(NULL, 0, MODE_HIGH, bar - 1, 1);

   bool isSwingDown = shiftHighest > shiftLowest;
   string objOuterId = indId + "outer";
   string objInnerId = indId + "inner";
   string objTopPrice = indId + "topPrice";
   string objBottomPrice = indId + "bottomPrice";
   string objRetRect = indId + "retracementRectangle";
   double retracementExtent;
   int shiftMostRetraced;

   if (isSwingDown == true)
   {
      ObjectCreate(objOuterId, OBJ_FIBO, 0, Time[shiftHighest], High[shiftHighest], Time[shiftLowest], Low[shiftLowest]);
      ObjectSet(objOuterId, OBJPROP_COLOR, ColorDowntrend);
      ObjectSet(objOuterId, OBJPROP_LEVELCOLOR, ColorDowntrend);
      ObjectSet(objOuterId, OBJPROP_LEVELSTYLE, STYLE_DOT);

      if (DrawRetracementBlocks)
      {
         if (shiftLowest > 0)
         {
            // Draw a rectangle showing the part of the fib retracement that has not occurred
            shiftMostRetraced = iHighest(NULL, 0, MODE_HIGH, shiftLowest - 1, 0);

            ObjectCreate(objRetRect, OBJ_RECTANGLE, 0, Time[shiftMostRetraced], High[shiftHighest], Time[0], High[shiftMostRetraced]);
            ObjectSet(objRetRect, OBJPROP_COLOR, ColorRetracementRemaining);
         }
      }

      DrawContourLines(shiftHighest, shiftLowest, ColorDowntrend);
   }
   else
   {
      ObjectCreate(objOuterId, OBJ_FIBO, 0, Time[shiftLowest], Low[shiftLowest], Time[shiftHighest], High[shiftHighest]);

      ObjectSet(objOuterId, OBJPROP_COLOR, ColorUptrend);
      ObjectSet(objOuterId, OBJPROP_LEVELCOLOR, ColorUptrend);
      ObjectSet(objOuterId, OBJPROP_LEVELSTYLE, STYLE_DOT);

      if (DrawRetracementBlocks)
      {
         if (shiftHighest > 0)
         {
            // Draw a rectangle showing the part of the fib retracement that has not occurred
            shiftMostRetraced = iLowest(NULL, 0, MODE_LOW, shiftHighest - 1, 0);

            ObjectCreate(objRetRect, OBJ_RECTANGLE, 0, Time[shiftMostRetraced], Low[shiftLowest], Time[0], Low[shiftMostRetraced]);
            ObjectSet(objRetRect, OBJPROP_COLOR, ColorRetracementRemaining);
         }
      }

      DrawContourLines(shiftHighest, shiftLowest, ColorUptrend);
   }

   // Draw price flags
   ObjectCreate(objTopPrice, OBJ_ARROW, 0, Time[shiftHighest], High[shiftHighest]);
   ObjectCreate(objBottomPrice, OBJ_ARROW, 0, Time[shiftLowest], Low[shiftLowest]);

   ObjectSet(objTopPrice, OBJPROP_ARROWCODE, SYMBOL_LEFTPRICE);
   ObjectSet(objBottomPrice, OBJPROP_ARROWCODE, SYMBOL_LEFTPRICE);
   ObjectSet(objTopPrice, OBJPROP_COLOR, ColorHighPrice);
   ObjectSet(objBottomPrice, OBJPROP_COLOR, ColorLowPrice);

}

void DrawContourLines(int shiftHighest, int shiftLowest, color clr)
{
   int shiftContourDown = shiftHighest;
   double highestSlope = 0;
   string objId_ContourDown = indId + "ContourDown";
   string objId_ContourUp = indId + "ContourUp";

   for (int i = shiftHighest - 10;  i > 1;  i--)
   {
      double thisSlope = (High[i] - High[shiftHighest]) / (shiftHighest - i);

      if (thisSlope >= highestSlope || highestSlope == 0)
      {
         shiftContourDown = i;
         highestSlope = thisSlope;
      }
   }

   ObjectCreate(objId_ContourDown, OBJ_TREND, 0, Time[shiftHighest], High[shiftHighest], Time[shiftContourDown], High[shiftContourDown]);
   ObjectSet(objId_ContourDown, OBJPROP_RAY, true);
   ObjectSet(objId_ContourDown, OBJPROP_WIDTH, 1);
   ObjectSet(objId_ContourDown, OBJPROP_STYLE, STYLE_SOLID);
   ObjectSet(objId_ContourDown, OBJPROP_COLOR, clr);

   double lowestSlope = 0;
   int shiftContourUp = 0;

   for (i = shiftLowest - 10;  i > 1;  i--)
   {
      thisSlope = (Low[i] - Low[shiftLowest]) / (shiftLowest - i);

      if (thisSlope <= lowestSlope || lowestSlope == 0)
      {
         shiftContourUp = i;
         lowestSlope = thisSlope;
      }
   }

   ObjectCreate(objId_ContourUp, OBJ_TREND, 0, Time[shiftLowest], Low[shiftLowest], Time[shiftContourUp], Low[shiftContourUp]);
   ObjectSet(objId_ContourUp, OBJPROP_RAY, true);
   ObjectSet(objId_ContourUp, OBJPROP_WIDTH, 1);
   ObjectSet(objId_ContourUp, OBJPROP_STYLE, STYLE_SOLID);
   ObjectSet(objId_ContourUp, OBJPROP_COLOR, clr);
}
Comments