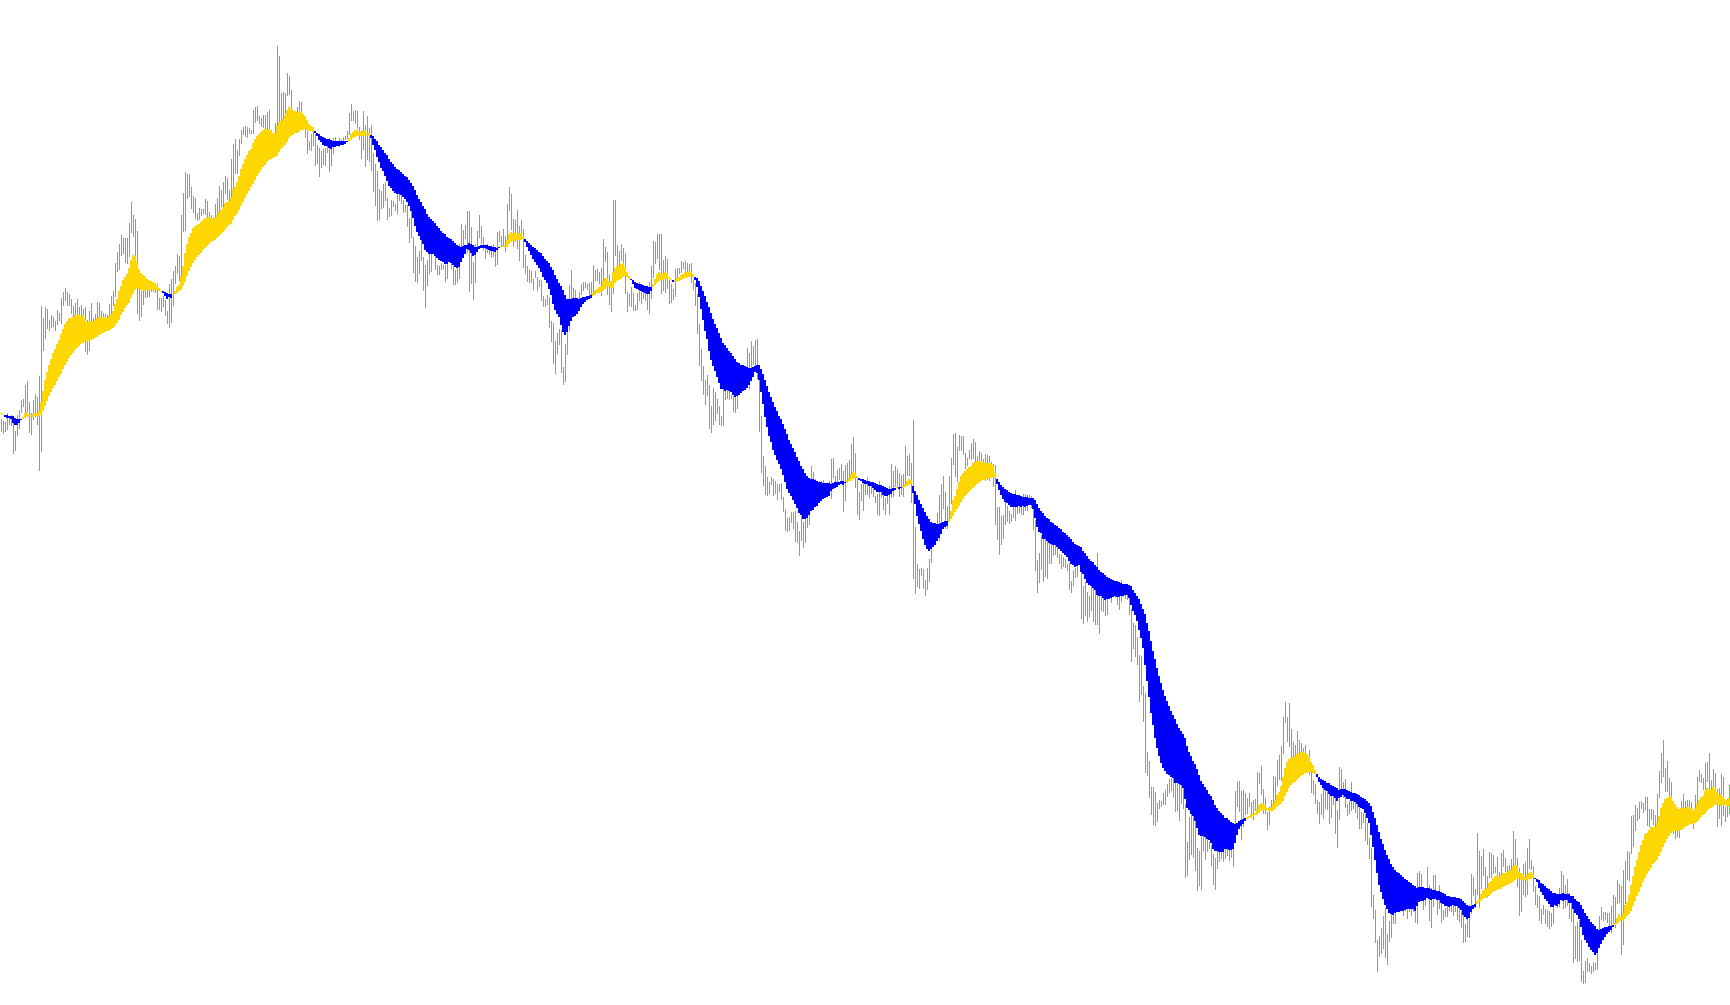
The 9Squared Trader is a visual trading tool designed to help market analysts identify trends and price momentum by smoothing out market "noise." Rather than looking at the erratic price movements of individual candles, this script calculates four distinct moving averages that track different aspects of price behavior simultaneously.
How It Works
The logic of the tool relies on analyzing four specific data points across two different speed scales: Fast and Slow.
- The Fast Components: These are designed to react quickly to recent market activity. They track the "Close" price (where the market ended) and the "Open" price (where the market started) over a shorter timeframe. This gives you an immediate sense of the current momentum.
- The Slow Components: These look at a much larger picture, tracking data over a longer period. By smoothing out the price movements over a wider horizon, these indicators help identify the broader trend and provide a "baseline" to see if the current fast movements are significant or just temporary fluctuations.
Visual Representation
The script translates these mathematical calculations into visual elements on your chart:
- Histograms: The tool uses two visible histograms (colored in Forest Green and Red). These represent the relationship between the Fast Close and Fast Open prices. Because they appear as bars, they allow you to see the "strength" of the current price movement more clearly than a simple line would.
- Smoothing & Shifts: The script is programmed to "shift" these values slightly so that they don't clutter the immediate price candles, ensuring the chart remains readable while still providing accurate data points for your analysis.
Summary for the Trader
In essence, the 9Squared Trader provides a multi-layered view of the market. By comparing the fast-reacting histograms against the broader, slower trends, it allows you to distinguish between short-term price "pulses" and long-term structural moves. It is built to provide a clearer perspective on whether the market's current direction has enough momentum to sustain itself or if it is simply deviating from the larger trend.
//+------------------------------------------------------------------+
//|                                              9Squared Trader.mq4 |
//|                                    Copyright © 2007 Steve Bowley |
//|                                        http://www.9squaredfx.com |
//+------------------------------------------------------------------+
#property copyright "Copyright © 2007 Steve Bowley"
#property link      "http://www.9squaredfx.com"

#property indicator_chart_window
#property indicator_buffers 4
#property indicator_color1 ForestGreen
#property indicator_color2 Red
#property indicator_color3 Black
#property indicator_color4 Black
//---- input parameters
extern int FastClosePeriod=13;
extern int FastCloseShift=0;
extern int FastOpenPeriod=34;
extern int FastOpenShift=0;
extern int SlowClosePeriod=34;
extern int SlowCloseShift=0;
extern int SlowOpenPeriod=62;
extern int SlowOpenShift=0;
//---- indicator buffers
double ExtBlueBuffer[];
double ExtRedBuffer[];
double ExtDarkVioletBuffer[];
double ExtBlackBuffer[];

//+------------------------------------------------------------------+
//| Custom indicator initialization function                         |
//+------------------------------------------------------------------+
int init()
  {
//---- line shifts when drawing
   SetIndexShift(0,FastCloseShift);
   SetIndexShift(1,FastOpenShift);
   SetIndexShift(2,SlowCloseShift);
   SetIndexShift(3,SlowOpenShift);
//---- first positions skipped when drawing
   SetIndexDrawBegin(0,FastCloseShift+FastClosePeriod);
   SetIndexDrawBegin(1,FastOpenShift+FastOpenPeriod);
   SetIndexDrawBegin(2,SlowCloseShift+SlowClosePeriod);
   SetIndexDrawBegin(3,SlowOpenShift+SlowOpenPeriod);
//---- 3 indicator buffers mapping
   SetIndexBuffer(0,ExtBlueBuffer);
   SetIndexBuffer(1,ExtRedBuffer);
   SetIndexBuffer(2,ExtDarkVioletBuffer);
   SetIndexBuffer(3,ExtBlackBuffer);
//---- drawing settings
   SetIndexStyle(0,DRAW_HISTOGRAM,0,2);
   SetIndexStyle(1,DRAW_HISTOGRAM,0,2);
   SetIndexStyle(2,DRAW_NONE,0,2);
   SetIndexStyle(3,DRAW_NONE,0,2);
//---- index labels
   SetIndexLabel(0,"FastClose");
   SetIndexLabel(1,"FastOpen");
   SetIndexLabel(2,"SlowClose");
   SetIndexLabel(3,"SlowOpen");
//---- initialization done
   return(0);
  }
//+------------------------------------------------------------------+
//| 9Squared Trader                                             |
//+------------------------------------------------------------------+
int start()
  {
   int limit;
   int counted_bars=IndicatorCounted();
//---- check for possible errors
   if(counted_bars<0) return(-1);
//---- last counted bar will be recounted
   if(counted_bars>0) counted_bars--;
   limit=Bars-counted_bars;
//---- main loop
   for(int i=0; i<limit; i++)
     {
      //---- ma_shift set to 0 because SetIndexShift called abowe
      ExtBlueBuffer[i]=iMA(NULL,0,FastClosePeriod,0,MODE_EMA,PRICE_CLOSE,i);
      ExtRedBuffer[i]=iMA(NULL,0,FastOpenPeriod,0,MODE_EMA,PRICE_OPEN,i);
      ExtDarkVioletBuffer[i]=iMA(NULL,0,SlowClosePeriod,0,MODE_EMA,PRICE_OPEN,i);
      ExtBlackBuffer[i]=iMA(NULL,0,SlowOpenPeriod,0,MODE_EMA,PRICE_MEDIAN,i);
     }
//---- done
   return(0);
  }
//+------------------------------------------------------------------+
Comments