primelevelsblack
Download script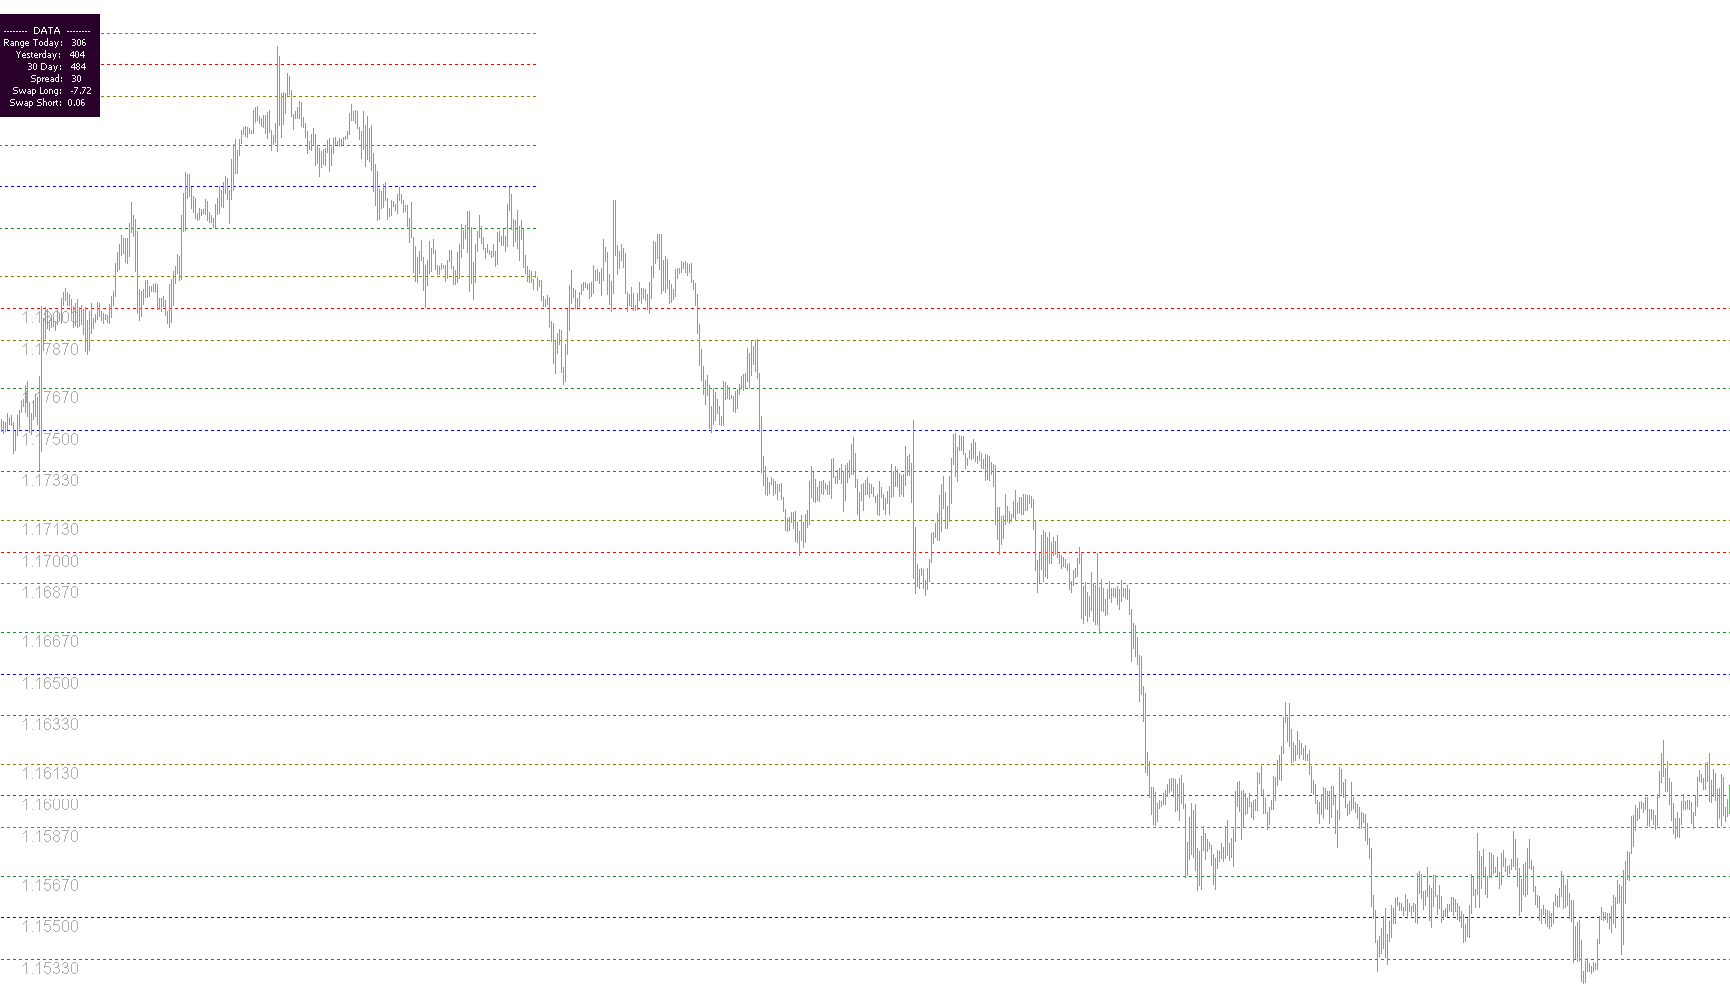
Overview of Prime Levels Logic
This script is designed to automatically identify and display specific price levels on a trading chart based on the current market price. Instead of relying on standard technical indicators, it uses a mathematical approach to project "Prime" horizontal lines at predetermined price increments relative to where the market is currently trading.
Core Functionality
1. Dynamic Price Level Calculation The script looks at the current "Bid" price (the price at which you can sell) and removes the decimal points to treat the price as a whole number. It then calculates a range of numbers above and below this base price.
Within this calculated range, the script identifies specific two-digit endings (which you can customize in the settings). For example, if you set a level to look for the ending "50," the script will scan the current price area and draw a line at the nearest price point that ends in those digits.
2. Visual Customization The logic allows for up to six unique lines to be displayed simultaneously. Each line can be independently toggled on or off, and each has its own unique properties:
- Color: Different colors for different levels (e.g., Red, Blue, Olive, Green).
- Style & Thickness: Options to change how bold or dashed the lines appear.
- Labels: The script can automatically place text labels next to each line, showing the exact price level and any custom text you wish to include.
3. Chart Management & Compatibility To ensure the chart remains clean and usable:
- Automatic Cleanup: The script includes a "self-cleaning" mechanism. When removed or deactivated, it automatically deletes all the lines and labels it created so they don't clutter your workspace.
- Timeframe Restrictions: To prevent visual clutter on very large charts, the script is designed to stop functioning if the user switches to a high timeframe (such as Daily or Weekly charts), ensuring the data remains relevant to shorter-term trading.
- Dynamic Positioning: Depending on your settings, lines can either stretch across the entire visible screen or be restricted to start only from the current candle moving backward.
Data Insights Box
In addition to drawing lines on the chart, the script calculates and displays a "Data Box" in the corner of your screen. This provides a snapshot of real-time market statistics:
- Range Tracking: It shows the price movement (High to Low) for today's session and yesterday's session.
- Averaging: It calculates the average daily range over a user-defined period (e.g., the last 30 days) to help traders understand normal volatility.
- Live Stats: It displays current market information, including the current Spread and the Swap rates for both Long and Short positions.
Summary for the Trader
Essentially, this tool serves as a visual map. It takes the current "messy" price of the market and overlays a structured grid of "Prime" levels. By seeing these lines, a trader can quickly identify key psychological price points where the market might react, while simultaneously keeping an eye on daily volatility and spread data in a dedicated information box.
//+----------------------------------------------------------------------------------+
//|                                                                                  |
//|                               Prime Levels.mq4                                   |
//|                                                                                  |
//+----------------------------------------------------------------------------------+
#property copyright "Doblece, Domas4 & Traderathome, Copyright @ 2009"
#property link      "email:  traderathome@msn.com"
/*------------------------------------------------------------------------------------
Suggested Settings:                   White Chart                Black Chart

Line1_Color                           Red                        Red
Line2_Color                           Blue                       Blue
Line3_Color                           Olive                      Olive
Line4_Color                           Olive                      Olive
Line5_Color                           LimeGreen                  ForestGreen
Line6_Color                           LimeGreen                  ForestGreen
--------------------------------------------------------------------------------------*/
#property indicator_chart_window
//---
extern bool   Indicator_On                    = true;
extern int    RangesAboveBelowBaseRange       = 2;
extern string Exit_Period_Choices             = "M1, M5, M15, M30, H1, H4, D1";
extern string Exit_If_Period_Greater_Than     = "H1";
//---
extern string _                               = "";
extern string Part_1                          = "Line Settings:";
extern bool   EndLines_At_Current_Candle      = true;
extern bool   FScrLines_With_Margin_Prices    = true;
extern bool   Subordinate_Lines               = true;
//---
extern string __                              = "";
extern string Part_2                          = "Label Settings:";
extern color  Color                           = DarkGray;
extern bool   ShowLabels                      = true;
extern string FontStyle                       = "Arial";
extern int    FontSize                        = 11;
extern bool   Line_Prices                     = true;
extern string Text_For_Label                  = "";
extern int    Shift_Labels_PerCent_Left       = 100;
extern bool   Subordinate_Labels              = true;
//---
extern string ___                             = "";
extern string Part_3                          = "Individual Line Configurations:";
extern color  Line1_Color                     = Red;
extern bool   Line1_On                        = true;
extern int    Line1_Last_Two_Digits           = 0;
extern int    Line1_Style_01234               = 2;
extern int    Line1_SolidThickness            = 1;
//---
extern color  Line2_Color=Blue;  //C'193,193,0';
extern bool   Line2_On                        = true;
extern int    Line2_Last_Two_Digits           = 50;
extern int    Line2_Style_01234               = 2;
extern int    Line2_SolidThickness            = 1;
//---
extern color  Line3_Color                     = Olive;
extern bool   Line3_On                        = true;
extern int    Line3_Last_Two_Digits           = 13;
extern int    Line3_Style_01234               = 2;
extern int    Line3_SolidThickness            = 1;
//---
extern color  Line4_Color                     = Olive;
extern bool   Line4_On                        = true;
extern int    Line4_Last_Two_Digits           = 87;
extern int    Line4_Style_01234               = 2;
extern int    Line4_SolidThickness            = 1;
//---
extern color  Line5_Color                     = ForestGreen;
extern bool   Line5_On                        = true;
extern int    Line5_Last_Two_Digits           = 67;
extern int    Line5_Style_01234               = 2;
extern int    Line5_SolidThickness            = 1;
//---
extern color  Line6_Color                     = ForestGreen;
extern bool   Line6_On                        = true;
extern int    Line6_Last_Two_Digits           = 33;
extern int    Line6_Style_01234               = 2;
extern int    Line6_SolidThickness            = 1;
//---
extern string ____                            = "";
extern string Part_4                          = "Data Box Settings:";
extern bool   Show_Data_Box                   = true;
extern color  Box_Background_Color=C'47,0,47';// C'60,0,60';//C'173,222,252';
extern int    Days_Used_For_Range_Data=30;
//---
double Poin;
//+-------------------------------------------------------------------------------------------+
//| Initialization                                                                            |
//+-------------------------------------------------------------------------------------------+
int init()
  {
//--- Checking for unconventional Point digits number
   if(Point==0.00001) Poin=0.0001; //5 digits
   else if(Point==0.001) Poin=0.01; //3 digits
   else Poin=Point; //Normal
   return(0);
  }
//+-------------------------------------------------------------------------------------------+
//| De-initialization                                                                         |
//+-------------------------------------------------------------------------------------------+
int deinit()
  {
   int obj_total=ObjectsTotal();
   for(int j=obj_total; j>=0; j--)
     {
      string name=ObjectName(j);
      if(StringSubstr(name,0,19)=="[Prime Time Levels]"){ObjectDelete(name);}
     }
//ObjectDelete("[Pivots History] Data Box");
   Comment("");
   return(0);
  }
//+-------------------------------------------------------------------------------------------+
//| Start                                                                                     |
//+-------------------------------------------------------------------------------------------+
int start()
  {
   if(Indicator_On==false) {return(0);}
//--- Exit if period is greater than
   int E;
   if(Exit_If_Period_Greater_Than== "M1") {E= 1;}
   if(Exit_If_Period_Greater_Than== "M5") {E= 5;}
   if(Exit_If_Period_Greater_Than== "M15") {E= 15;}
   if(Exit_If_Period_Greater_Than== "M30") {E= 30;}
   if(Exit_If_Period_Greater_Than== "H1") {E= 60;}
   if(Exit_If_Period_Greater_Than== "H4") {E= 240;}
   if(Exit_If_Period_Greater_Than== "D1") {E= 1440;}
   if(Period()>E) {deinit(); return(-1);}
//--- count the chars Objects, then for that count check and clear any entitled "[SweetSpot]"
   int obj_total=ObjectsTotal();
   for(int j=obj_total; j>=0; j--)
     {
      string name=ObjectName(j);
      if(StringSubstr(name,0,12)=="[SweetSpot] "){ObjectDelete(name);}
     }
//--- space out updates
//--- static datetime timelastupdate= 0; static datetime lasttimeframe= 0;
//if (CurTime()-timelastupdate < 5 && Period()==lasttimeframe) return (0);
//--- initialize needed variables
   int i,ssp,ssp1;  //choosing "int" instead of "double" drops decimal portion of value
   double linelevel,linestyle,linewidth; color linecolor;
   double d1=Bid;  //Comment(DoubleToStr(NormalizeDouble(d1,2),2));
   ssp1=Bid;  //bid w/o decimal, 117 instead of 117.66
   ssp1=Bid/Poin;  //Point restores bid integers w/o the decimal, 11766
   int u1=Line1_Last_Two_Digits; //initializing last two digits user entered
   int u2 = Line2_Last_Two_Digits;
   int u3 = Line3_Last_Two_Digits;
   int u4 = Line4_Last_Two_Digits;
   int u5 = Line5_Last_Two_Digits;
   int u6 = Line6_Last_Two_Digits;
   int c1=ssp1%100;
   double LA,LB,LN; LN=100-c1; LB=c1; LA=LN; //if (c1<50)LB=c1;LA=LN;//if (c1>+50)LB=c1;LA=LN;Comment(LB);
                                             //calculate line levels for user specified # of ranges
   ssp=ssp1; //start ssp at reference bid
   for(i=-((100*(RangesAboveBelowBaseRange))+LB); i<=((100*(RangesAboveBelowBaseRange))+LA); i++)
     {
      ssp=ssp1+i;  //Comment(i+"  "+ssp);
      c1=ssp%100;  //Comment(c1);
      if(c1==u1 && Line1_On==true)
        {
         linestyle = Line1_Style_01234;
         linecolor = Line1_Color;
         linewidth = Line1_SolidThickness;
         linelevel = ssp*Poin;
        }
      if(c1==u2 && Line2_On==true)
        {
         linestyle = Line2_Style_01234;
         linecolor = Line2_Color;
         linewidth = Line2_SolidThickness;
         linelevel = ssp*Poin;
        }
      if(c1==u3 && Line3_On==true)
        {
         linestyle = Line3_Style_01234;
         linecolor = Line3_Color;
         linewidth = Line3_SolidThickness;
         linelevel = ssp*Poin;
        }
      if(c1==u4 && Line4_On==true)
        {
         linestyle = Line4_Style_01234;
         linecolor = Line4_Color;
         linewidth = Line4_SolidThickness;
         linelevel = ssp*Poin;
        }
      if(c1==u5 && Line5_On==true)
        {
         linestyle = Line5_Style_01234;
         linecolor = Line5_Color;
         linewidth = Line5_SolidThickness;
         linelevel = ssp*Poin;
        }
      if(c1==u6 && Line6_On==true)
        {
         linestyle = Line6_Style_01234;
         linecolor = Line6_Color;
         linewidth = Line6_SolidThickness;
         linelevel = ssp*Poin;
        }
      //--- branch to subroutine to draw lines
      SetLevel(DoubleToStr(linelevel,Digits),linelevel,linecolor,linestyle,linewidth,Time[10]);
      //--- branch to subroutine to draw labels
      if(ShowLabels==true){SetLabel(DoubleToStr(linelevel,Digits),linelevel,Color);}
     }
//--- Code for TF Background colors, Day Candle and Data Box (items in-work)
   int digits=MarketInfo(Symbol(),MODE_DIGITS);
   double modifier=1; if(digits==3 || digits==5) modifier=10.0;
//--- Define today's bar and it's data
   int TodayBar=iBarShift(NULL,PERIOD_D1,Time[0]);
   double HiToday    = iHigh (NULL,PERIOD_D1,TodayBar);
   double LoToday    = iLow  (NULL,PERIOD_D1,TodayBar);
   double open       = iOpen( NULL,PERIOD_D1,TodayBar);
   double current    = iClose(NULL,PERIOD_D1,TodayBar);
   double change     = (current-iOpen(NULL,PERIOD_D1,TodayBar))/(Point*modifier);
   double startToday = iTime(NULL,PERIOD_D1,TodayBar);
   double endToday   = iTime(NULL,0,0);
//--- Define yesterday's bar and it's data
   int YesterdayBar=iBarShift(NULL,PERIOD_D1,Time[(23*60)/Period()]);
   double HiYesterday    = iHigh (NULL,PERIOD_D1,YesterdayBar);
   double LoYesterday    = iLow  (NULL,PERIOD_D1,YesterdayBar);
   double startYesterday = iTime(NULL,PERIOD_D1,YesterdayBar);
   double endYesterday   = iTime(NULL,PERIOD_D1,TodayBar);
//--- Data Box section
   if(Show_Data_Box)
     {
      string dComment="[Prime Time Levels] Data Box";
      ObjectCreate(dComment,OBJ_LABEL,0,0,0,0,0);
      ObjectSetText(dComment,"g",77,"Webdings");//82
      ObjectSet(dComment,OBJPROP_CORNER,0);
      ObjectSet(dComment,OBJPROP_XDISTANCE,0);
      ObjectSet(dComment,OBJPROP_YDISTANCE,15);  //13
      ObjectSet(dComment,OBJPROP_COLOR,Box_Background_Color);
      ObjectSet(dComment,OBJPROP_BACK,false);
      //--- Daily Average Range
      int Ra=0,RaP=Days_Used_For_Range_Data;
      for(i=0; i<RaP; i++) {Ra=Ra+((iHigh(NULL,PERIOD_D1,i)-iLow(NULL,PERIOD_D1,i))/Point);}
      Ra=((Ra/RaP)+1); //Add "1" to balance excessive rounding down
                       //Spread
      int spread=MarketInfo(Symbol(),MODE_SPREAD);
      //--- Set up Comment string
      string C="\n --------  DATA  --------\n";
      C=C + " Range Today:   "+DoubleToStr(MathRound((HiToday-LoToday)/Point),0)+ "\n";
      C=C + "     Yesterday:   "+DoubleToStr(MathRound((HiYesterday-LoYesterday)/Point),0) + "\n";
      C=C + "         "+Days_Used_For_Range_Data+" Day:   "+ Ra + "\n";
      C=C + "          Spread:   " + spread + "\n";
      C=C + "    Swap Long:   "+DoubleToStr(MarketInfo(Symbol(),MODE_SWAPLONG),2) + "\n";
      C=C + "   Swap Short:  "+DoubleToStr(MarketInfo(Symbol(),MODE_SWAPSHORT),2) + "\n";
      Comment(C);
     }
//---
   return(0);
  }
//+-------------------------------------------------------------------------------------------+
//| Sub-routine to name and draw lines                                                        |                                                                                  |
//+---------------------------------------------------------------------------------------- --+
void SetLevel(string text,double level,color linecolor,int linestyle,int linewidth,datetime startofday)
  {
   int digits=Digits;
   int startline=WindowFirstVisibleBar();
   int endline=Time[0];
   int G= false;
   int Z= OBJ_TREND;
   string linename="[Prime Time Levels] "+StringTrimLeft(text)+" Line";
//--- create or move the horizontal line
   if(FScrLines_With_Margin_Prices==true){Z=OBJ_HLINE;}
   if(EndLines_At_Current_Candle) {startline=Time[0]; endline=WindowFirstVisibleBar(); Z=OBJ_TREND;}
   if(Subordinate_Lines) {G=true;}
   if(ObjectFind(linename)!=0)
     {
      ObjectCreate(linename,Z,0,startline,level,endline,level);
      ObjectSet(linename,OBJPROP_STYLE,linestyle);
      ObjectSet(linename,OBJPROP_COLOR,linecolor);
      ObjectSet(linename,OBJPROP_WIDTH,linewidth);
      ObjectSet(linename,OBJPROP_BACK,G);
     }
   else
     {
      ObjectMove(linename,0,startline,level);
      ObjectMove(linename,1,endline,level);
     }
  }
//+-------------------------------------------------------------------------------------------+
//| Sub-routine to name and draw labels                                                       |                                                                                  |
//+---------------------------------------------------------------------------------------- --+
void SetLabel(string text,double linelevel,color Color_Labels)
  {
   int ml=((WindowFirstVisibleBar()-0) * Shift_Labels_PerCent_Left)/100;
   int G = false;
   string tab;
   string name = "[Prime Time Levels] " + StringTrimLeft(text) + " Label";
   string TEXT = Text_For_Label;
   if(Line_Prices == true){TEXT = TEXT + "   "+DoubleToStr(linelevel, Digits);}
   if(Subordinate_Labels) {G = true;}
//---
   for(int i=StringLen(TEXT)*2+2; i>=0; i--) tab=tab+" ";
//---
   if(ObjectFind(name)!=0)
     {
      ObjectCreate(name,OBJ_TEXT,0,Time[ml],linelevel);
      ObjectSet(name,OBJPROP_BACK,G);
      ObjectSetText(name,tab+TEXT,FontSize,FontStyle,Color_Labels);
     }
   else
     {
      ObjectMove(name,0,Time[ml],linelevel);
     }
  }
//+------------------------------------------------------------------+
Comments