Multi.Period.Stochastic
Indicator

Multi.Period.Stochastic

iMAOnArrayiStochastic

This indicator calculates a smoothed stochastic oscillator by fetching values from a higher timeframe and applying an additional moving average layer to filter noise.

Indicator

MultiInstrument

MultiInstrument4
Indicator

MultiInstrument4

iMA

This indicator normalizes and overlays price movements of four distinct financial instruments onto a single chart to visualize relative strength and aggregate momentum disparities.

Multipaires indicator_V2
Indicator

Multipaires indicator_V2

iBullsPoweriCCIiOBViRSI
MultiRSI
Indicator

MultiRSI

iRSI

This indicator aggregates and visualizes synchronized Relative Strength Index values across multiple concurrent timeframes to identify high-probability trend alignment.

multitimeframe
Indicator

multitimeframe

This indicator normalizes and overlays price action from three distinct timeframes onto a single visual scale, enabling concurrent analysis of multi-temporal trends without switching charts.

multitimeframemovingaverages
Indicator

multitimeframemovingaverages

iMA

This indicator projects synchronized moving averages from three distinct timeframes onto a single chart to visualize multi-layered trend confluence.

Murrey_Math_Line v2
Indicator

Murrey_Math_Line v2

This indicator identifies 13 dynamic price levels based on fractal octave analysis to pinpoint major structural pivots, premium zones, and reversal stalls.

mva
Indicator

mva

iMA

Identifies structural trend shifts by detecting when price momentum breaches both the 60 and 100 Exponential Moving Averages simultaneously.

my-envelope
Indicator

my-envelope

iMAiStdDev

This indicator projects upper and lower price boundaries by applying a multiplier to the standard deviation of a fast exponential moving average relative to a slower baseline.

Indicator

NetFlows

News_EA
Indicator

News_EA

This Expert Advisor fetches economic data via WebRequest to visualize high-impact global events as vertical lines and provide proactive alerts for currency volatility.

Nik_PSAR_2B
Indicator

Nik_PSAR_2B

iSAR

This indicator identifies high-probability trend reversals by synchronizing Parabolic SAR signals across multiple nested timeframes to ensure multi-layered momentum alignment.

Nik_PSAR_2B_Guillermo
Indicator

Nik_PSAR_2B_Guillermo

iSAR

This indicator synchronizes Parabolic SAR values across multiple nested timeframes to identify high-probability trend reversals and price crossovers.

ninetfmovement
Indicator

ninetfmovement

iWPRiMAOnArray

This indicator evaluates price action across nine concurrent timeframes to visualize high-low volatility ranges and detect synchronized bullish or bearish momentum shifts.

Non Repainting SuperTrend
Indicator

Non Repainting SuperTrend

iATR

This indicator identifies trend reversals by calculating a dynamic volatility boundary using Average True Range (ATR) and median price to generate non-repainting buy and sell signals.

NonLag_Inverse_fisher_transform_of_RSX
Indicator

NonLag_Inverse_fisher_transform_of_RSX

iMA

This indicator applies an inverse hyperbolic tangent transformation to a non-lagging smoothed RSI calculation to produce a bounded, trend-oriented oscillator that highlights momentum polarity.

Notarius
Indicator

Notarius

This indicator identifies trend reversals by calculating a running average of price centers and detecting specific threshold breaches in high-low volatility relative to the median price.

Notify
Indicator

Notify

A versatile notification utility that synchronizes terminal alerts, push messages, and logs while optionally constraining triggers to a single occurrence per price candle.

notonlyspread
Indicator

notonlyspread

This indicator tracks real-time volatility dynamics by calculating the exponential moving average, extreme boundaries, and per-minute tick frequency of the market spread.

notonlyspreadv1.01
Indicator

notonlyspreadv1.01

This indicator quantifies real-time liquidity dynamics by tracking volatility-induced spread fluctuations and calculating market velocity via tick frequency.

NT_Trigger_Lines_Big_Recoded
Indicator

NT_Trigger_Lines_Big_Recoded

iMAOnArray

This indicator identifies trend shifts by detecting crossovers between a linear regression line and its corresponding exponential moving average.

NT_Trigger_Lines_Small_Recoded
Indicator

NT_Trigger_Lines_Small_Recoded

iMAOnArray

This indicator identifies trend momentum by plotting a linear regression line and calculating its exponential moving average to detect signal crossovers.

Indicator

NUGROHO_V3

iMA
nyoron
Indicator

nyoron

A graphical utility that renders multi-line text descriptions and instructional labels directly onto the trading chart using dynamic object positioning.

OandaX_OrderBook_Chart
Indicator

OandaX_OrderBook_Chart

This indicator renders a real-time market depth histogram by parsing local Oanda price point data to visualize liquidity distribution, cumulative order volume, and long/short position imbalances.

OBTR
Indicator

OBTR

iATRiMAOnArray

This indicator calculates a cumulative true range value that adjusts dynamically based on price direction, applying dual moving averages to identify trend exhaustion and momentum shifts.

Octaves_v4
Indicator

Octaves_v4

This indicator dynamically projects a hierarchical grid of eight master keys and sub-lines based on the hourly open price to visualize structural harmonics.

ohlc_range
Indicator

ohlc_range

This indicator calculates and displays the absolute point distance between the previous candle's open/close prices and high/low extremes as real-time on-screen labels.

opamm
Indicator

opamm

This script automatically retrieves external CSV candle data via WebRequest based on a PAMM account ID, generates a corresponding .hst history file, and programmatically triggers the MetaTrader offline chart window.

Indicator

Open-Positions-Pips

Indicator

Open-Positions-Points

Open_Interest_IndicatorXR_online_beta_V3
Indicator

Open_Interest_IndicatorXR_online_beta_V3

An advanced charting tool that retrieves external CSV data via web requests to plot historical open interest levels and liquidity depth using dynamic rectangle overlays.

Open_Interest_IndicatorXR_online_beta_V3_eng
Indicator

Open_Interest_IndicatorXR_online_beta_V3_eng

This indicator retrieves external market depth data via web requests to map and render historical open interest levels as dynamic on-chart rectangles and text labels.

open_position_ma
Indicator

open_position_ma

iMA

This indicator evaluates bullish and bearish sentiment by comparing the current H1 price action against shifted fast and slow Simple Moving Averages across H1 and H4 timeframes.

OptionsLevel
Indicator

OptionsLevel

This indicator projects specific Call and Put strike price levels onto the chart by calculating price points based on user-defined premiums, volume, and open interest data.

OrderNotify
Indicator

OrderNotify

This Expert Advisor monitors real-time order fluctuations to dispatch automated email alerts containing comprehensive trade specifics and account snapshots whenever positions are opened or closed.

oscillatorsonchart
Indicator

oscillatorsonchart

iCCIiMAiRSI

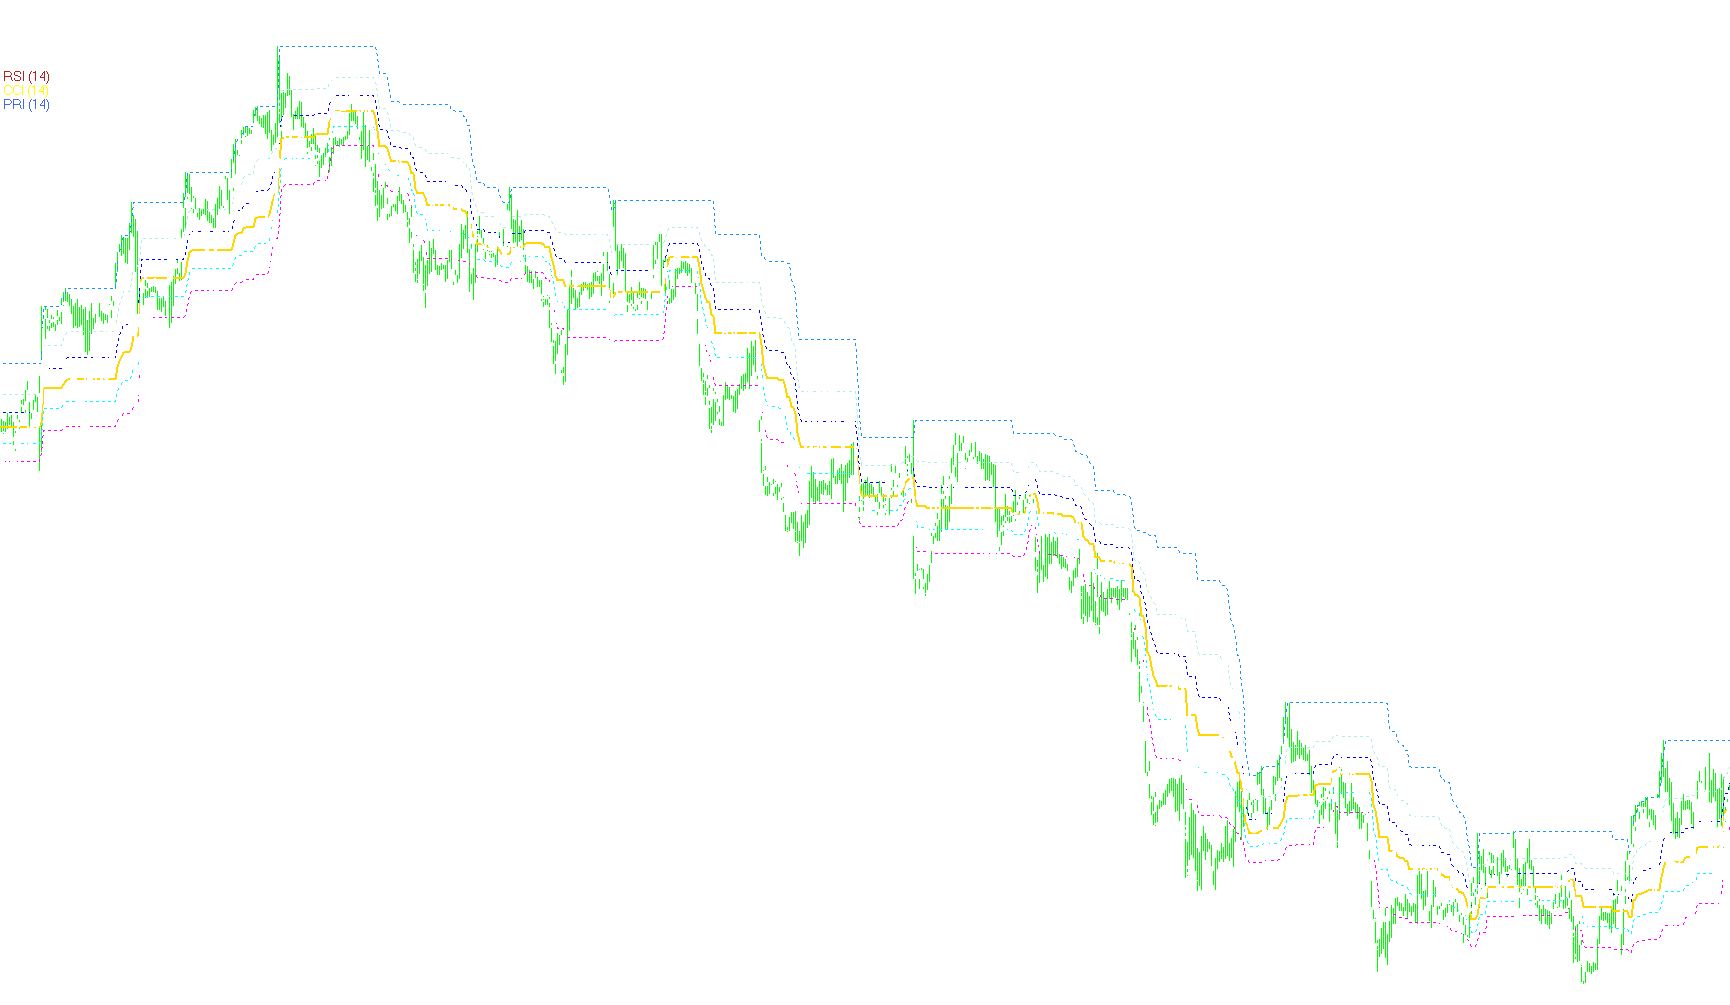
This indicator maps normalized RSI, CCI, and PRI values onto the price chart using dynamic median and range calculations to identify momentum breaches.

oscillator_of_indicator_and_ma
Indicator

oscillator_of_indicator_and_ma

iCCIiMACDiRVIiRSI

This tool synthesizes primary data from various technical oscillators—including MACD, RSI, CCI, RVI, and DeMarker—to calculate a unified momentum difference between the main indicator and its signal line.

Indicator

OverTrend-OSC

iCCI
Indicator

OverTrend

iCCI
Paires V_5
Indicator

Paires V_5

iBandsiMAiSAR

This indicator synchronizes Parabolic SAR, Bollinger Bands, and triple EMA smoothing with real-time price action visualization to identify trend momentum and volatility boundaries.

pairsindex
Indicator

pairsindex

iCCIiATRiMAiMAOnArray
Para_B
Indicator

Para_B

iSAR

This indicator projects simultaneous Parabolic SAR values across multiple timeframes onto a single M1 chart to identify overarching trend shifts and momentum confluence.

PA_adaptive_MACD
Indicator

PA_adaptive_MACD

iATR

This indicator calculates the difference between two Hilbert-transformed Exponential Moving Averages to identify momentum shifts, utilizing quantile and floating thresholds to signal trend reversals and pullbacks.

PEMA
Indicator

PEMA

iMAiMAOnArray

This indicator computes a high-order smoothed signal by applying recursive exponential moving averages and weighting them through a polynomial coefficient expansion.

pin
Indicator

pin

This indicator identifies potential trend reversals by detecting price candles that penetrate a specific percentage of their total range while maintaining proximity to daily high or low extremes.

pinbardetector
Indicator

pinbardetector

This indicator identifies specific price action formations by calculating the proportional spatial relationships, body positioning, and directional polarity between a primary 'nose' candle and its preceding 'eye' candle.

Indicator

PipeClientExample

pipstriker-com
Indicator

pipstriker-com

This indicator identifies geometric price corridors by calculating linear regression slopes between multi-timeframe historical extremes to visualize momentum trends.