price_channel_central
Download script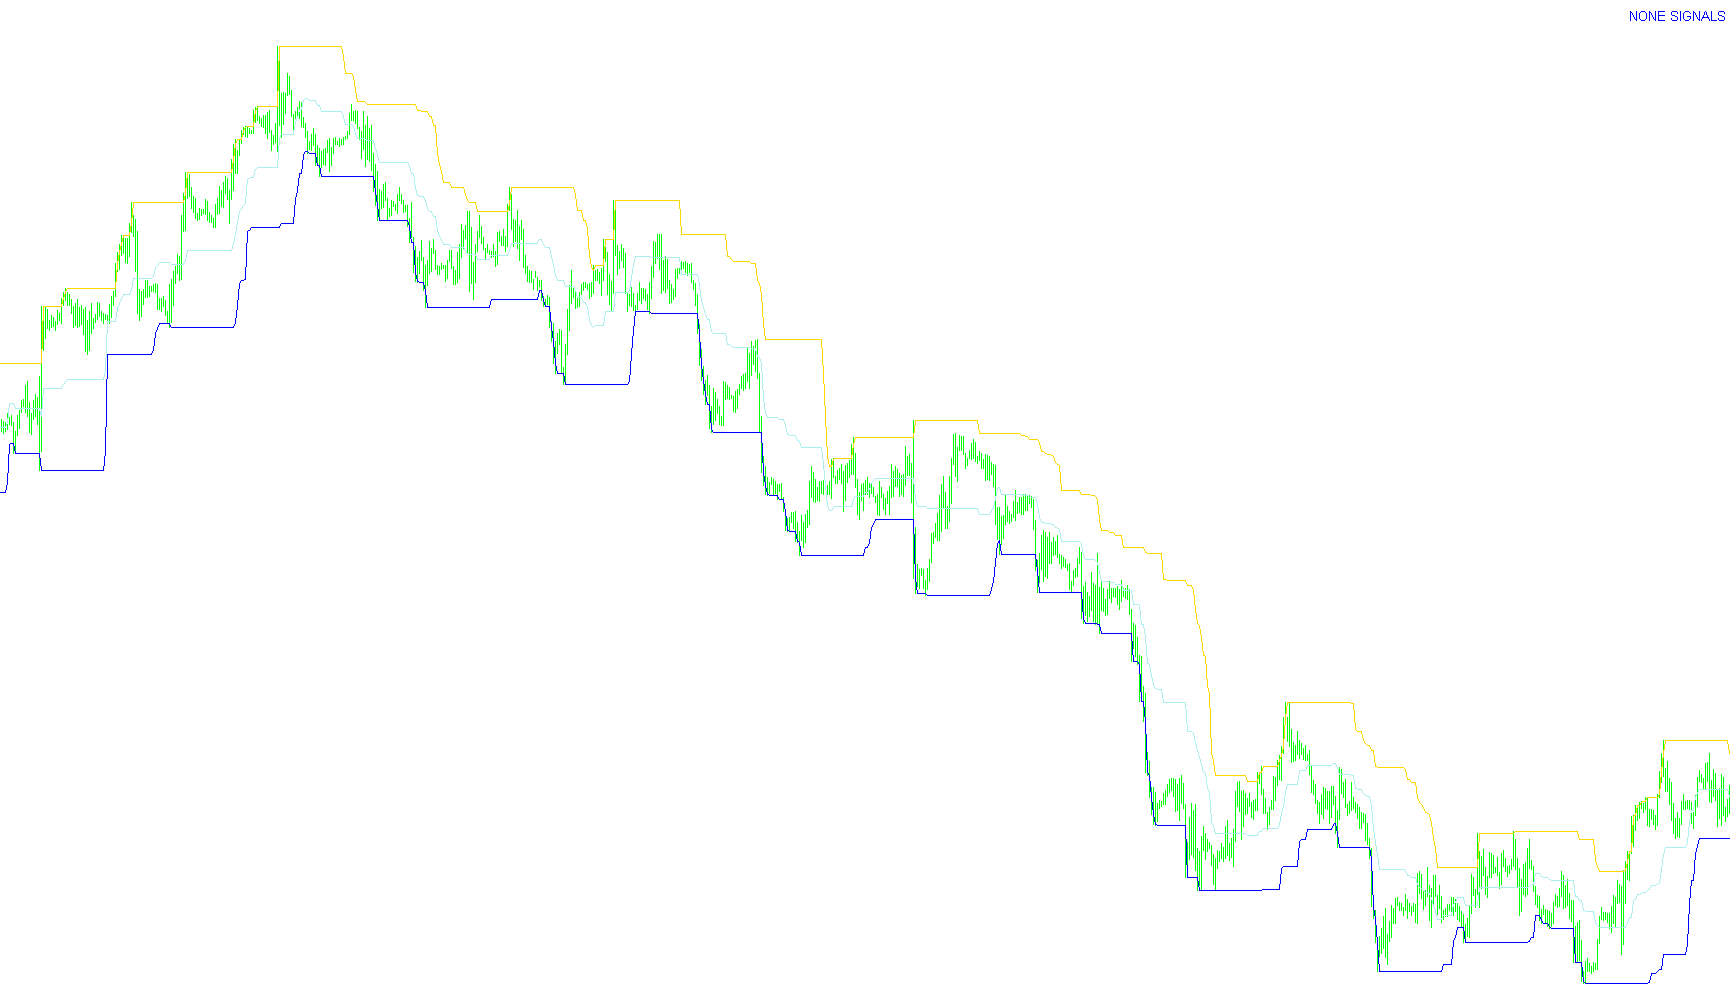
The Price Channel Central indicator is designed to provide a visual representation of market structure by identifying key price boundaries and a central equilibrium point based on recent historical data. Instead of relying on lagging moving averages, this tool focuses on the extreme highs and lows within a specific look-back period to define the current trading range.
Core Logic & Visual Components
The script operates by analyzing a set number of past bars (customizable by the user, defaulting to 32). For every point on the chart, it identifies three primary data points:
- Upper Boundary (Resistance): The highest price reached during the specified look-back period.
- Lower Boundary (Support): The lowest price reached during the same period.
- Central Equilibrium: The exact midpoint between the highest high and the lowest low of that period.
These three values are plotted on your chart as distinct lines, allowing you to see the "trading corridor" at a glance.
Dynamic Trading Signals
Beyond simply drawing lines, the indicator actively monitors live market prices to provide real-time directional context. It uses the Central Equilibrium line as the primary trigger for visual alerts:
- Buy Signal: When the current market price rises above the Central Equilibrium line, a green "BUY" label appears on the chart.
- Sell Signal: When the current market price falls below the Central Equilibrium line, a red "SELL" label appears on the chart.
Visual Aids and On-Screen Information
To enhance the user experience, the script includes several dynamic visual elements that update with every price tick:
- Price Markers: The tool automatically places arrows on the right side of the current candle. These markers correspond to the current Upper Boundary, Lower Boundary, and Central Equilibrium, ensuring you always know exactly where these levels sit in real-time.
- Dynamic Labeling: A text label is generated to announce the current signal (BUY or SELL) and its corresponding color, providing a clear, immediate summary of the market's current bias relative to the central price channel.
In essence, this tool simplifies technical analysis by distilling complex price action into a three-line channel, helping traders identify where the price is currently positioned within its recent historical range and notifying them when the price crosses the "center" of that range.
//+------------------------------------------------------------------+
//|                                        Price Channel Central.mq4 |
//|                                               Yuriy Tokman (YTG) |
//|                                               http://ytg.com.ua/ |
//+------------------------------------------------------------------+
#property copyright "Yuriy Tokman (YTG)"
#property link      "http://ytg.com.ua/"
#property version   "1.00"
#property strict
#property indicator_chart_window

#property indicator_buffers 3
#property indicator_color1 Red
#property indicator_color2 Green
#property indicator_color3 Blue
#property indicator_width1 2
#property indicator_width2 2
//----
extern int Bars_Count=32;
//---- buffers
double B0[];
double B1[];
double B2[];
//+------------------------------------------------------------------+
//| Custom indicator initialization function                         |
//+------------------------------------------------------------------+
int OnInit()
  {
//--- indicator buffers mapping
   int shift_begin=Bars_Count;
   IndicatorShortName("Price Channel Central ("+DoubleToStr(Bars_Count,0)+")");
   SetIndexBuffer(0,B0);
   SetIndexBuffer(1,B1);
   SetIndexBuffer(2,B2);
   SetIndexStyle(0,DRAW_LINE);
   SetIndexStyle(1,DRAW_LINE);
   SetIndexStyle(2,DRAW_LINE);
   SetIndexDrawBegin(0,shift_begin);
   SetIndexDrawBegin(1,shift_begin);
   SetIndexDrawBegin(2,shift_begin);
//---
   return(INIT_SUCCEEDED);
  }
//+------------------------------------------------------------------+
//| Expert deinitialization function                                 |
//+------------------------------------------------------------------+
void OnDeinit(const int reason)
  {
//---
   ArrowRightPriceDelete(0,"RightPrice1");
   ArrowRightPriceDelete(0,"RightPrice2");
   ArrowRightPriceDelete(0,"RightPrice3");
   ArrowRightPriceDelete(0,"Label");
  }
//+------------------------------------------------------------------+
//| Custom indicator iteration function                              |
//+------------------------------------------------------------------+
int OnCalculate(const int rates_total,
                const int prev_calculated,
                const datetime &time[],
                const double &open[],
                const double &high[],
                const double &low[],
                const double &close[],
                const long &tick_volume[],
                const long &volume[],
                const int &spread[])
  {
//---
   int limit=rates_total-prev_calculated;
   if(prev_calculated==0)limit--;
   else  limit++;
   double hi=0,lo=0,ce=0;
   for(int i=0; i<limit && !IsStopped(); i++)
     {
      hi = High[iHighest(Symbol(),0,MODE_HIGH,Bars_Count,i+1)];
      lo = Low[iLowest(Symbol(),0,MODE_LOW,Bars_Count,i+1)];
      ce = (hi+lo)/2;
      B0[i]=hi;
      B1[i]=lo;
      B2[i]=ce;
     }
   color colir=clrBlue; string sig="NONE";
   if(Bid>B2[0]){colir=clrGreen; sig = "BUY";}
   if(Ask<B2[0]){colir=clrRed; sig = "SELL";}
//---
   LabelCreate(sig+" SIGNALS",colir);
//---
   ArrowRightPriceCreate(0,"RightPrice1",0,Time[0],B0[0],clrRed,STYLE_SOLID,2);
   ArrowRightPriceCreate(0,"RightPrice2",0,Time[0],B1[0],clrGreen,STYLE_SOLID,2);
   ArrowRightPriceCreate(0,"RightPrice3",0,Time[0],B2[0],clrBlue,STYLE_SOLID,2);
//--- return value of prev_calculated for next call
   return(rates_total);
  }
//+------------------------------------------------------------------+
//| Ñîçäàåò ïðàâóþ öåíîâóþ ìåòêó                                     |
//+------------------------------------------------------------------+
bool ArrowRightPriceCreate(long            chart_ID=0,        // ID ãðàôèêà
                           string          name="RightPrice", // èìÿ öåíîâîé ìåòêè
                           int             sub_window=0,      // íîìåð ïîäîêíà
                           datetime        time=0,            // âðåìÿ òî÷êè ïðèâÿçêè
                           double          price=0,           // öåíà òî÷êè ïðèâÿçêè
                           color           clr=clrRed,        // öâåò öåíîâîé ìåòêè
                           ENUM_LINE_STYLE style=STYLE_SOLID, // ñòèëü îêàéìëÿþùåé ëèíèè
                           int             width=1)           // ðàçìåð öåíîâîé ìåòêè
  {
   ArrowRightPriceDelete(chart_ID,name);
//--- ñáðîñèì çíà÷åíèå îøèáêè
   ResetLastError();
//--- ñîçäàäèì öåíîâóþ ìåòêó
   if(!ObjectCreate(chart_ID,name,OBJ_ARROW_RIGHT_PRICE,sub_window,time,price))
     {
      Print(__FUNCTION__,
            ": íå óäàëîñü ñîçäàòü ïðàâóþ öåíîâóþ ìåòêó! Êîä îøèáêè = ",GetLastError());
      return(false);
     }
//--- óñòàíîâèì öâåò ìåòêè
   ObjectSetInteger(chart_ID,name,OBJPROP_COLOR,clr);
//--- óñòàíîâèì ñòèëü îêàéìëÿþùåé ëèíèè
   ObjectSetInteger(chart_ID,name,OBJPROP_STYLE,style);
//--- óñòàíîâèì ðàçìåð ìåòêè
   ObjectSetInteger(chart_ID,name,OBJPROP_WIDTH,width);
//--- óñïåøíîå âûïîëíåíèå
   return(true);
  }
//+------------------------------------------------------------------+
//| Óäàëÿåò ïðàâóþ öåíîâóþ ìåòêó ñ ãðàôèêà                           |
//+------------------------------------------------------------------+
bool ArrowRightPriceDelete(long   chart_ID=0,        // ID ãðàôèêà
                           string name="RightPrice") // èìÿ ìåòêè
  {
   if(ObjectFind(chart_ID,name)<0)return(false);
//--- ñáðîñèì çíà÷åíèå îøèáêè
   ResetLastError();
//--- óäàëèì ìåòêó
   if(!ObjectDelete(chart_ID,name))
     {
      Print(__FUNCTION__,
            ": íå óäàëîñü óäàëèòü ïðàâóþ öåíîâóþ ìåòêó! Êîä îøèáêè = ",GetLastError());
      return(false);
     }
//--- óñïåøíîå âûïîëíåíèå
   return(true);
  }
//+------------------------------------------------------------------+
//| Ñîçäàåò òåêñòîâóþ ìåòêó                                          |
//+------------------------------------------------------------------+
bool LabelCreate(string            text="Label",              // òåêñò
                 color             clr=clrRed,                // öâåò
                 long              chart_ID=0,                // ID ãðàôèêà
                 string            name="Label",              // èìÿ ìåòêè
                 int               sub_window=0,              // íîìåð ïîäîêíà
                 int               x=10,                      // êîîðäèíàòà ïî îñè X
                 int               y=10,                      // êîîðäèíàòà ïî îñè Y
                 ENUM_BASE_CORNER  corner=CORNER_RIGHT_UPPER, // óãîë ãðàôèêà äëÿ ïðèâÿçêè
                 ENUM_ANCHOR_POINT anchor=ANCHOR_RIGHT_UPPER, // ñïîñîá ïðèâÿçêè
                 string            font="Arial",              // øðèôò
                 int               font_size=10)              // ðàçìåð øðèôòà
  {
   ArrowRightPriceDelete(chart_ID,name);
//--- ñáðîñèì çíà÷åíèå îøèáêè
   ResetLastError();
//--- ñîçäàäèì òåêñòîâóþ ìåòêó
   if(!ObjectCreate(chart_ID,name,OBJ_LABEL,sub_window,0,0))
     {
      Print(__FUNCTION__,
            ": íå óäàëîñü ñîçäàòü òåêñòîâóþ ìåòêó! Êîä îøèáêè = ",GetLastError());
      return(false);
     }
//--- óñòàíîâèì êîîðäèíàòû ìåòêè
   ObjectSetInteger(chart_ID,name,OBJPROP_XDISTANCE,x);
   ObjectSetInteger(chart_ID,name,OBJPROP_YDISTANCE,y);
//--- óñòàíîâèì óãîë ãðàôèêà, îòíîñèòåëüíî êîòîðîãî áóäóò îïðåäåëÿòüñÿ êîîðäèíàòû òî÷êè
   ObjectSetInteger(chart_ID,name,OBJPROP_CORNER,corner);
//--- óñòàíîâèì òåêñò
   ObjectSetString(chart_ID,name,OBJPROP_TEXT,text);
//--- óñòàíîâèì øðèôò òåêñòà
   ObjectSetString(chart_ID,name,OBJPROP_FONT,font);
//--- óñòàíîâèì ðàçìåð øðèôòà
   ObjectSetInteger(chart_ID,name,OBJPROP_FONTSIZE,font_size);
//--- óñòàíîâèì ñïîñîá ïðèâÿçêè
   ObjectSetInteger(chart_ID,name,OBJPROP_ANCHOR,anchor);
//--- óñòàíîâèì öâåò
   ObjectSetInteger(chart_ID,name,OBJPROP_COLOR,clr);
//--- óñïåøíîå âûïîëíåíèå
   return(true);
  }
//+------------------------------------------------------------------+
Comments