qema_percent_app_pr
Download script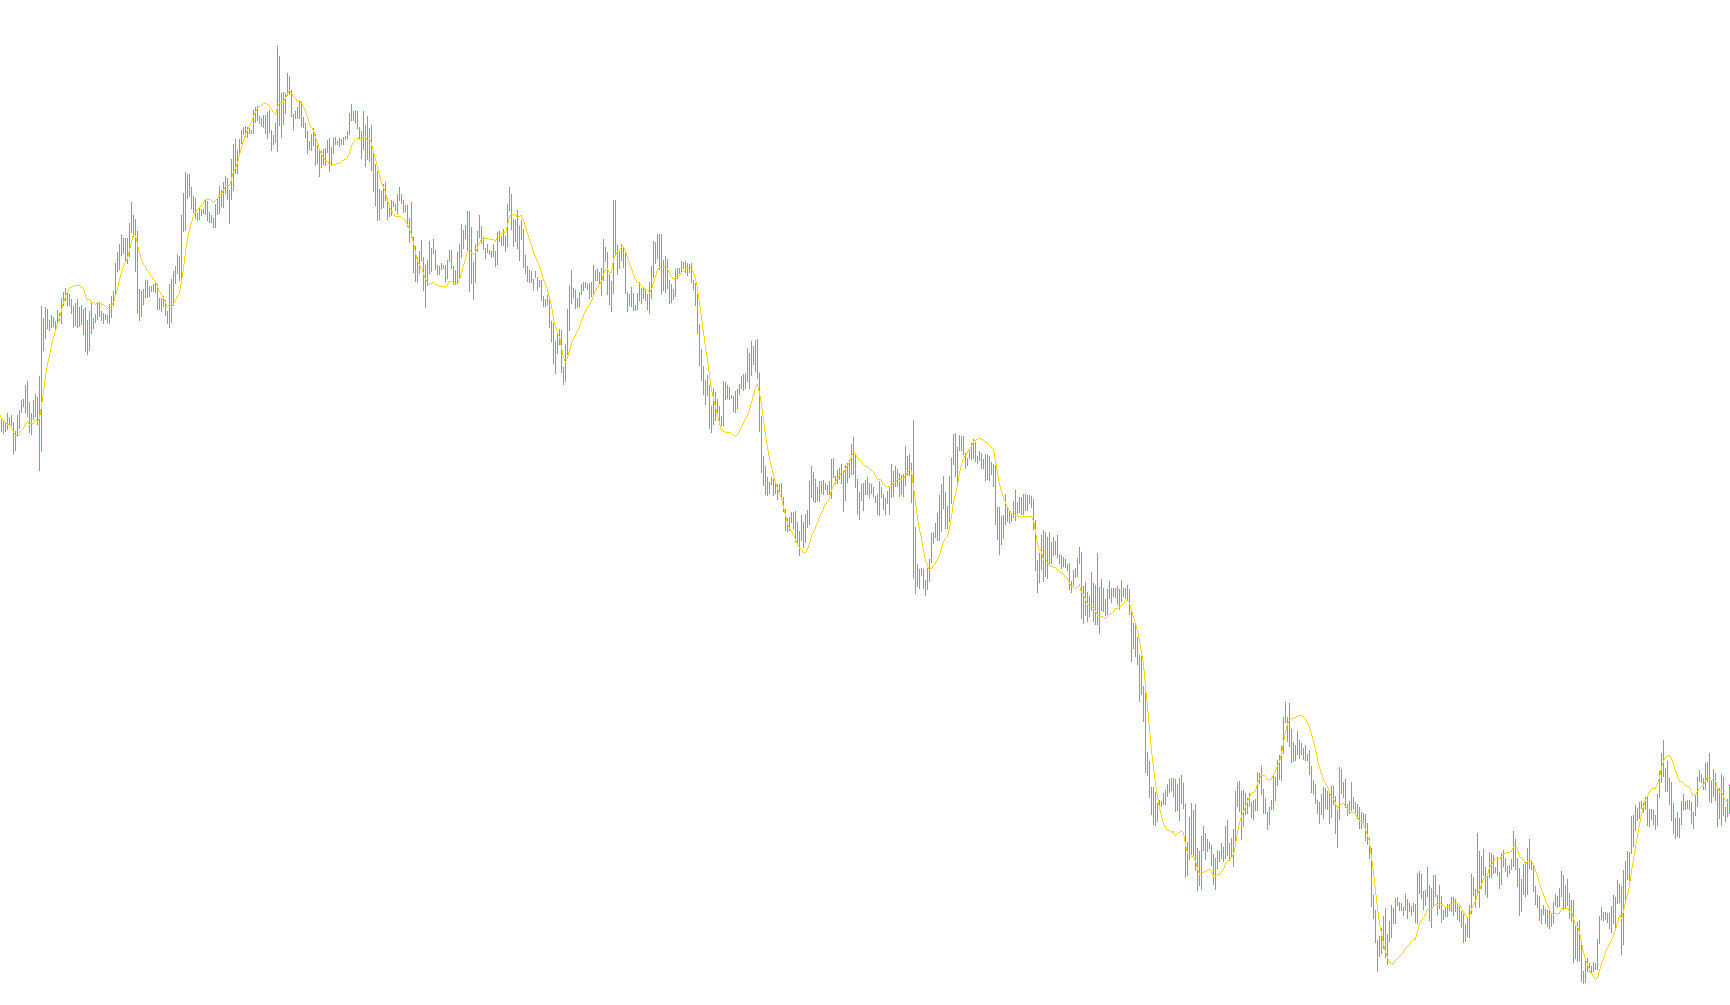
This custom trading indicator, known as the QEMA Percentage, is designed to provide traders with a smoothed and refined view of market trends by utilizing a sophisticated multi-layered calculation. Instead of relying on a single moving average, it creates a complex "echo" of price data to filter out market noise and identify clearer directional movements.
How it Works
The logic behind this tool follows a structured three-step process:
1. Multi-Layered Smoothing The script begins by generating five distinct moving averages. Rather than calculating each one independently from the raw price, the script uses a "chaining" method. The first average is derived from the market price; the second is derived from the first average; the third from the second, and so on, until it reaches five layers of smoothing. This cascading effect helps to dampen sudden, erratic price spikes while maintaining the underlying trend.
2. Weighted Combination (The QEMA) Once these five layers are established, the indicator performs a weighted calculation to produce the final "QEMA" line. It assigns specific mathematical weights (coefficients) to each of the five layers. By blending these layers together, the tool balances different types of responsiveness—combining the more immediate reactions of the initial layers with the highly stabilized data from the deeper layers.
3. Customizable Input Parameters To give users flexibility, the logic allows for three primary configurations:
- Period: Determines the baseline timeframe used to calculate the averages.
- Correction Factor: Adjusts the intensity of the weighting applied to the different layers.
- Price Type: Allows you to choose which price data point the entire system should base its calculations on (such as the Closing Price, High/Low averages, or Open prices).
Summary for the Trader
In practical terms, this indicator is built to provide a "smoother" trend line than standard moving averages. By layering multiple averages and combining them with specific weights, it attempts to offer a more stable visual guide, helping traders distinguish between temporary market volatility and the actual long-term direction of the price.
//+---------------------------------------------------------------------+              |
//| Fabrizio Gargiulo 2016 - Formia (LT) ITALY                          |
//| fajuzi@yahoo.it +393496380490                                       |
//| Copyright 2005-2014, MetaQuotes Software Corp.                      |
//+---------------------------------------------------------------------+
#property copyright "Fabrizio Gargiulo 2015"
#property description "qema percentage"
#property indicator_chart_window
#property indicator_buffers 1
#property indicator_color1 Red
//--- input
input int                  ema_per=50;
input int                  correction=100;
input ENUM_APPLIED_PRICE   applied=PRICE_CLOSE;
//---- buffers
double ema[],ema2[],ema3[],ema4[],ema5[],qema[];
int limit,i;
double k1,k2,k3,k4,k5,k_ema_per;
//+------------------------------------------------------------------+
//| Custom indicator initialization function                         |
//+------------------------------------------------------------------+
int init()
  {
//---- indicators
   IndicatorBuffers(6);
   SetIndexStyle(0,DRAW_LINE,STYLE_SOLID);
   SetIndexBuffer(0,qema);
   SetIndexBuffer(1,ema);
   SetIndexBuffer(2,ema2);
   SetIndexBuffer(3,ema3);
   SetIndexBuffer(4,ema4);
   SetIndexBuffer(5,ema5);
   IndicatorDigits(5);
   SetIndexDrawBegin(0,ema_per*5);
   IndicatorShortName("QEMA("+ema_per+")");
   k1=(1.0+4.0*correction*0.01);
   k2=-10.0*correction*0.01;
   k3=10.0*correction*0.01;
   k4=-5.0*correction*0.01;
   k5=correction*0.01;
   k_ema_per=(ema_per+1.0)/2.0;
//SetIndexLabel(0,short_name);
//----
   return(1);
  }
//+------------------------------------------------------------------+
//| Custom indicator iteration function                              |
//+------------------------------------------------------------------+
int start()
  {
   int counted_bars=IndicatorCounted();
//---- check for possible errors
   if(counted_bars<0 || Bars<5*ema_per) return(-1);
//---- last counted bar will be recounted
   limit=Bars-3;
   if(counted_bars>0) limit=Bars-counted_bars-1;
   else
     {
      ema[limit+1]=GetPrice(limit+1);
      ema2[limit+1]=ema[limit+1];
      ema3[limit+1]=ema[limit+1];
      ema4[limit+1]=ema[limit+1];
      ema5[limit+1]=ema[limit+1];
     }
   for(i=limit; i>=0; i--)
     {
      ema[i]=ema[i+1]+(GetPrice(i)-ema[i+1])/k_ema_per;
      ema2[i]=ema2[i+1]+(ema[i]-ema2[i+1])/k_ema_per;
      ema3[i]=ema3[i+1]+(ema2[i]-ema3[i+1])/k_ema_per;
      ema4[i]=ema4[i+1]+(ema3[i]-ema4[i+1])/k_ema_per;
      ema5[i]=ema5[i+1]+(ema4[i]-ema5[i+1])/k_ema_per;
      qema[i]=k1*ema[i]+k2*ema2[i]+k3*ema3[i]+k4*ema4[i]+k5*ema5[i];
     }
//----
   return(0);
  }
//+------------------------------------------------------------------+
//| Get price (o,h,l,c,median,typical,weighted)                      |
//+------------------------------------------------------------------+
double GetPrice(int h)
  {
   switch(applied)
     {
      case PRICE_CLOSE: return(Close[h]);
      case PRICE_MEDIAN: return((High[h]+Low[h])/2.0);
      case PRICE_TYPICAL: return((Close[h]+High[h]+Low[h])/3.0);
      case PRICE_WEIGHTED: return((2.0*Close[h]+High[h]+Low[h])/4.0);
      case PRICE_LOW: return(Low[h]);
      case PRICE_HIGH: return(High[h]);
      case PRICE_OPEN: return(Open[h]);
      default: return(0.5*(High[h]+Low[h]));
     }
  }
//+------------------------------------------------------------------+
Comments