Quantile_bands_1.3
Download script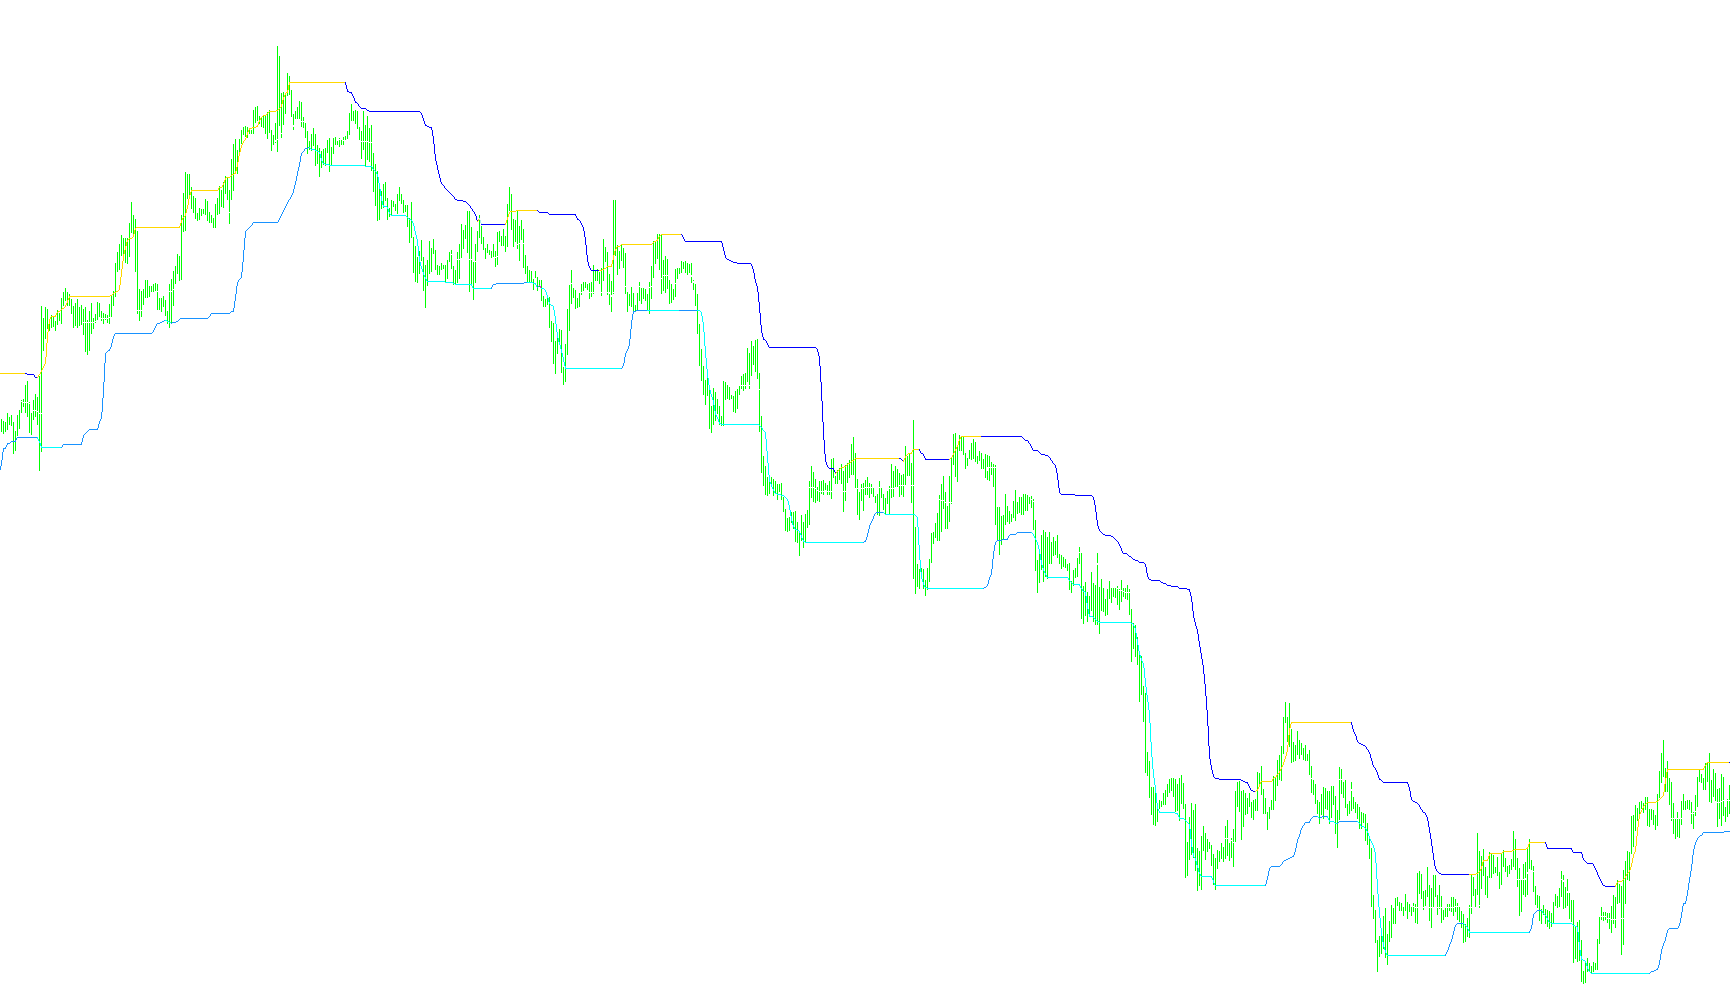
This script is a sophisticated technical analysis tool designed to identify and visualize price extremes and trends using "Quantile Bands." Instead of simply following the price, it calculates specific statistical thresholds over a set period to help traders see where the market sits relative to its recent history.
Core Logic and Functionality
1. Data Point Selection The indicator begins by determining which type of price data to analyze. It is highly versatile and can look at standard values (like Open, High, Low, or Close), calculated averages (like Typical Price or Weighted Price), or even specialized smoothed values like Heiken Ashi prices. By choosing a specific "Median" price as a baseline, the tool creates a more stable foundation for its calculations than using volatile high/low points alone.
2. Quantile Band Calculation The heart of the script is the "Quantile" logic. For every bar on your chart, the script looks back over a user-defined number of periods (e.g., 35 bars). It collects the prices from those periods and sorts them mathematically to find specific percentiles:
- Upper Band: Represents the top percentage of price action (e.g., the 90th percentile).
- Lower Band: Represents the bottom percentage of price action (e.g., the 10th percentile).
- Median Band: Represents the middle ground of the price range (e.g., the 50th percentile).
By identifying these percentiles, the script creates a "zone" of normal activity. When the price moves into the upper or lower bands, it suggests the market is reaching an extreme state relative to its recent history.
3. Trend Detection and Dynamic Coloring The tool doesn't just draw lines; it interprets the direction of the market. It compares the current state of the Upper, Lower, and Median bands against their previous positions to determine "Trend Biases."
- It identifies if the bands are moving upward, downward, or staying flat.
- Based on these movements, the indicator dynamically changes the visual representation (colors and thicknesses) on your chart. This helps distinguish between a strong trending market and a ranging/sideways market.
4. Multi-Timeframe (MTF) Integration One of the script's advanced features is its ability to "reach out" and see data from different timeframes. If you are looking at a 5-minute chart, the script can still calculate these quantile bands based on 1-hour or 4-hour data. It includes an "Interpolation" engine, which mathematically smooths the transition between these different timeframes so that the lines appear fluid and continuous rather than "stepping" or jumping.
5. Visual Smoothing and Refinement To ensure the chart remains readable for the human eye, the script contains logic to clean up and "plot" the points effectively. It manages how lines connect to prevent messy overlaps and ensures that the visual indicators are clear, highlighting significant shifts in price momentum while filtering out minor market noise.
//+------------------------------------------------------------------+
//|                                                   quantile bands |
//+------------------------------------------------------------------+
#property link      "www.forex-station.com"
#property copyright "www.forex-station.com"

#property indicator_chart_window
#property indicator_buffers 11
#property indicator_color1  clrLimeGreen
#property indicator_color2  clrSandyBrown
#property indicator_color3  clrSandyBrown
#property indicator_color4  clrLimeGreen
#property indicator_color5  clrSandyBrown
#property indicator_color6  clrSandyBrown
#property indicator_color7  clrSilver
#property indicator_color8  clrLimeGreen
#property indicator_color9  clrLimeGreen
#property indicator_color10 clrSandyBrown
#property indicator_color11 clrSandyBrown
#property indicator_width7  3
#property indicator_width8  3
#property indicator_width9  3
#property indicator_width10 3
#property indicator_width11 3
#property strict

//
//
//
//
//

enum enPrices
{
   pr_close,      // Close
   pr_open,       // Open
   pr_high,       // High
   pr_low,        // Low
   pr_median,     // Median
   pr_typical,    // Typical
   pr_weighted,   // Weighted
   pr_average,    // Average (high+low+open+close)/4
   pr_medianb,    // Average median body (open+close)/2
   pr_tbiased,    // Trend biased price
   pr_tbiased2,   // Trend biased (extreme) price
   pr_haclose,    // Heiken ashi close
   pr_haopen ,    // Heiken ashi open
   pr_hahigh,     // Heiken ashi high
   pr_halow,      // Heiken ashi low
   pr_hamedian,   // Heiken ashi median
   pr_hatypical,  // Heiken ashi typical
   pr_haweighted, // Heiken ashi weighted
   pr_haaverage,  // Heiken ashi average
   pr_hamedianb,  // Heiken ashi median body
   pr_hatbiased,  // Heiken ashi trend biased price
   pr_hatbiased2  // Heiken ashi trend biased (extreme) price
};

extern ENUM_TIMEFRAMES    TimeFrame         = PERIOD_CURRENT; // Time frame
extern int                Periods           = 35;             // Calculating period
extern enPrices           PriceM            = pr_median;      // Median price
extern enPrices           PriceH            = pr_high;        // High price
extern enPrices           PriceL            = pr_low;         // Low price
extern double             UpperBandPercent  = 90;             // Upper band percent
extern double             LowerBandPercent  = 10;             // Lower band percent
extern double             MedianBandPercent = 50;             // Median percent
extern bool               Interpolate       = true;           // Interpolate in multi time frame mode?

//
//
//
//
//

double bufferUp[],bufferUpa[],bufferUpb[],bufferDn[],bufferDna[],bufferDnb[],bufferMe[],bufferMua[],bufferMub[],bufferMda[],bufferMdb[],trendu[],trendd[],trendm[],pricesm[],pricesh[],pricesl[],count[];
string indicatorFileName;
#define _mtfCall(_buff,_ind) iCustom(NULL,TimeFrame,indicatorFileName,PERIOD_CURRENT,Periods,PriceM,PriceH,PriceL,UpperBandPercent,LowerBandPercent,MedianBandPercent,_buff,_ind)

//------------------------------------------------------------------
//
//------------------------------------------------------------------
//
//
//
//
//

int init()
{
   IndicatorBuffers(18);
   SetIndexBuffer( 0,bufferUp);
   SetIndexBuffer( 1,bufferUpa);
   SetIndexBuffer( 2,bufferUpb);
   SetIndexBuffer( 3,bufferDn);
   SetIndexBuffer( 4,bufferDna);
   SetIndexBuffer( 5,bufferDnb);
   SetIndexBuffer( 6,bufferMe);
   SetIndexBuffer( 7,bufferMua);
   SetIndexBuffer( 8,bufferMub);
   SetIndexBuffer( 9,bufferMda);
   SetIndexBuffer(10,bufferMdb);
   SetIndexBuffer(11,trendu);
   SetIndexBuffer(12,trendd);
   SetIndexBuffer(13,trendm);
   SetIndexBuffer(14,pricesm);
   SetIndexBuffer(15,pricesl);
   SetIndexBuffer(16,pricesh);
   SetIndexBuffer(17,count);

   //
   //
   //
   //
   //

      Periods           = MathMax(Periods,1);
      UpperBandPercent  = MathMax(MathMin(UpperBandPercent ,100),0);
      LowerBandPercent  = MathMax(MathMin(LowerBandPercent ,100),0);
      MedianBandPercent = MathMax(MathMin(MedianBandPercent,100),0);
      indicatorFileName = WindowExpertName();
      TimeFrame         = MathMax(TimeFrame,_Period);

   //
   //
   //
   //
   //

   IndicatorShortName(timeFrameToString(TimeFrame)+" Quantile bands ("+(string)Periods+")");
   return(0);
}
int deinit() { return(0); }

//------------------------------------------------------------------
//
//------------------------------------------------------------------
//
//
//
//
//

int start()
{
   int counted_bars=IndicatorCounted();
      if(counted_bars<0) return(-1);
      if(counted_bars>0) counted_bars--;
         int limit = MathMin(Bars-counted_bars,Bars-1); count[0] = limit;
            if (TimeFrame!=_Period)
            {
               limit = (int)MathMax(limit,MathMin(Bars-1,_mtfCall(15,0)*TimeFrame/_Period));
               if (trendu[limit]==-1) CleanPoint(limit,bufferUpa,bufferUpb);
               if (trendd[limit]==-1) CleanPoint(limit,bufferDna,bufferDnb);
               if (trendm[limit]>  0) CleanPoint(limit,bufferMua,bufferMub);
               if (trendm[limit]<  0) CleanPoint(limit,bufferMda,bufferMdb);
               for (int i=limit;i>=0 && !_StopFlag; i--)
               {
                  int y = iBarShift(NULL,TimeFrame,Time[i]);
                     bufferUp[i]  = _mtfCall( 0,y);
                     bufferDn[i]  = _mtfCall( 3,y);;
                     bufferMe[i]  = _mtfCall( 6,y);;
                     trendu[i]    = _mtfCall(11,y);;
                     trendd[i]    = _mtfCall(12,y);;
                     trendm[i]    = _mtfCall(13,y);;
                     bufferUpa[i] = EMPTY_VALUE;
                     bufferUpb[i] = EMPTY_VALUE;
                     bufferDna[i] = EMPTY_VALUE;
                     bufferDnb[i] = EMPTY_VALUE;
                     bufferMua[i] = EMPTY_VALUE;
                     bufferMub[i] = EMPTY_VALUE;
                     bufferMda[i] = EMPTY_VALUE;
                     bufferMdb[i] = EMPTY_VALUE;
                     if (!Interpolate || (i>0 && y==iBarShift(NULL,TimeFrame,Time[i-1]))) continue;

                     //
                     //
                     //
                     //
                     //

                     #define _interpolate(buff) buff[i+k] = buff[i]+(buff[i+n]-buff[i])*k/n
                     int n,k; datetime time = iTime(NULL,TimeFrame,y);
                        for(n = 1; (i+n)<Bars && Time[i+n] >= time; n++) continue;
                        for(k = 1; k<n && (i+n)<Bars && (i+k)<Bars; k++)
                        {
                           _interpolate(bufferUp);
                           _interpolate(bufferDn);
                           _interpolate(bufferMe);
                        }
               }
               for(int i=limit; i>=0; i--)
               {
                  if (trendu[i]==-1) PlotPoint(i,bufferUpa,bufferUpb,bufferUp);
                  if (trendd[i]==-1) PlotPoint(i,bufferDna,bufferDnb,bufferDn);
                  if (trendm[i]<  0) PlotPoint(i,bufferMda,bufferMdb,bufferMe);
                  if (trendm[i]>  0) PlotPoint(i,bufferMua,bufferMub,bufferMe);
               }
               return(0);
            }

   //
   //
   //
   //
   //

   int calcPeriod = MathMin(Periods,Bars);
   double workPrices[];  ArrayResize(workPrices,calcPeriod);
   if (trendu[limit]==-1) CleanPoint(limit,bufferUpa,bufferUpb);
   if (trendd[limit]==-1) CleanPoint(limit,bufferDna,bufferDnb);
   if (trendm[limit]>  0) CleanPoint(limit,bufferMua,bufferMub);
   if (trendm[limit]<  0) CleanPoint(limit,bufferMda,bufferMdb);
   for(int i=limit; i>=0; i--)
   {
      double prices[3]; prices[0] = getPrice(PriceH,Open,Close,High,Low,i,0);
                        prices[1] = getPrice(PriceL,Open,Close,High,Low,i,1);
                        prices[2] = getPrice(PriceM,Open,Close,High,Low,i,2);
            ArraySort(prices);
                  pricesl[i] = prices[0]; pricesm[i] = prices[1]; pricesh[i] = prices[2];
            ArrayCopy(workPrices,pricesh,0,i,calcPeriod); bufferUp[i] = iQuantile(calcPeriod,UpperBandPercent ,workPrices);
            ArrayCopy(workPrices,pricesl,0,i,calcPeriod); bufferDn[i] = iQuantile(calcPeriod,LowerBandPercent ,workPrices);
            ArrayCopy(workPrices,pricesm,0,i,calcPeriod); bufferMe[i] = iQuantile(calcPeriod,MedianBandPercent,workPrices);
            trendu[i]    = (i<Bars-1) ? (bufferUp[i]>bufferUp[i+1]) ? 1 : (bufferUp[i]<bufferUp[i+1]) ? -1 : trendu[i+1] : 0;
            trendd[i]    = (i<Bars-1) ? (bufferDn[i]>bufferDn[i+1]) ? 1 : (bufferDn[i]<bufferDn[i+1]) ? -1 : trendd[i+1] : 0;
            trendm[i]    = trendu[i]+trendd[i];
            bufferUpa[i] = EMPTY_VALUE;
            bufferUpb[i] = EMPTY_VALUE;
            bufferDna[i] = EMPTY_VALUE;
            bufferDnb[i] = EMPTY_VALUE;
            bufferMua[i] = EMPTY_VALUE;
            bufferMub[i] = EMPTY_VALUE;
            bufferMda[i] = EMPTY_VALUE;
            bufferMdb[i] = EMPTY_VALUE;
               if (trendu[i] == -1) PlotPoint(i,bufferUpa,bufferUpb,bufferUp);
               if (trendd[i] == -1) PlotPoint(i,bufferDna,bufferDnb,bufferDn);
               if (trendm[i] <   0) PlotPoint(i,bufferMda,bufferMdb,bufferMe);
               if (trendm[i] >   0) PlotPoint(i,bufferMua,bufferMub,bufferMe);
      }
   return(0);
}

//------------------------------------------------------------------
//
//------------------------------------------------------------------
//
//
//
//
//

double iQuantile(int period, double qp, double& quantileArray[])
{
   ArraySort(quantileArray);

   //
   //
   //
   //
   //

   double index = (period-1)*qp/100.00;
   int    ind   = (int)index;
   double delta = index - ind;
   if (ind == NormalizeDouble(index,5))
         return(            quantileArray[ind]);
   else  return((1.0-delta)*quantileArray[ind]+delta*quantileArray[ind+1]);
}


//------------------------------------------------------------------
//
//------------------------------------------------------------------
//
//
//
//
//
//

#define priceInstances 3
double workHa[][priceInstances*4];
double getPrice(int tprice, const double& open[], const double& close[], const double& high[], const double& low[], int i, int instanceNo=0)
{
  if (tprice>=pr_haclose)
   {
      if (ArrayRange(workHa,0)!= Bars) ArrayResize(workHa,Bars); instanceNo*=4; int r = Bars-i-1;

         //
         //
         //
         //
         //

         double haOpen;
         if (r>0)
                haOpen  = (workHa[r-1][instanceNo+2] + workHa[r-1][instanceNo+3])/2.0;
         else   haOpen  = (open[i]+close[i])/2;
         double haClose = (open[i] + high[i] + low[i] + close[i]) / 4.0;
         double haHigh  = MathMax(high[i], MathMax(haOpen,haClose));
         double haLow   = MathMin(low[i] , MathMin(haOpen,haClose));

         if(haOpen  <haClose) { workHa[r][instanceNo+0] = haLow;  workHa[r][instanceNo+1] = haHigh; }
         else                 { workHa[r][instanceNo+0] = haHigh; workHa[r][instanceNo+1] = haLow;  }
                                workHa[r][instanceNo+2] = haOpen;
                                workHa[r][instanceNo+3] = haClose;
         //
         //
         //
         //
         //

         switch (tprice)
         {
            case pr_haclose:     return(haClose);
            case pr_haopen:      return(haOpen);
            case pr_hahigh:      return(haHigh);
            case pr_halow:       return(haLow);
            case pr_hamedian:    return((haHigh+haLow)/2.0);
            case pr_hamedianb:   return((haOpen+haClose)/2.0);
            case pr_hatypical:   return((haHigh+haLow+haClose)/3.0);
            case pr_haweighted:  return((haHigh+haLow+haClose+haClose)/4.0);
            case pr_haaverage:   return((haHigh+haLow+haClose+haOpen)/4.0);
            case pr_hatbiased:
               if (haClose>haOpen)
                     return((haHigh+haClose)/2.0);
               else  return((haLow+haClose)/2.0);
            case pr_hatbiased2:
               if (haClose>haOpen)  return(haHigh);
               if (haClose<haOpen)  return(haLow);
                                    return(haClose);
         }
   }

   //
   //
   //
   //
   //

   switch (tprice)
   {
      case pr_close:     return(close[i]);
      case pr_open:      return(open[i]);
      case pr_high:      return(high[i]);
      case pr_low:       return(low[i]);
      case pr_median:    return((high[i]+low[i])/2.0);
      case pr_medianb:   return((open[i]+close[i])/2.0);
      case pr_typical:   return((high[i]+low[i]+close[i])/3.0);
      case pr_weighted:  return((high[i]+low[i]+close[i]+close[i])/4.0);
      case pr_average:   return((high[i]+low[i]+close[i]+open[i])/4.0);
      case pr_tbiased:
               if (close[i]>open[i])
                     return((high[i]+close[i])/2.0);
               else  return((low[i]+close[i])/2.0);
      case pr_tbiased2:
               if (close[i]>open[i]) return(high[i]);
               if (close[i]<open[i]) return(low[i]);
                                     return(close[i]);
   }
   return(0);
}

//-------------------------------------------------------------------
//
//-------------------------------------------------------------------
//
//
//
//
//

void CleanPoint(int i,double& first[],double& second[])
{
   if (i>=Bars-3) return;
   if ((second[i]  != EMPTY_VALUE) && (second[i+1] != EMPTY_VALUE))
        second[i+1] = EMPTY_VALUE;
   else
      if ((first[i] != EMPTY_VALUE) && (first[i+1] != EMPTY_VALUE) && (first[i+2] == EMPTY_VALUE))
          first[i+1] = EMPTY_VALUE;
}

void PlotPoint(int i,double& first[],double& second[],double& from[])
{
   if (i>=Bars-2) return;
   if (first[i+1] == EMPTY_VALUE)
      if (first[i+2] == EMPTY_VALUE)
            { first[i]  = from[i];  first[i+1]  = from[i+1]; second[i] = EMPTY_VALUE; }
      else  { second[i] =  from[i]; second[i+1] = from[i+1]; first[i]  = EMPTY_VALUE; }
   else     { first[i]  = from[i];                           second[i] = EMPTY_VALUE; }
}

//-------------------------------------------------------------------
//
//-------------------------------------------------------------------
//
//
//
//
//

string sTfTable[] = {"M1","M5","M15","M30","H1","H4","D1","W1","MN"};
int    iTfTable[] = {1,5,15,30,60,240,1440,10080,43200};

string timeFrameToString(int tf)
{
   for (int i=ArraySize(iTfTable)-1; i>=0; i--)
         if (tf==iTfTable[i]) return(sTfTable[i]);
                              return("");
}
Comments