pwo_svs
Download script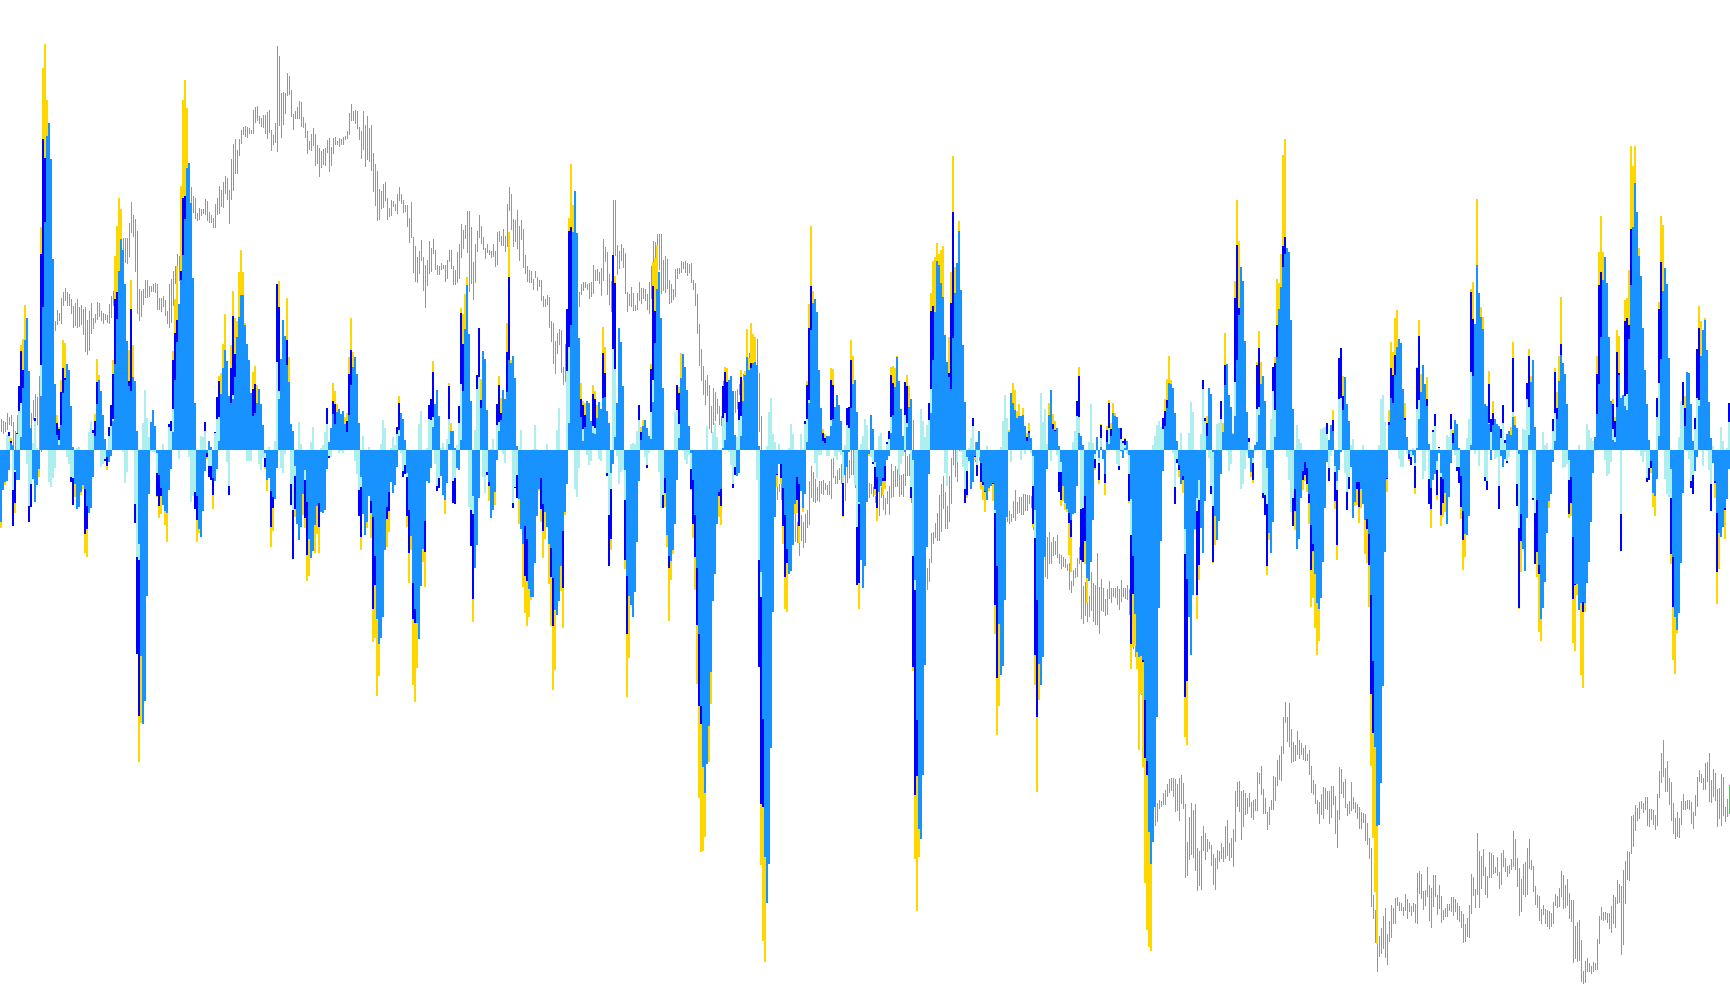
This tool is designed as a specialized visual oscillator for the MetaTrader platform, primarily intended to help traders identify underlying market trends and momentum shifts. Unlike standard indicators that might only look at price action in a single direction, this script utilizes a multi-layered calculation approach to provide a more nuanced view of market dynamics.
How the Logic Works
The core functionality of this indicator relies on several key mathematical steps:
1. Multi-Period Data Collection The script begins by analyzing the market using three different timeframes (periods) simultaneously. By looking at these different windows—ranging from a short-term period to a much longer one—the tool can distinguish between temporary price "noise" and actual long-term movement. It calculates the average values for each of these periods to create a foundation of data.
2. Interaction & Relationship Mapping Instead of just showing you what the price is doing, the logic focuses on the relationship between these different periods. It measures the distance and variance between:
- The short-term trends vs. the long-term trends.
- The relationship between the immediate price movement and the broader average.
- The "gap" or synchronization between various moving averages.
3. Smoothing and Synthesis To ensure that the data is readable and not too erratic for a human trader to interpret, the script performs several rounds of averaging. It combines the differences calculated in the previous step to create secondary values. These values represent the "velocity" and "acceleration" of the trend.
4. Visual Output The final result is visualized as a series of histograms in a separate window below the main price chart. Each distinct colored bar represents a different component of this calculation:
- One set of bars focuses on the primary momentum.
- Another captures the relative strength or "pull" between the short and long periods.
- The remaining bars highlight the divergence and stability of the trend.
Summary for the Trader
By using this logic, the indicator aims to provide a clearer picture of market health. When these histogram values move in harmony, it suggests a strong, established trend. When they begin to diverge or shift significantly, it provides a visual cue that the momentum is changing, potentially signaling a coming trend reversal or a period of high volatility.
//+------------------------------------------------------------------+
//|svs_trend  svs_oscillator                                         |
//+------------------------------------------------------------------+
#property copyright "Tver,SVS,S Vadim,svstnd@mail.ru,2011."
#property link      ""
#property indicator_separate_window
#property indicator_buffers 4
#property indicator_color1 Green
#property indicator_color2 Blue
#property indicator_color3 Red
#property indicator_color4 Black
extern int period=4;
extern int thic=4;
//---- buffers
double ExtMapBuffer1[];
double ExtMapBuffer2[];
double ExtMapBuffer3[];
double ExtMapBuffer4[];
double ExtMapBuffer5[];
double ExtMapBuffer6[];
//+------------------------------------------------------------------+
//| Custom indicator initialization function                         |
//+------------------------------------------------------------------+
int init()
  {
//---- indicators
   SetIndexStyle(0,DRAW_HISTOGRAM,0,thic);
   SetIndexBuffer(0,ExtMapBuffer1);
   SetIndexStyle(1,DRAW_HISTOGRAM,0,thic);
   SetIndexBuffer(1,ExtMapBuffer2);
   SetIndexStyle(2,DRAW_HISTOGRAM,0,thic);
   SetIndexBuffer(2,ExtMapBuffer3);
   SetIndexStyle(3,DRAW_HISTOGRAM,0,thic);
   SetIndexBuffer(3,ExtMapBuffer4);
//----
   return(0);
  }
//+------------------------------------------------------------------+
//| Custom indicator iteration function                              |
//+------------------------------------------------------------------+
int start()
  {
   double v1,v2,vv1,vv2,z,m1,m2,m3,smm,smz,zm1,m1z,zm2,msm,rmm,rms;
   int p1,p2,p3,MODE;
//---- TODO: add your code here
   int limit;
   int counted_bars=IndicatorCounted();
   if(counted_bars>0) counted_bars--;
   limit=Bars-counted_bars-1;
   for(int i=0;i<=limit;i++){
//----------------------------
      MODE=0;
      p1=period;
      p2=period*2;
      p3=(p1+p2)/2;
      //------------------------------------
      z=iMA(NULL,0,1,0,MODE,5,i);
      m1=iMA(NULL,0,p1,0,MODE,5,i);
      m2=iMA(NULL,0,p2,0,MODE,5,i);
      m3=iMA(NULL,0,p3,0,MODE,5,i);
      //---------------------------------------
      smm=(m1+m2)/2;
      smz=(m2+z)/2;
      zm1=z-m1;
      m1z=smz-m1;
      zm2=z-m2;
      msm=smm-m3;
      rmm=m1-m2;
      rms=smz-smm;
      v1=(zm1+m1z+msm)/3;
      v2=(zm2+rmm+rms)/3;
      vv1=(v1+v2)/2;
      vv2=v2-v1;
      //-------------------------
      ExtMapBuffer1[i]=v2;
      ExtMapBuffer2[i]=vv1;
      ExtMapBuffer3[i]=v1/2;
      ExtMapBuffer4[i]=vv2;
      }
   return(0);
  }
//+--------------------------------+
Comments