Raghee Vague
Download script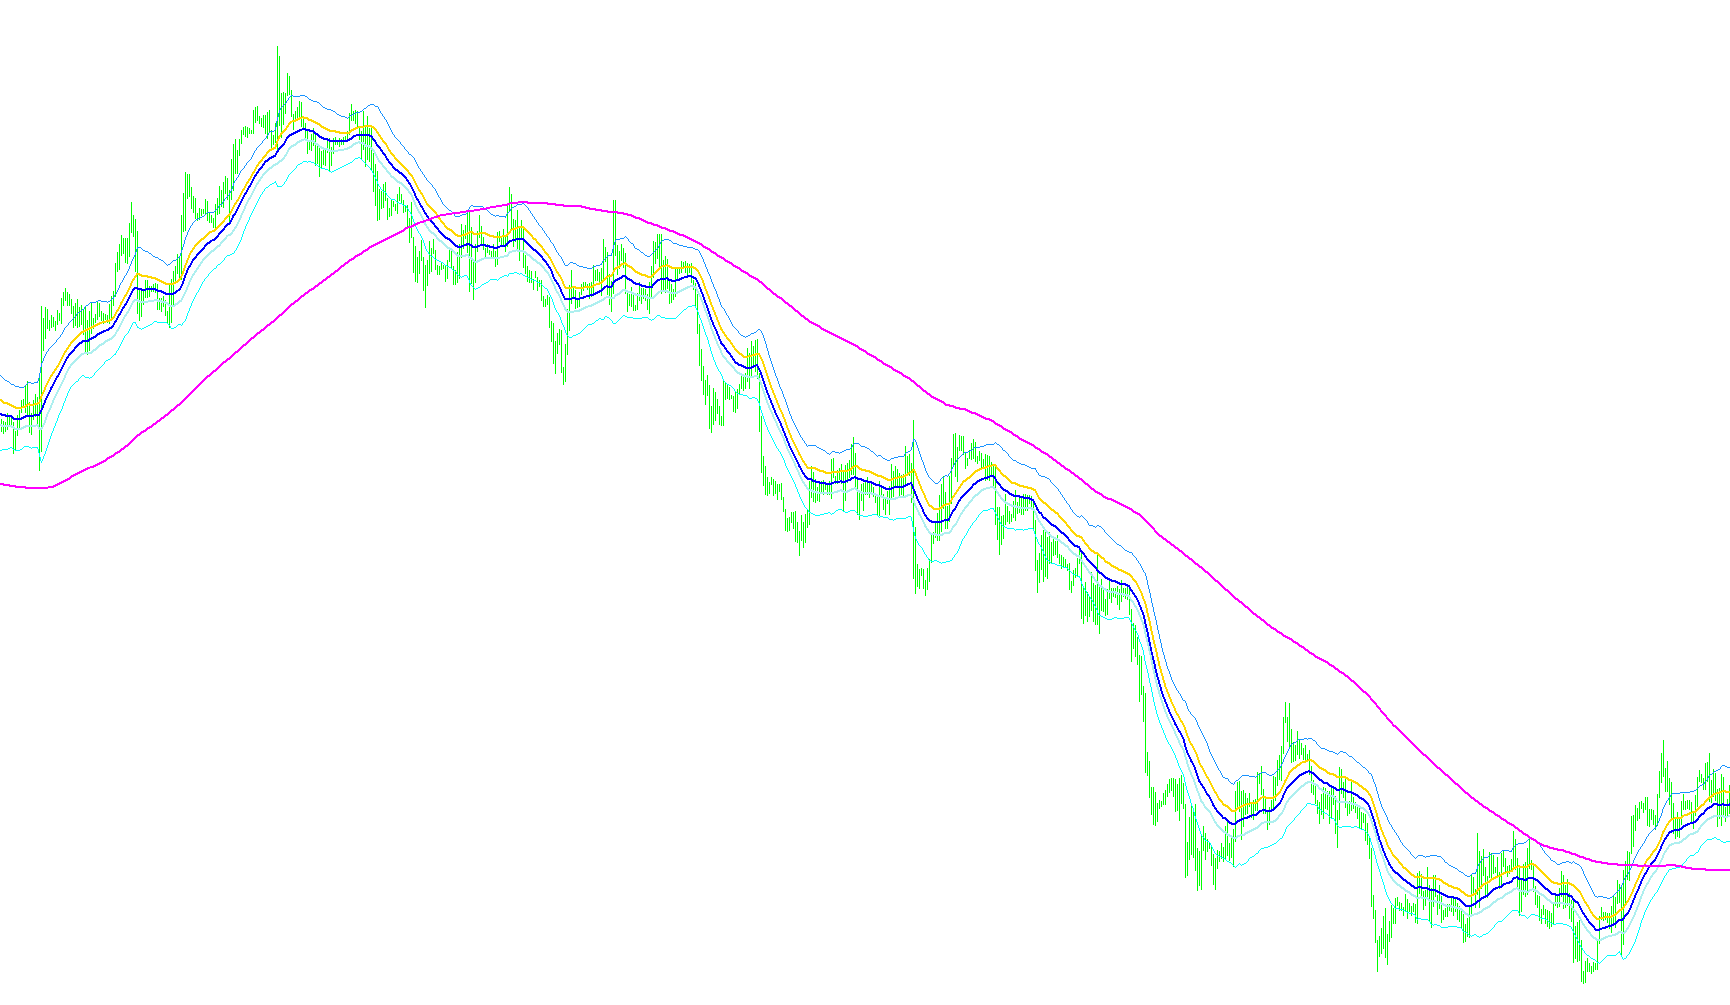
This tool is designed to help traders visualize price movements and identify specific structural shifts in the market. By analyzing historical price data, it creates a set of dynamic boundaries that help users distinguish between different phases of a trend.
Core Visual Components
The script calculates several moving averages to create a visual framework on your chart:
- The Moving Average Framework: It tracks three primary lines based on the High, Low, and Close prices over a 34-period window. These provide a smoothed view of where the price has recently been trading.
- The Trend Baseline: It includes a 200-period Simple Moving Average (SMA). This is commonly used by traders to identify the long-term "health" or direction of the market (e.g., whether the overall trend is bullish or bearish).
- Dynamic Boundaries: The script calculates a specific distance between the high and low averages. It then projects upper and lower boundaries based on this distance. These lines act as a "channel" or "zone," helping to define the current range of price action.
Operational Logic
The primary goal of the script is to detect crossovers—moments when the price moves from one side of these calculated boundaries to the other.
- Trend Identification: By constantly comparing the current closing price against the high and low moving averages, the script monitors for "breaks" in the current price structure.
- Crossing Notifications: When the price breaks through a specific boundary (for example, moving from above a high line to below it, or vice versa), the script identifies this as a potential change in market momentum.
- Alert System: The tool features an integrated alarm system. If the user enables alerts, the script will automatically notify them when these specific crossings occur. This allows traders to react quickly to structural shifts without having to watch the charts manually at all times.
Summary of Use
Essentially, this script filters out the "noise" of minor price fluctuations by focusing on smoothed averages. It helps the user visualize the boundaries of a market "wave," providing clear visual signals and audible alerts when the price decides to break out of its current range and enter a new phase.
//+------------------------------------------------------------------+
//|                                                 Raghee Vague.mq4 |
//|                            Copyright © 2009, Roman Robidet Burel |
//|    IF you find this Indicator/Code usefull and you want          |
//|                    donate something                              |
//|         YOU ARE WELCOME  PayPal : roman.robidet@hotmail.com      |
//|                                                                  |
//+------------------------------------------------------------------+
#property copyright "Copyright © 2009, Roman Robidet Burel"
#property link      "none"
#import "speak.dll"
void gRate(int rate);
void gVolume(int rate);
void gPitch(int rate);
void gSpeak(string text);
#import "Robidet_lib.ex4"
string divisa(string data1);

extern bool Alarm=false;
extern int timeframe=0;

#property indicator_chart_window
#property indicator_buffers 6
#property indicator_color1 MediumBlue
#property indicator_color2 Aqua
#property indicator_color3 OrangeRed
#property indicator_color4 Gray
#property indicator_color5 Gray
#property indicator_color6 Gold

#property indicator_width1 2
#property indicator_width2 2
#property indicator_width3 2
#property indicator_width4 1
#property indicator_width5 1
#property indicator_width6 2
//extern int EMIPeriod=14;

double HBuffer[];
double CBuffer[];
double LBuffer[];
double sma200[];
double upl[];
double dnl[];

int alarm1=0;
int alarm2=0;
int alarm3=0;
int alarm4=0;
double dist;
//+------------------------------------------------------------------+
//| Custom indicator initialization function                         |
//+------------------------------------------------------------------+
int init()
  {
//---- indicators
IndicatorBuffers(6);
SetIndexStyle(0,DRAW_LINE,EMPTY,2);
SetIndexStyle(1,DRAW_LINE,EMPTY,2);
SetIndexStyle(2,DRAW_LINE,EMPTY,2);
SetIndexStyle(3,DRAW_LINE,EMPTY,1);
SetIndexStyle(4,DRAW_LINE,EMPTY,1);
SetIndexStyle(5,DRAW_LINE,EMPTY,2);

SetIndexBuffer(0,HBuffer);
SetIndexBuffer(1,CBuffer);
SetIndexBuffer(2,LBuffer);
SetIndexBuffer(3,upl);
SetIndexBuffer(4,dnl);
SetIndexBuffer(5,sma200);

SetIndexLabel(0,"MM_High");
SetIndexLabel(1,"MM_Close");
SetIndexLabel(2,"MM_Low");
SetIndexLabel(3,"H_UP");
SetIndexLabel(4,"H_DOWN");
SetIndexLabel(5,"SMA200");

IndicatorShortName("Vagues de Raghee");


//----
   return(0);
  }
//+------------------------------------------------------------------+
//| Custom indicator deinitialization function                       |
//+------------------------------------------------------------------+
int deinit()
  {
//----

//----
   return(0);
  }
//+------------------------------------------------------------------+
//| Custom indicator iteration function                              |
//+------------------------------------------------------------------+
int start()
  {
      if (alarm1!=Bars) alarm1=0;
      if (alarm2!=Bars) alarm2=0;
      if (alarm3!=Bars) alarm3=0;
      if (alarm4!=Bars) alarm4=0;

      int limit;
      int counted_bars=IndicatorCounted();

     if(counted_bars<0) return(-1);

     if(counted_bars>0) counted_bars--;
     limit=Bars-counted_bars;


//-- main loop

   for(int i=0; i<limit; i++)
   {
      HBuffer[i]=iMA(Symbol(),timeframe,34,0,MODE_EMA,PRICE_HIGH,i);
      CBuffer[i]=iMA(Symbol(),timeframe,34,0,MODE_EMA,PRICE_CLOSE,i);
      LBuffer[i]=iMA(Symbol(),timeframe,34,0,MODE_EMA,PRICE_LOW,i);
      sma200[i]=iMA(Symbol(),timeframe,200,0,MODE_SMA,PRICE_CLOSE,i);

      dist= HBuffer[i] - LBuffer[i];
      upl[i]=iMA(Symbol(),timeframe,34,0,MODE_EMA,PRICE_HIGH,i) + dist;
      dnl[i]=iMA(Symbol(),timeframe,34,0,MODE_EMA,PRICE_LOW,i)  - dist;

   }
   if(Alarm==true){


         if(iClose(Symbol(),timeframe,1)>HBuffer[1] && iClose(Symbol(),timeframe,0)<HBuffer[0] &&  alarm1==0)
         {
            Alert(Symbol()," - ",Period()," Minutes , >> Price Crossing Down MM32_High");
            alarm1=Bars;
         }
         if(iClose(Symbol(),timeframe,1)<LBuffer[1] && iClose(Symbol(),timeframe,0)>LBuffer[0] &&  alarm2==0)
         {
            Alert(Symbol()," - ",Period()," Minutes , >> Price Crossing Up MM32_Low");
            alarm2=Bars;
         }

         if(iClose(Symbol(),timeframe,1)>LBuffer[1] && iClose(Symbol(),timeframe,0)<LBuffer[0] &&  alarm3==0) {
            Alert (Symbol()+", periodo "+Period()+", Cruze de ola Inferior ");
            alarm3=Bars;
            }
         if(iClose(Symbol(),timeframe,1)<HBuffer[1] && iClose(Symbol(),timeframe,0)>HBuffer[0] &&  alarm4==0) {
            Alert(Symbol()+", periodo "+Period()+", Cruze de ola Superior");
            alarm4=Bars;
            }
               }
//----

//----
   return(0);
  }
//+------------------------------------------------------------------+
Comments