QEMA
Download script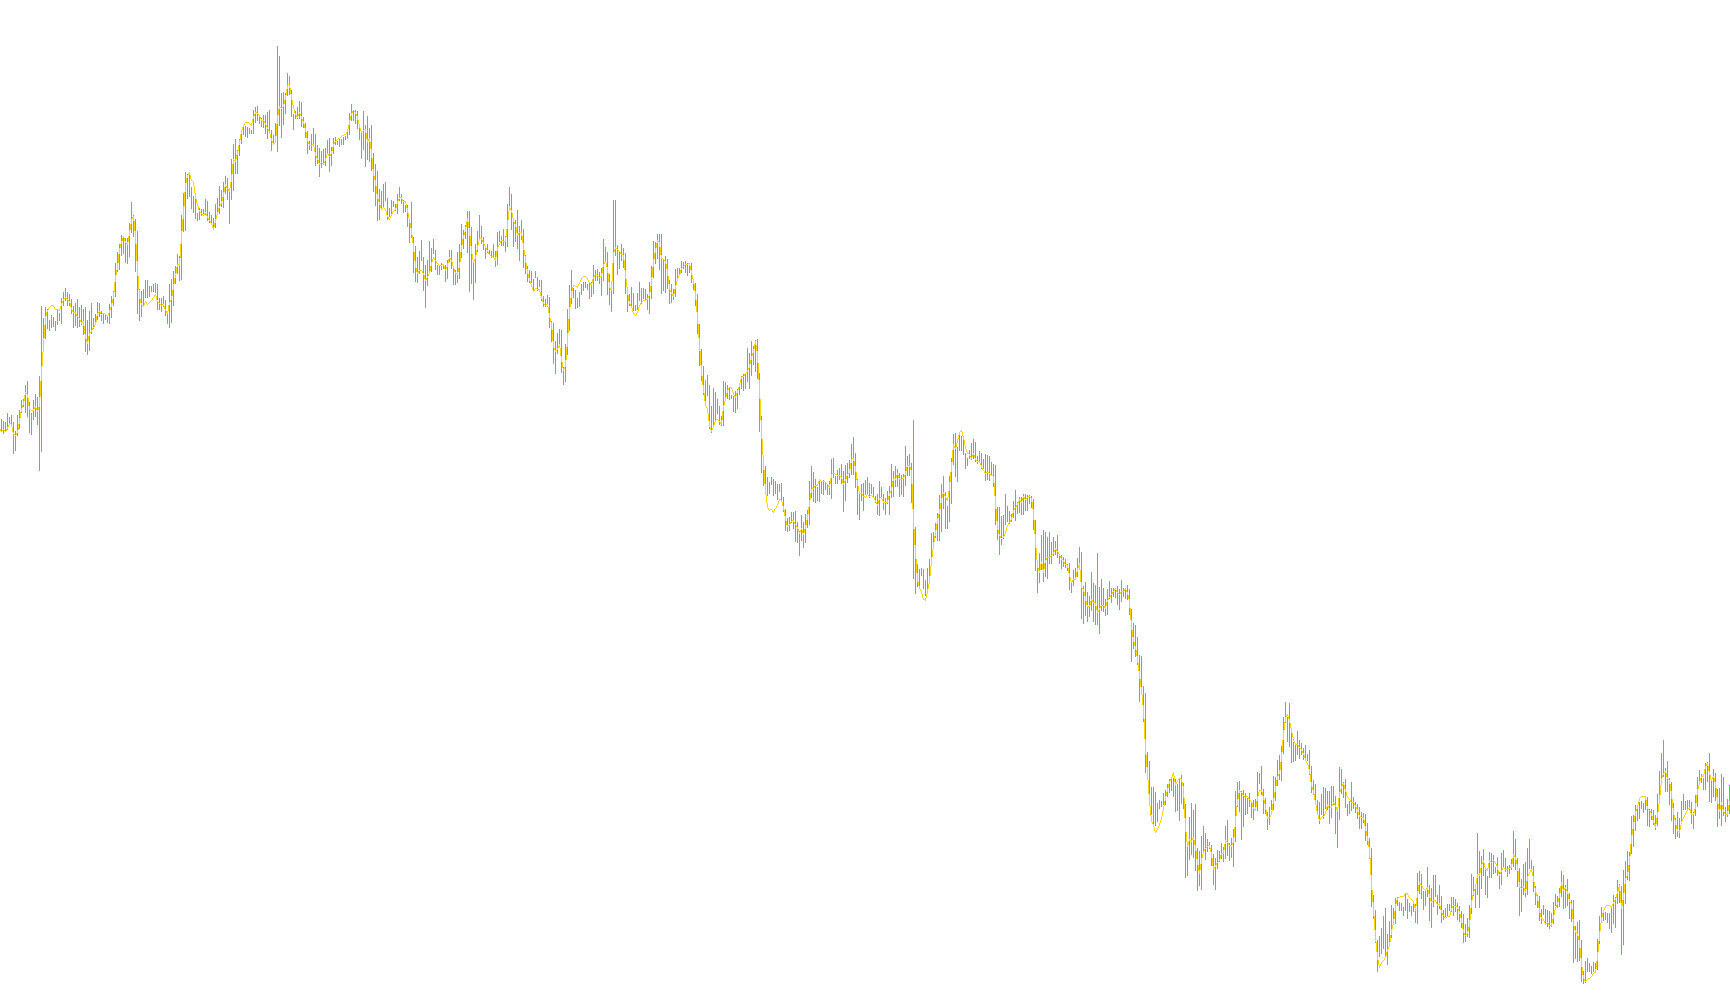
This tool is a sophisticated technical analysis indicator designed to smooth out market price fluctuations and identify underlying trends more clearly. Rather than reacting to every minor "zig" and "zag" in the price chart, it uses a multi-layered mathematical approach to filter out market noise.
How the Logic Works
The core logic of this script relies on a process called "nested smoothing." It works through the following stages:
1. Sequential Layering The script begins by calculating a standard Exponential Moving Average (EMA), which is a common way to track price trends. However, instead of stopping there, it takes that average and calculates another average on top of it. It repeats this process five times in succession. Think of this like filtering water through five different layers of increasingly fine mesh; each layer removes more "sediment" (market noise) while preserving the main flow of the data.
2. Data Synthesis By calculating these five distinct layers, the script creates a deep history of smoothed data points. This allows the tool to "see" deeper into the market's momentum than a single average line could ever provide.
3. Weighted Calculation (The QEMA Formula) The final result—the "QEMA" line you see on your chart—is not just one of those five layers. Instead, the script applies a specific mathematical weight to each of the five layers simultaneously.
By combining these layers using specific multipliers (adding some and subtracting others), the script balances out the data:
- It incorporates the immediate trends from the earlier layers.
- It uses the deeper, more stabilized trends from the final layers to ensure the line doesn't overreact to sudden spikes.
- The resulting line provides a refined, balanced view of price momentum that aims to stay closer to the "true" trend of the market.
Summary for the User
Essentially, this script acts as a high-precision stabilizer. It takes the raw, chaotic price movement of the market and puts it through five stages of refinement before displaying the final line. The goal is to provide you with a smoother, more reliable visual cue that helps distinguish long-term trends from temporary market volatility.
//+------------------------------------------------------------------+
//|                                                         QEMA.mq4 |
//+------------------------------------------------------------------+
#property copyright "Bruno Pio"

#property indicator_chart_window
#property indicator_buffers 1
#property indicator_color1 Red
#property  indicator_width1  2
//---- input parameters
extern int       EMA_period=14;
//---- buffers
double QemaBuffer[];
double Ema[];
double EmaOfEma[];
double EmaOfEmaOfEma[];
double EmaOfEmaOfEmaOfEma[];
double EmaOfEmaOfEmaOfEmaOfEma[];
//+------------------------------------------------------------------+
//| Custom indicator initialization function                         |
//+------------------------------------------------------------------+
int init()
  {
//---- indicators
   IndicatorBuffers(6);
   SetIndexStyle(0,DRAW_LINE);
   SetIndexBuffer(0,QemaBuffer);
   SetIndexBuffer(1,Ema);
   SetIndexBuffer(2,EmaOfEma);
   SetIndexBuffer(3,EmaOfEmaOfEma);
   SetIndexBuffer(4,EmaOfEmaOfEmaOfEma);
   SetIndexBuffer(5,EmaOfEmaOfEmaOfEmaOfEma);

   IndicatorShortName("QEMA("+EMA_period+")");

//----
   return(0);
  }
//+------------------------------------------------------------------+
//| Custom indicator deinitialization function                       |
//+------------------------------------------------------------------+
int deinit()
  {
//----

//----
   return(0);
  }
//+------------------------------------------------------------------+
//| Custom indicator iteration function                              |
//+------------------------------------------------------------------+
int start()
  {
   int i,limit,limit2,limit3,limit4,limit5,counted_bars=IndicatorCounted();
//----
   if (counted_bars==0)
      {
      limit=Bars-1;
      limit2=limit-EMA_period;
      limit3=limit2-EMA_period;
      limit4=limit3-EMA_period;
      limit5=limit4-EMA_period;
      }
   if (counted_bars>0)
      {
      limit=Bars-counted_bars-1;
      limit2=limit;
      limit3=limit2;
      limit4=limit3;
      limit5=limit4;
      }
   for (i=limit;i>=0;i--) Ema[i]=iMA(NULL,0,EMA_period,0,MODE_EMA,PRICE_CLOSE,i);
   for (i=limit2;i>=0;i--) EmaOfEma[i]=iMAOnArray(Ema,0,EMA_period,0,MODE_EMA,i);
   for (i=limit3;i>=0;i--) EmaOfEmaOfEma[i]=iMAOnArray(EmaOfEma,0,EMA_period,0,MODE_EMA,i);
   for (i=limit4;i>=0;i--) EmaOfEmaOfEmaOfEma[i]=iMAOnArray(EmaOfEmaOfEma,0,EMA_period,0,MODE_EMA,i);
   for (i=limit5;i>=0;i--) EmaOfEmaOfEmaOfEmaOfEma[i]=iMAOnArray(EmaOfEmaOfEmaOfEma,0,EMA_period,0,MODE_EMA,i);


   for (i=limit5;i>=0;i--) QemaBuffer[i]=5*Ema[i]-10*EmaOfEma[i]+10*EmaOfEmaOfEma[i]-5*EmaOfEmaOfEmaOfEma[i]+EmaOfEmaOfEmaOfEmaOfEma[i];
//----
   return(0);
  }
//+------------------------------------------------------------------+
Comments