RagheeCandleVagueBars
Download script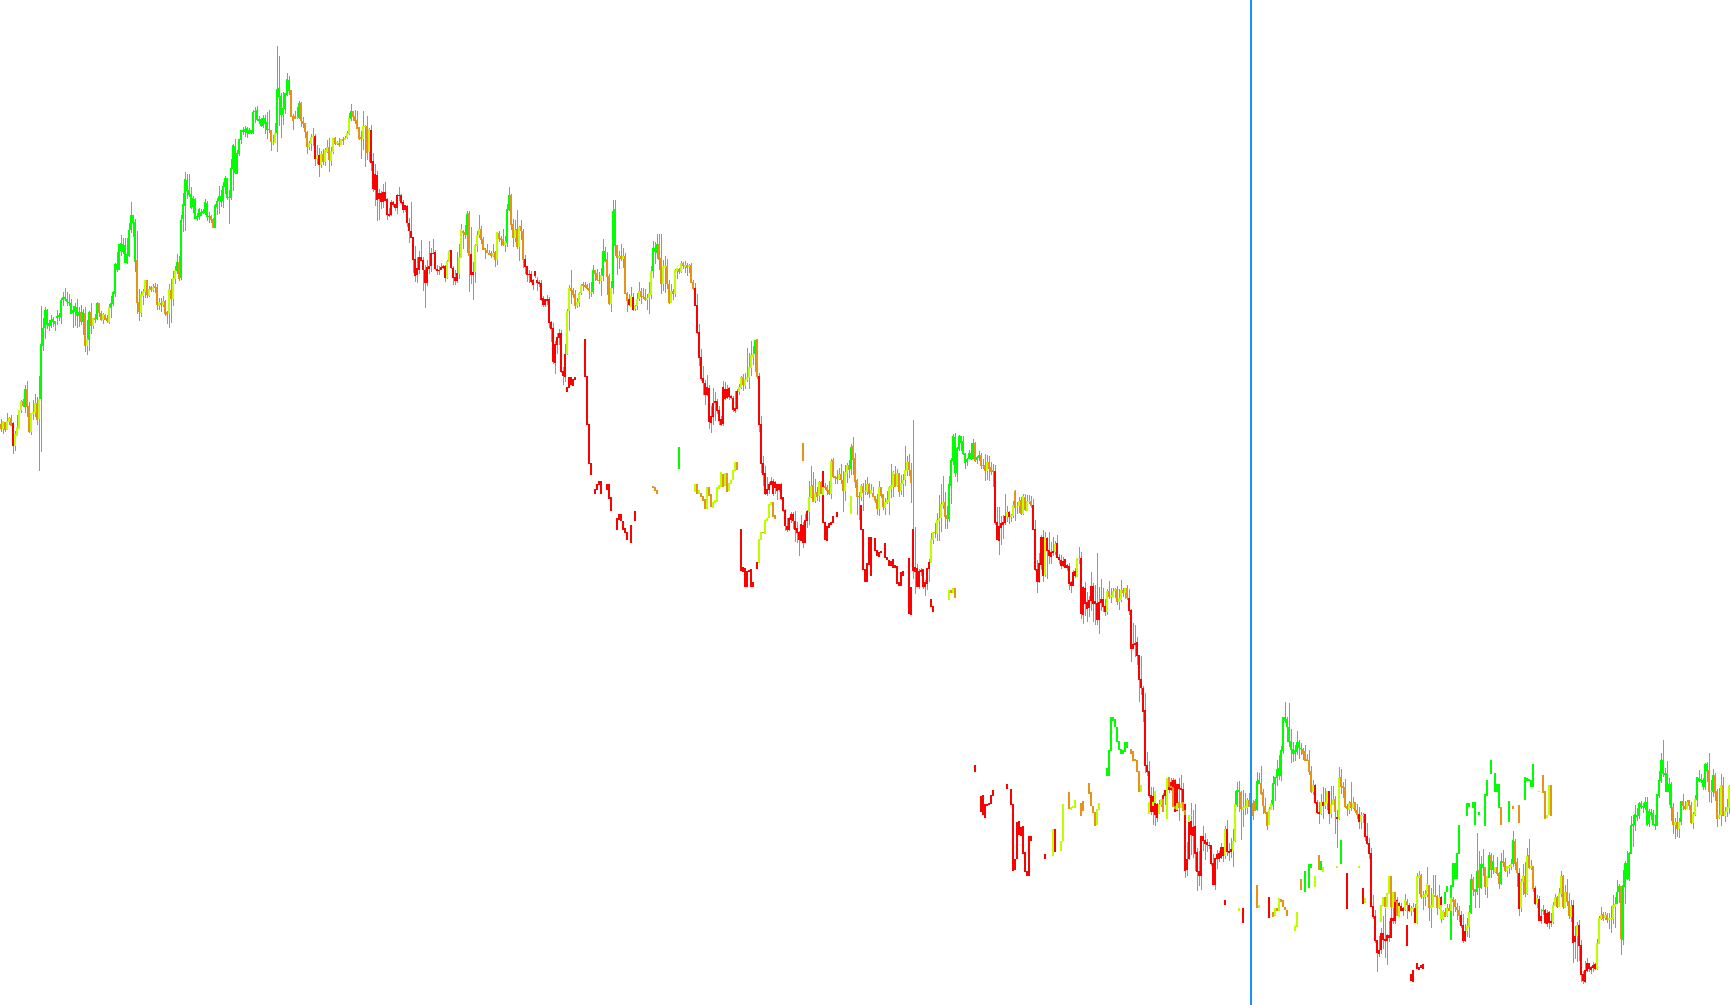
This indicator is designed to analyze price momentum by measuring the specific angle of movement in a financial market. It essentially seeks to distinguish between strong, directional trends and periods of "vague" or sideways price action.
Core Logic and Mechanics
The tool operates by calculating the slope of a moving average (specifically an Exponential Moving Average) over a set period. By measuring the rate of change between the current price point and previous points, it determines the "Angle" of the trend.
To ensure accuracy across different types of assets (like Forex, Stocks, or Commodities), the script uses a scaling factor. This normalizes the data so that the visual angle represents the true strength of the movement relative to the market's price volatility.
How the Indicator Categorizes Market Movement
The script evaluates every candle on your chart and categorizes it into one of three distinct behaviors based on the calculated angle:
- Strong Downward Trend: If the calculated angle is significantly sharp and pointing downwards (falling below a user-defined "Low Angle" threshold), the indicator identifies a bearish trend. It marks the high and low boundaries of these candles to highlight downward pressure.
- Strong Upward Trend: If the angle is sharply positive (exceeding a user-defined "High Angle" threshold), the indicator identifies a bullish trend. It captures the price boundaries of these candles to highlight upward momentum.
- Vague or Neutral Movement: If the angle falls between the high and low thresholds, it means the price is moving relatively flat or lacks a strong directional push. In these instances, the script identifies these as "vague" bars, essentially filtering out market noise where there is no clear trend.
Visual Representation
The indicator communicates this data using four distinct visual buffers (histograms) on your chart:
- Down Trends: Highlights significant bearish movement.
- Up Trends: Highlights significant bullish movement.
- Neutral Down: Identifies vague price action with a downward lean.
- Neutral Up: Identifies vague price action with an upward lean.
Timeframe Awareness
The script also includes a "lookback" feature that automatically detects the current timeframe you are viewing (such as Daily, 4-hour, or 1-hour charts). It places a visual vertical line on the chart to mark a specific historical point relevant to that timeframe, helping traders maintain a sense of perspective over longer periods of market history.
//+------------------------------------------------------------------+
//|                                       RagheeCandleVagueBars .mq4 |
//|                            Copyright © 2009, Roman Robidet Burel |
//|    IF you find this Indicator/Code usefull and you want          |
//|                    donate something                              |
//|         YOU ARE WELCOME  PayPal : roman.robidet@hotmail.com      |
//|                                                                  |
//+------------------------------------------------------------------+
#property copyright "RagheeCandleVagueBars Copyright © 2009, Roman Robidet Burel"
#property link      "none"

#property indicator_chart_window
//#property  indicator_separate_window
#property indicator_buffers 4
//#property indicator_color1 Red
#property indicator_width1 2
//#property indicator_color2 Chartreuse
#property indicator_width2 2
//#property indicator_color3 Tan
#property indicator_width3 2
//#property indicator_color4 DarkOliveGreen
#property indicator_width4 2
#import "stdlib.ex4"
int RGB(int red_value,int green_value,int blue_value);

extern double HighAngle=30;
extern double LowAngle=-30;

double DnTrend[];
double UpTrend[];
double buff3[];
double buff4[];
double XScale;
int ExtCountedBars=0;
datetime inicio;
bool First=true;
//+------------------------------------------------------------------+
//| Custom indicator initialization function                         |
//+------------------------------------------------------------------+
int init()
  {
//---- indicators
   //SetIndexStyle(0,DRAW_LINE,EMPTY,2,Red);
   int rouge     =RGB(255,0,0);
   int chartr  =RGB(187,255,0);
   int orange    =RGB(227,147,27);
   //int ver       =RGB(63,158,76);
   int ver       =RGB(0,255,0);


   SetIndexStyle(0, DRAW_HISTOGRAM, 0, 2, rouge);
   SetIndexStyle(1, DRAW_HISTOGRAM, 0, 2, ver);
   SetIndexStyle(2, DRAW_HISTOGRAM, 0, 2, orange);
   SetIndexStyle(3, DRAW_HISTOGRAM, 0, 2, chartr);
   SetIndexBuffer(0, DnTrend);
   SetIndexBuffer(1, UpTrend);
   SetIndexBuffer(2, buff3);
   SetIndexBuffer(3, buff4);
   SetIndexLabel(0,"Dn Ragheebars");
   SetIndexLabel(1,"UP Ragheebars");
   SetIndexLabel(2,"neutre_Dn Ragheebars");
   SetIndexLabel(3,"neutre_Up Ragheebars");
   inicio=TimeLocal();
   First=true;
//----
   return(0);
  }
//+------------------------------------------------------------------+
//| Custom indicator deinitialization function                       |
//+------------------------------------------------------------------+
int deinit()
  {
//----

//----
   return(0);
  }
//+------------------------------------------------------------------+
//| Custom indicator iteration function                              |
//+------------------------------------------------------------------+
int start()
  {
  XScale=MarketInfo(Symbol(),MODE_TICKVALUE)*MarketInfo(Symbol(),MODE_TICKSIZE)*10;
  if (XScale==0) return(0);
   //Comment("inicio= "+inicio+"  inicio+ 20="+(inicio+20)+"  timelocal="+TimeLocal());
   int  pos;
   RefreshRates();
   double Angle;
   if(Bars <= 10)
       return(0);
   ExtCountedBars = IndicatorCounted();
//---- check for possible errors
   if(ExtCountedBars < 0)
       return(-1);
//---- last counted bar will be recounted
   if(ExtCountedBars > 0)
       ExtCountedBars--;
   if (First==true) {
      pos = Bars;// + 25;
      First=false;
      }
   else if   (First==false)  {
     pos = Bars - ExtCountedBars;// + 25;
     }


   //int pos=Bars;
  // if (inicio==Bars+2) pos= Bars;
  // if (TimeLocal()>=(inicio+300) && TimeLocal()<=(inicio+600)) pos=Bars;


   //if (  (TimeLocal()> inicio + 40)  && (TimeLocal()<inicio +55) ) pos=Bars-1;
   lookback();
    WindowRedraw();
   while(pos >= 0)
     {

    double RV1=iMA(Symbol(),0,34,0,MODE_EMA,PRICE_CLOSE,pos+1);
    double RV2=iMA(Symbol(),0,34,0,MODE_EMA,PRICE_CLOSE,pos);
    //XScale=MarketInfo(Symbol(),MODE_TICKVALUE)*MarketInfo(Symbol(),MODE_TICKSIZE)*10;
    //if (XScale==0) XScale=1;
   // while(XScale==0){
   //            XScale=MarketInfo(Symbol(),MODE_TICKVALUE)*MarketInfo(Symbol(),MODE_TICKSIZE)*10;
   //            }
    Angle=MathArctan( (RV2-RV1)/XScale  )/3.1415965*180;


    if (  MathAbs(Angle)<=HighAngle ) {

    buff3[pos] =Open[pos];
    buff4[pos] =Close[pos];
    }
    else if (Angle<LowAngle ){

            if (Open[pos]>Close[pos]) {
                     DnTrend[pos] = Open[pos];
                     UpTrend[pos] =Close[pos];
                     }
            else   {
                     DnTrend[pos] =Close[pos];
                     UpTrend[pos] =Open[pos];
                   }
    }
    else if (Angle>HighAngle ){
            if (Open[pos]<Close[pos]) {
                     DnTrend[pos] = Open[pos];
                     UpTrend[pos] =Close[pos];
                     }
            else   {
                     DnTrend[pos] =Close[pos];
                     UpTrend[pos] =Open[pos];
                   }
    }
 	     pos--;
     }

//----
   return(0);
  }
//+------------------------------------------------------------------+

void lookback(){

int Periodo=Period();
double PosL;
if (Periodo==1440) PosL=240; //D1  Daily
else if (Periodo==240) PosL=120; // H4  4 hours
else if (Periodo==180) PosL=160; // H3
else if (Periodo==60) PosL=240; // H1 1 hours
else if (Periodo==30) PosL=480; // M30  30 minutes
else if (Periodo==15) PosL=480; // M15  15 minutes
else if (Periodo==5 || Periodo==1) return(-1);

if (ObjectFind("lookback")!=-1) ObjectDelete("lookback");
ObjectCreate("lookback",OBJ_VLINE,0,iTime(Symbol(),0,PosL),0);
//ObjectCreate("lookback",OBJ_VLINE,0,10);
ObjectSet("lookback",OBJPROP_WIDTH,2);
ObjectSet("lookback",OBJPROP_COLOR,DodgerBlue);

return(0);
}
Comments