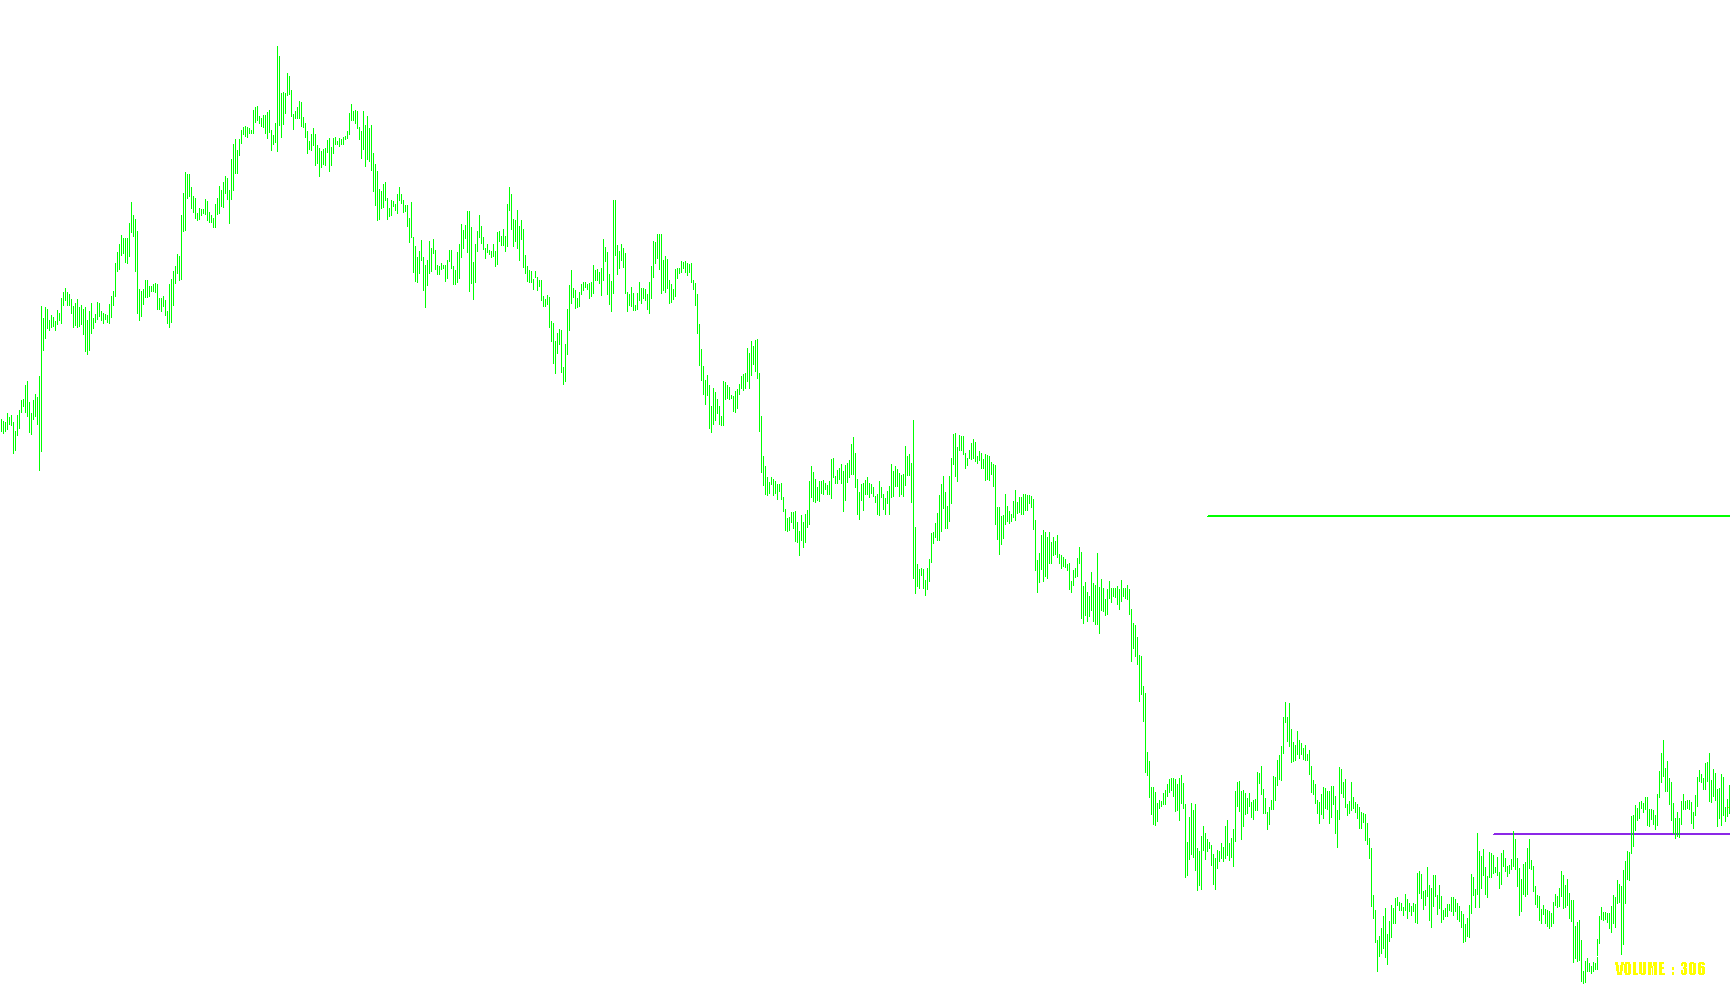
This tool is designed to provide traders with a visual roadmap of key price levels across multiple timeframes simultaneously. By calculating "Pivot Points," it helps identify significant areas of support and resistance, allowing you to see where the market might react or reverse based on historical data.
Core Functionality
The script automatically identifies and draws horizontal reference lines for five different trading periods:
- Hourly (H1)
- 4-Hour (H4)
- Daily (D1)
- Weekly (W1)
- Monthly (M1)
How the Logic Works
For every time period listed above, the script performs a specific mathematical calculation to find the "Pivot" price. It looks at the previous completed candle for that timeframe and gathers four key pieces of information:
- The Highest price reached.
- The Lowest price reached.
- The Opening price.
- The Closing price.
The script then calculates the average of these four values (the mean). This resulting price is plotted on your chart as a dotted line. By seeing these lines together, you can identify "confluence"—moments where an hourly pivot aligns with a daily or weekly pivot—which often indicates a very strong market turning point.
Visual Presentation
To keep the chart clean and easy to read, the tool includes several automated features:
- Dynamic Drawing: The script automatically creates these lines on your chart and clears old data to ensure you are always looking at current, relevant information.
- Color Coding: Each timeframe is assigned a unique color (such as Gold, Silver, White, BlueViolet, and Lime), making it easy to distinguish between short-term and long-term levels at a glance.
- Volume Tracking: In addition to the pivot lines, the script includes an information display on the screen that calculates the price range (volatility) of the current daily candle. This provides a quick snapshot of how much movement is occurring in the market over the last 24 hours.
Summary for the User
Essentially, this script acts as an automated technical analyst. It does the "heavy lifting" of calculating complex averages across different timeframes and draws them on your screen instantly. This allows you to focus on making trading decisions rather than manually calculating price levels.
//+------------------------------------------------------------------+
//|                                                   Pivot Only.mq4 |
//|                                                                  |
//|                                                                  |
//+------------------------------------------------------------------+
#property indicator_chart_window
#property link "http://free-bonus-deposit.blogspot.co.id/"

extern color PivH1 = clrSilver;
extern int   width1=1;
extern color PivH4 = clrGold;
extern int   width2=1;
extern color PivD1 = clrWhite;
extern int   width3=1;
extern color PivW1 = clrBlueViolet;
extern int   width4=2;
extern color PivM1 = clrLime;
extern int   width5=2;

string Name;
//+------------------------------------------------------------------+
//|                                                                  |
//+------------------------------------------------------------------+
int init()
  {
   return(0);
  }
//+------------------------------------------------------------------+
//|                                                                  |
//+------------------------------------------------------------------+
int deinit()
  {

   ObjectDelete("PivotH1");
   ObjectDelete("PivotH4");
   ObjectDelete("PivotDay");
   ObjectDelete("PivotWeek");
   ObjectDelete("PivotMonth");

   return(0);
  }
//+------------------------------------------------------------------+
//|                                                                  |
//+------------------------------------------------------------------+
int start()
  {
   ObjectDelete("PivotH1");
   ObjectDelete("PivotH4");
   ObjectDelete("PivotDay");
   ObjectDelete("PivotWeek");
   ObjectDelete("PivotMonth");

   datetime timeP=iTime(Symbol(),60,1);
   double OH1=iOpen(Symbol(),60,1);
   double CH1=iClose(Symbol(),60,1);
   double HH1=iHigh(Symbol(),60,1);
   double LH1=iLow(Symbol(),60,1);
   double pivH1=(OH1+CH1+HH1+LH1)/4;
   draw("PivotH1",timeP,pivH1,PivH1,width1);

   timeP=iTime(Symbol(),240,0);
   double OH4=iOpen(Symbol(),240,1);
   double CH4=iClose(Symbol(),240,1);
   double HH4=iHigh(Symbol(),240,1);
   double LH4=iLow(Symbol(),240,1);
   double pivH4=(OH4+CH4+HH4+LH4)/4;
   draw("PivotH4",timeP,pivH4,PivH4,width2);

   timeP=iTime(Symbol(),1440,0);
   double OD=iOpen(Symbol(),1440,1);
   double CD=iClose(Symbol(),1440,1);
   double HD=iHigh(Symbol(),1440,1);
   double LD=iLow(Symbol(),1440,1);
   double pivD=(OD+CD+HD+LD)/4;
   draw("PivotDay",timeP,pivD,PivD1,width3);

   timeP=iTime(Symbol(),10080,0);
   double OW=iOpen(Symbol(),10080,1);
   double CW=iClose(Symbol(),10080,1);
   double HW=iHigh(Symbol(),10080,1);
   double LW=iLow(Symbol(),10080,1);
   double pivW=(OW+CW+HW+LW)/4;
   draw("PivotWeek",timeP,pivW,PivW1,width4);

   timeP=iTime(Symbol(),43200,0);
   double OM=iOpen(Symbol(),43200,1);
   double CM=iClose(Symbol(),43200,1);
   double HM=iHigh(Symbol(),43200,1);
   double LM=iLow(Symbol(),43200,1);
   double pivM=(OM+CM+HM+LM)/4;
   draw("PivotMonth",timeP,pivM,PivM1,width5);

   dpkfx();

   return(0);
  }
//+------------------------------------------------------------------+
//|                                                                  |
//+------------------------------------------------------------------+
void draw(string Line,int TimeStart,double Price,color line_clr,int line_width)
  {
   ObjectCreate(Line,OBJ_TREND,0,TimeStart,Price,CurTime(),Price);
   ObjectSet(Line,OBJPROP_COLOR,line_clr);
   ObjectSet(Line,OBJPROP_STYLE,STYLE_DOT);
   ObjectSet(Line,OBJPROP_WIDTH,line_width);
   ObjectSet(Line,OBJPROP_BACK,True);
  }
//+------------------------------------------------------------------+
//|                                                                  |
//+------------------------------------------------------------------+
void dpkfx()
  {
   int ipos=3;
   int xpos=30;

   double vol=(iHigh(Symbol(),1440,0)-iLow(Symbol(),1440,0))/Point;

   int st=1;
   stats("line","----------------------------",9,"Arial",White,ipos,xpos-1,45);
   stats("dpkforex","VOLUME  :  "+DoubleToStr(vol,0),12,"Impact",Yellow,ipos,xpos,30);
   stats("line2","----------------------------",9,"Arial",White,ipos,xpos-1,21);
  }
//+------------------------------------------------------------------+
//|                                                                  |
//+------------------------------------------------------------------+
void stats(string tname,string word,int fsize,string ftype,color tcolor,int posxy,int posx,int posy)
  {
   ObjectCreate(tname,OBJ_LABEL,0,0,0);
   ObjectSetText(tname,word,fsize,ftype,tcolor);
   ObjectSet(tname,OBJPROP_CORNER,posxy);
   ObjectSet(tname,OBJPROP_XDISTANCE,posx);
   ObjectSet(tname,OBJPROP_YDISTANCE,posy);
  }
//+------------------------------------------------------------------+
Comments