profit
Download script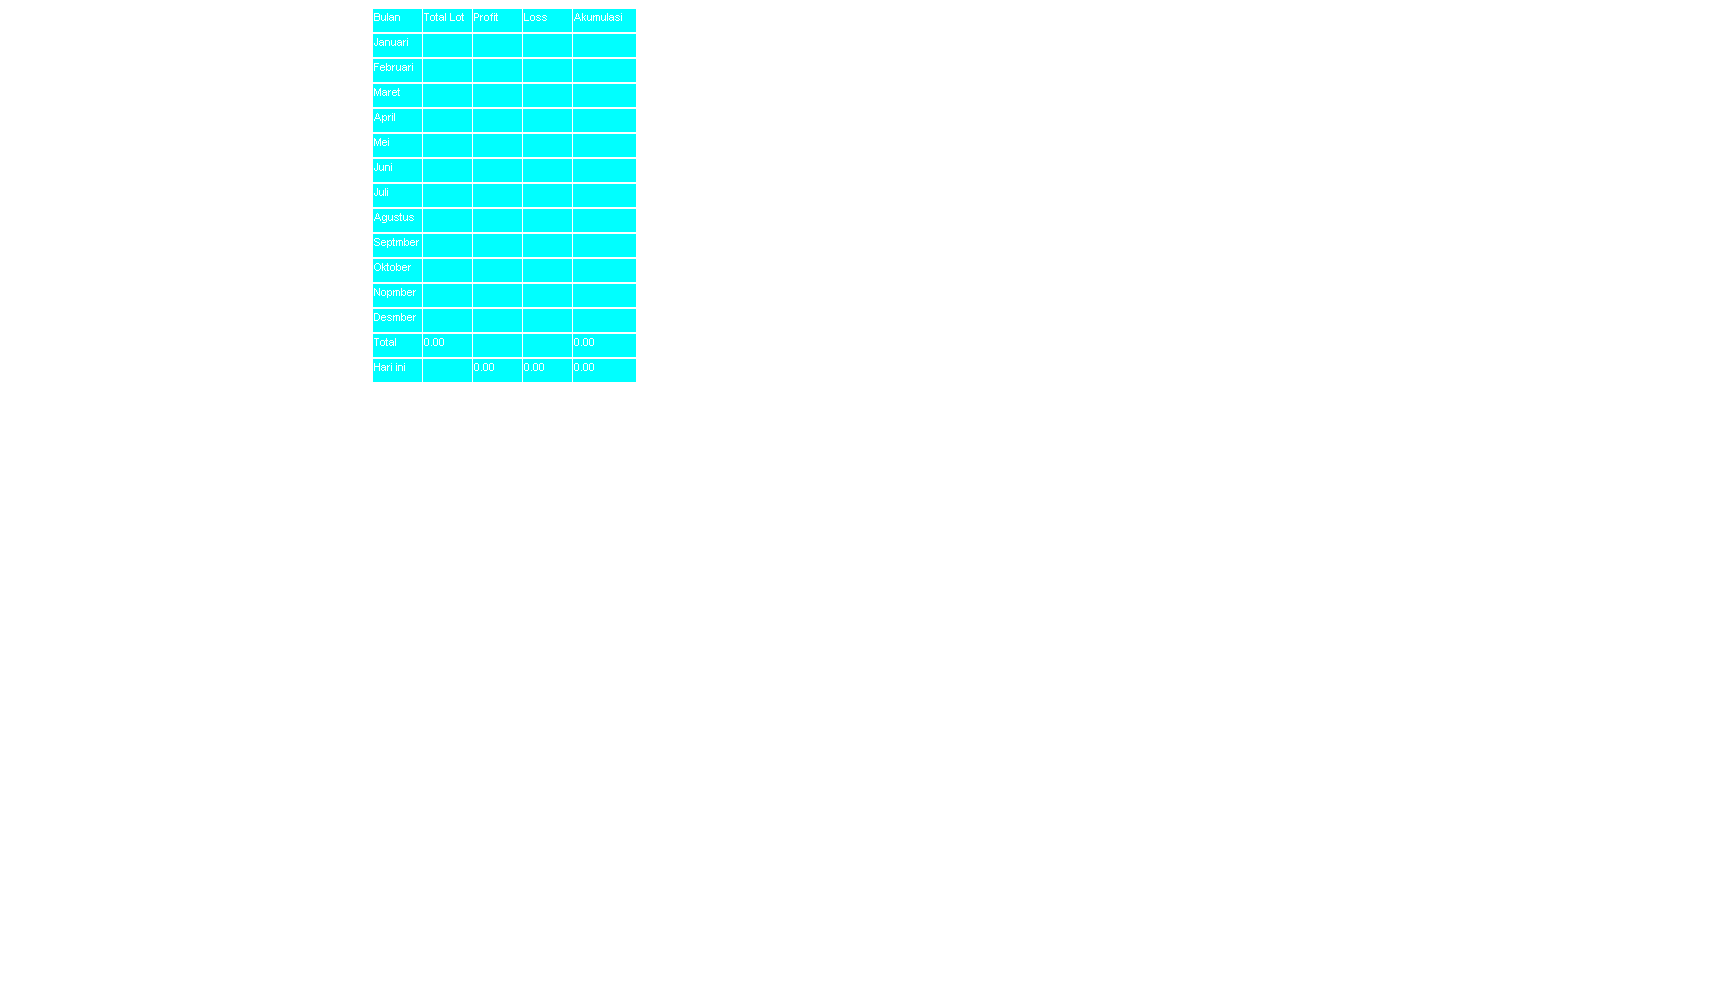
This script is designed as a performance dashboard for MetaTrader 4. Its primary purpose is to automatically scan your trading history and display a structured, visual summary of your profits, losses, and trading volumes directly on your chart screen.
Here is a breakdown of how the logic works:
Data Collection & Analysis
The script begins by scanning through your entire trading account history. It filters this data based on three specific criteria:
- The Year: It only looks for trades that were closed during a specific year (which you can set in the settings).
- Trade Type: It considers both "Buy" and "Sell" positions.
- Time Period: It organizes every trade into its respective month (January through December).
What it Calculates
For every month identified in your history, the script calculates four key pieces of information:
- Total Lot Size: The cumulative volume of all trades executed.
- Gross Profit: The total amount gained from winning trades.
- Gross Loss: The total amount lost from losing trades.
- Net Accumulation: The final balance (Profit minus Loss) for that specific month.
Real-Time Tracking
Beyond the monthly summary, the script includes "Live" tracking for the current day. It isolates trades closed on the current calendar day and calculates:
- Today's Profit
- Today's Loss
- Today's Net Total
Visual Presentation
Instead of showing you a list of raw numbers in a separate window, the script creates an organized "Panel" on your main trading chart.
- Dynamic UI: It automatically draws a grid of labels and background boxes to create a clean, professional table layout.
- Automatic Formatting: If a month has no trading activity, the script is programmed to leave that section blank rather than displaying confusing zeros.
- Total Summary: At the bottom of the generated table, it provides a "Grand Total" row, aggregating the volume and net profit for the entire year at a glance.
User Experience
The logic is designed to give a trader an immediate "at-a-glance" view of their consistency. By looking at the panel, you can quickly see which months were your most productive, how much total volume you moved throughout the year, and exactly how your performance is trending on the current day.
//+------------------------------------------------------------------+
//|                                                       profit.mq4 |
//|                                                            Kabul |
//|                                               panji_xx@yahoo.com |
//+------------------------------------------------------------------+
#property copyright "Kabul"
#property link      "panji_xx@yahoo.com"
#property version   "1.00"
#property strict
#property indicator_chart_window

extern int Tahun=2015;
extern int x_axis=375;
extern int y_axis=10;
extern color BackGrnCol=clrAqua;
extern color LineColor=clrBlack;
extern color TextColor=clrBlack;

string txt[15][5];

//+------------------------------------------------------------------+
//| Custom indicator initialization function                         |
//+------------------------------------------------------------------+
int OnInit()
  {
//--- indicator buffers mapping
      EventSetTimer(1);
//---
   return(INIT_SUCCEEDED);
  }
//+------------------------------------------------------------------+
//| Custom indicator iteration function                              |
//+------------------------------------------------------------------+
int start()
  {

     string v[13];
     v[1]="Januari";
     v[2]="Februari";
     v[3]="Maret";
     v[4]="April";
     v[5]="Mei";
     v[6]="Juni";
     v[7]="Juli";
     v[8]="Agustus";
     v[9]="Septmber";
     v[10]="Oktober";
     v[11]="Nopmber";
     v[12]="Desmber";
     double ttllot[13],prof[13],loss[13],akum[13],total,jumlot,prhrini,lshrini,akumhrini;
     int hist,bulan,j,i;
     hist=OrdersHistoryTotal();
     total=0.0;
     jumlot=0.0;
     ArrayFill(ttllot,0,13,0.0);
     ArrayFill(prof,0,13,0.0);
     ArrayFill(loss,0,13,0.0);
     ArrayFill(akum,0,13,0.0);
     prhrini=0.0;
     lshrini=0.0;
     akumhrini=0.0;

     for (j=0;j<hist;j++)
      {
        if (OrderSelect(j,SELECT_BY_POS,MODE_HISTORY))
         {
           if ((TimeYear(OrderCloseTime())==Tahun)&&((OrderType()==OP_BUY)||(OrderType()==OP_SELL)))
            {
              bulan=TimeMonth(OrderCloseTime());
              if (OrderProfit()>0)
               {
                 prof[bulan]=prof[bulan]+OrderProfit();
                 ttllot[bulan]=ttllot[bulan]+OrderLots();
                 if ((TimeDay(OrderCloseTime())==TimeDay(TimeCurrent()))&&
                    (TimeMonth(OrderCloseTime())==TimeMonth(TimeCurrent())))
                  {prhrini=prhrini+OrderProfit();}
               }
               else
               {
                 loss[bulan]=loss[bulan]+OrderProfit();
                 ttllot[bulan]=ttllot[bulan]+OrderLots();
                 if ((TimeDay(OrderCloseTime())==TimeDay(TimeCurrent())) &&
                    (TimeMonth(OrderCloseTime())==TimeMonth(TimeCurrent())))
                  {lshrini=lshrini+OrderProfit();}
               }
               akum[bulan]=prof[bulan]+loss[bulan];
               akumhrini=prhrini+lshrini;
            }
         }

      }

     txt[0][0]="Bulan";txt[0][1]="Total Lot";txt[0][2]="Profit";txt[0][3]="Loss";txt[0][4]="Akumulasi";

   for (i=1;i<13;i++)
   {
    for (j=0;j<5;j++)
     {
       if (j==0) {txt[i,j]=v[i];}
       if (j==1) {txt[i,j]=DoubleToString(ttllot[i],2);jumlot=jumlot+ttllot[i];}
       if (j==2) {txt[i,j]=DoubleToString(prof[i],2);}
       if (j==3) {txt[i,j]=DoubleToString(loss[i],2);}
       if (j==4) {txt[i,j]=DoubleToString(akum[i],2);total=total+akum[i];}
       if(txt[i,j]=="0.00"){txt[i,j]="";}
     }
   }

//--- isi line 13
     txt[13][0]="Total";txt[13][1]=DoubleToString(jumlot,2);txt[13][2]="";txt[13][3]="";txt[13][4]=DoubleToString(total,2);
     txt[14][0]="Hari ini";txt[14][1]="";txt[14][2]=DoubleToString(prhrini,2);txt[14][3]=DoubleToString(lshrini,2);txt[14][4]=DoubleToString(akumhrini,2);


    return(0);
  }
//+------------------------------------------------------------------+
//| Timer function                                                   |
//+------------------------------------------------------------------+
void OnTimer()
  {
//---
     ChartSetInteger(0,CHART_COLOR_BACKGROUND,clrBlack);
     ChartSetInteger(0,CHART_COLOR_FOREGROUND,clrBlack);
     ChartSetInteger(0,CHART_COLOR_CANDLE_BEAR,clrBlack);
     ChartSetInteger(0,CHART_COLOR_CANDLE_BULL,clrBlack);
     ChartSetInteger(0,CHART_COLOR_CHART_DOWN,clrBlack);
     ChartSetInteger(0,CHART_COLOR_CHART_LINE,clrBlack);
     ChartSetInteger(0,CHART_COLOR_CHART_UP,clrBlack);
     ChartSetInteger(0,CHART_COLOR_ASK,clrBlack);
     ChartSetInteger(0,CHART_COLOR_BID,clrBlack);
     ChartSetInteger(0,CHART_COLOR_GRID,clrBlack);
     ChartSetInteger(0,CHART_COLOR_STOP_LEVEL,clrBlack);
     ChartSetInteger(0,CHART_COLOR_VOLUME,clrBlack);
     ChartSetInteger(0,CHART_SHOW_GRID,0,0);
     ChartSetInteger(0,CHART_SHOW_LAST_LINE,0,0);
     ChartSetInteger(0,CHART_SHOW_ASK_LINE,0,0);
     ChartSetInteger(0,CHART_SHOW_BID_LINE,0,0);
     ChartSetInteger(0,CHART_SHOW_OHLC,0,0);
     ChartSetInteger(0,CHART_SHOW_OBJECT_DESCR,0,0);
     ChartSetInteger(0,CHART_SHOW_PERIOD_SEP,0,0);
     ChartSetInteger(0,CHART_SHOW_VOLUMES,0,0);
     ObjectsDeleteAll();
   for (int i=0;i<15;i++)
   {
    for (int j=0;j<5;j++)
     {
      SetPanel("Panel"+IntegerToString(i)+IntegerToString(j),0,(j*50)+x_axis,(i*25)+y_axis,65,25,BackGrnCol,LineColor,1);
     }
   }

   for (int i=0;i<15;i++)
   {
    for (int j=0;j<5;j++)
     {
      SetText("Text"+IntegerToString(i)+IntegerToString(j),txt[i][j],(j*50)+x_axis+2,(i*25)+y_axis+2,TextColor,8);
     }
   }
  }
//+------------------------------------------------------------------+

void SetText(string name,string text,int x,int y,color colour,int fontsize=12)
  {
   if(ObjectCreate(0,name,OBJ_LABEL,0,0,0))
     {
      ObjectSetInteger(0,name,OBJPROP_XDISTANCE,x);
      ObjectSetInteger(0,name,OBJPROP_YDISTANCE,y);
      ObjectSetInteger(0,name,OBJPROP_COLOR,colour);
      ObjectSetInteger(0,name,OBJPROP_FONTSIZE,fontsize);
      ObjectSetInteger(0,name,OBJPROP_CORNER,CORNER_LEFT_UPPER);
     }
   ObjectSetString(0,name,OBJPROP_TEXT,text);
  }


void SetPanel(string name,int sub_window,int x,int y,int width,int height,color bg_color,color border_clr,int border_width)
  {
   if(ObjectCreate(0,name,OBJ_RECTANGLE_LABEL,sub_window,0,0))
     {
      ObjectSetInteger(0,name,OBJPROP_XDISTANCE,x);
      ObjectSetInteger(0,name,OBJPROP_YDISTANCE,y);
      ObjectSetInteger(0,name,OBJPROP_XSIZE,width);
      ObjectSetInteger(0,name,OBJPROP_YSIZE,height);
      ObjectSetInteger(0,name,OBJPROP_COLOR,border_clr);
      ObjectSetInteger(0,name,OBJPROP_BORDER_TYPE,BORDER_FLAT);
      ObjectSetInteger(0,name,OBJPROP_WIDTH,border_width);
      ObjectSetInteger(0,name,OBJPROP_CORNER,CORNER_LEFT_UPPER);
      ObjectSetInteger(0,name,OBJPROP_STYLE,STYLE_SOLID);
      ObjectSetInteger(0,name,OBJPROP_BACK,false);
      ObjectSetInteger(0,name,OBJPROP_SELECTABLE,0);
      ObjectSetInteger(0,name,OBJPROP_SELECTED,0);
      ObjectSetInteger(0,name,OBJPROP_HIDDEN,true);
      ObjectSetInteger(0,name,OBJPROP_ZORDER,0);
     }
   ObjectSetInteger(0,name,OBJPROP_BGCOLOR,bg_color);
  }
Comments