Market Watch Cleaner
Indicator

Market Watch Cleaner

Automates the pruning of terminal interfaces by hiding symbols that lack full trading permissions or exceed a user-defined liquidity threshold.

MarketHeartBeat_02
Indicator

MarketHeartBeat_02

This indicator quantifies real-time price movement by aggregating the cumulative tick count, upward point deviations, and downward point deviations across each discrete minute of the trading session.

MarketHour
Indicator

MarketHour

This indicator visually maps the active trading windows of Asian, European, and US markets on a separate sub-window based on GMT offsets.

MarketNewsLib
Indicator

MarketNewsLib

This library automates the retrieval, normalization, and visual mapping of global economic news events directly onto trading charts via web requests.

marketsessions
Indicator

marketsessions

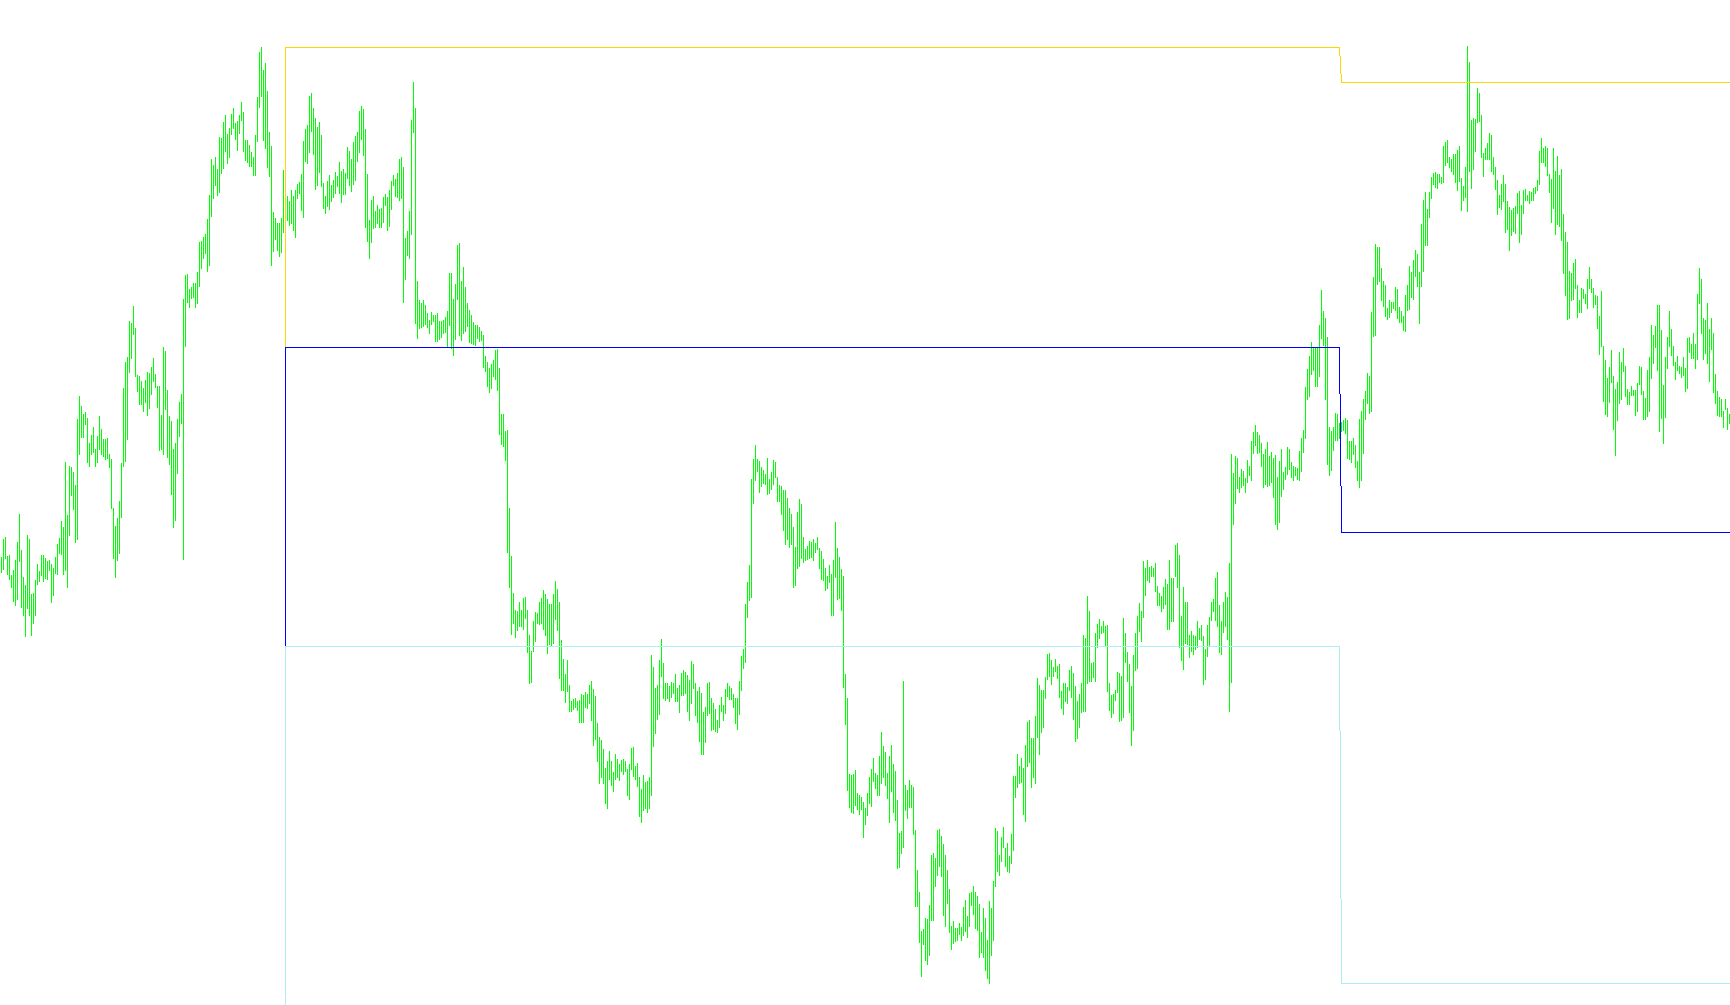
This indicator dynamically visualizes specific trading periods by rendering high and low price boundaries as distinct background rectangles across historical dates.

MarketWay
Indicator

MarketWay

iMAOnArray

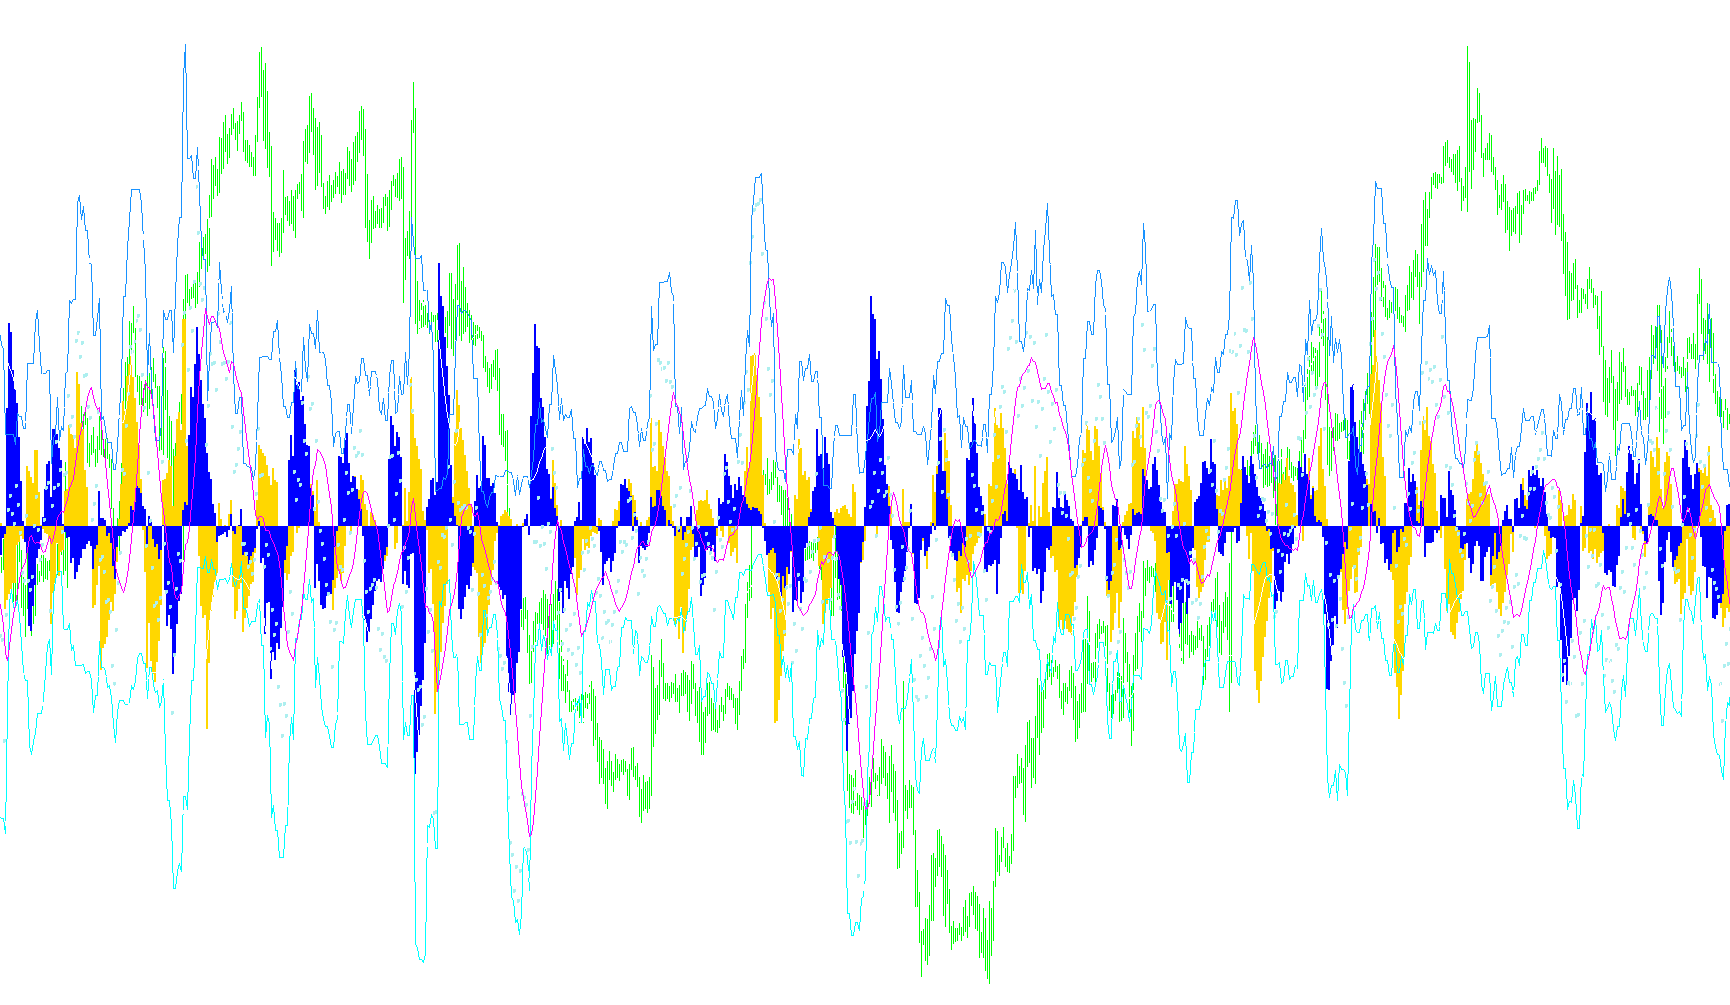
This indicator quantifies market force by calculating the variance between real-time bullish and bearish price accumulation against their respective simple moving averages.

Market_Open
Indicator

Market_Open

This indicator automatically plots vertical markers and text labels on the chart to identify major global financial market session openings, closings, and high-impact economic news windows.

Indicator

master_info

iCCIiMACDiRSIiStochastic
Indicator

MaStillWorks

iMA
maxminchannelwithslope
Indicator

maxminchannelwithslope

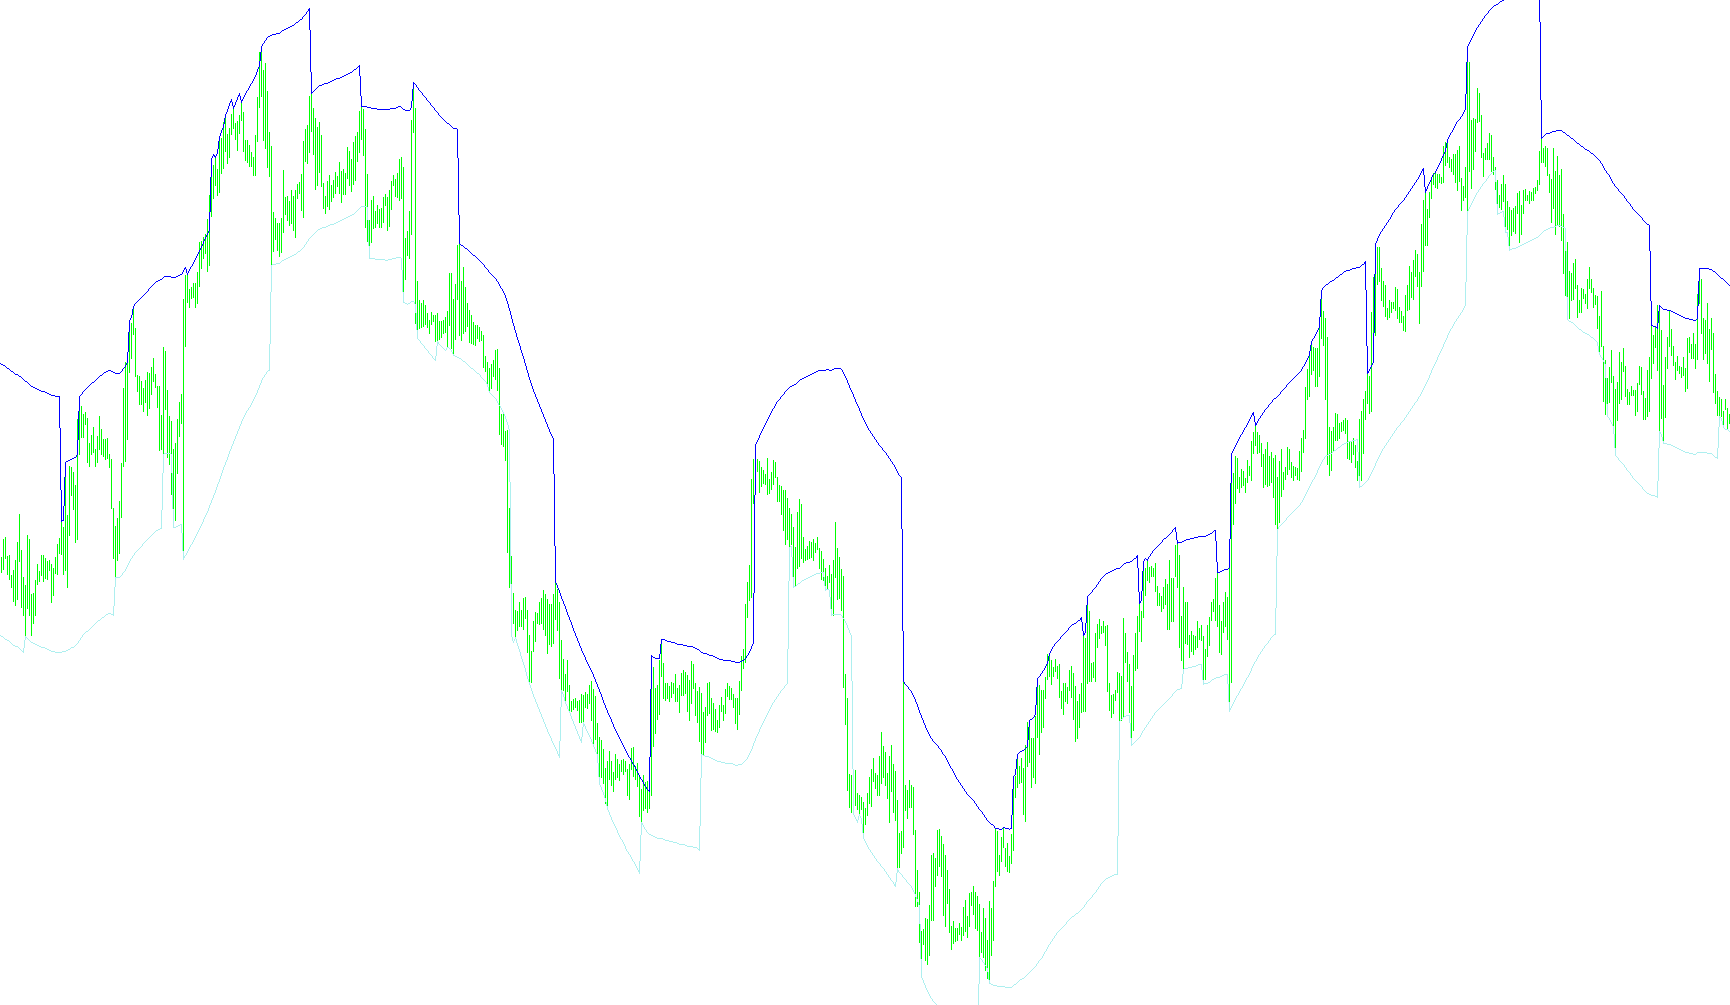
This indicator generates a price channel by identifying local extrema over a rolling period and projecting upper and lower boundaries based on an incremental slope adjustment derived from cumulative price volatility.

ma_bbands
Indicator

ma_bbands

iBandsiOsMAiMA
ma_channel_break_v1_0
Indicator

ma_channel_break_v1_0

iMA

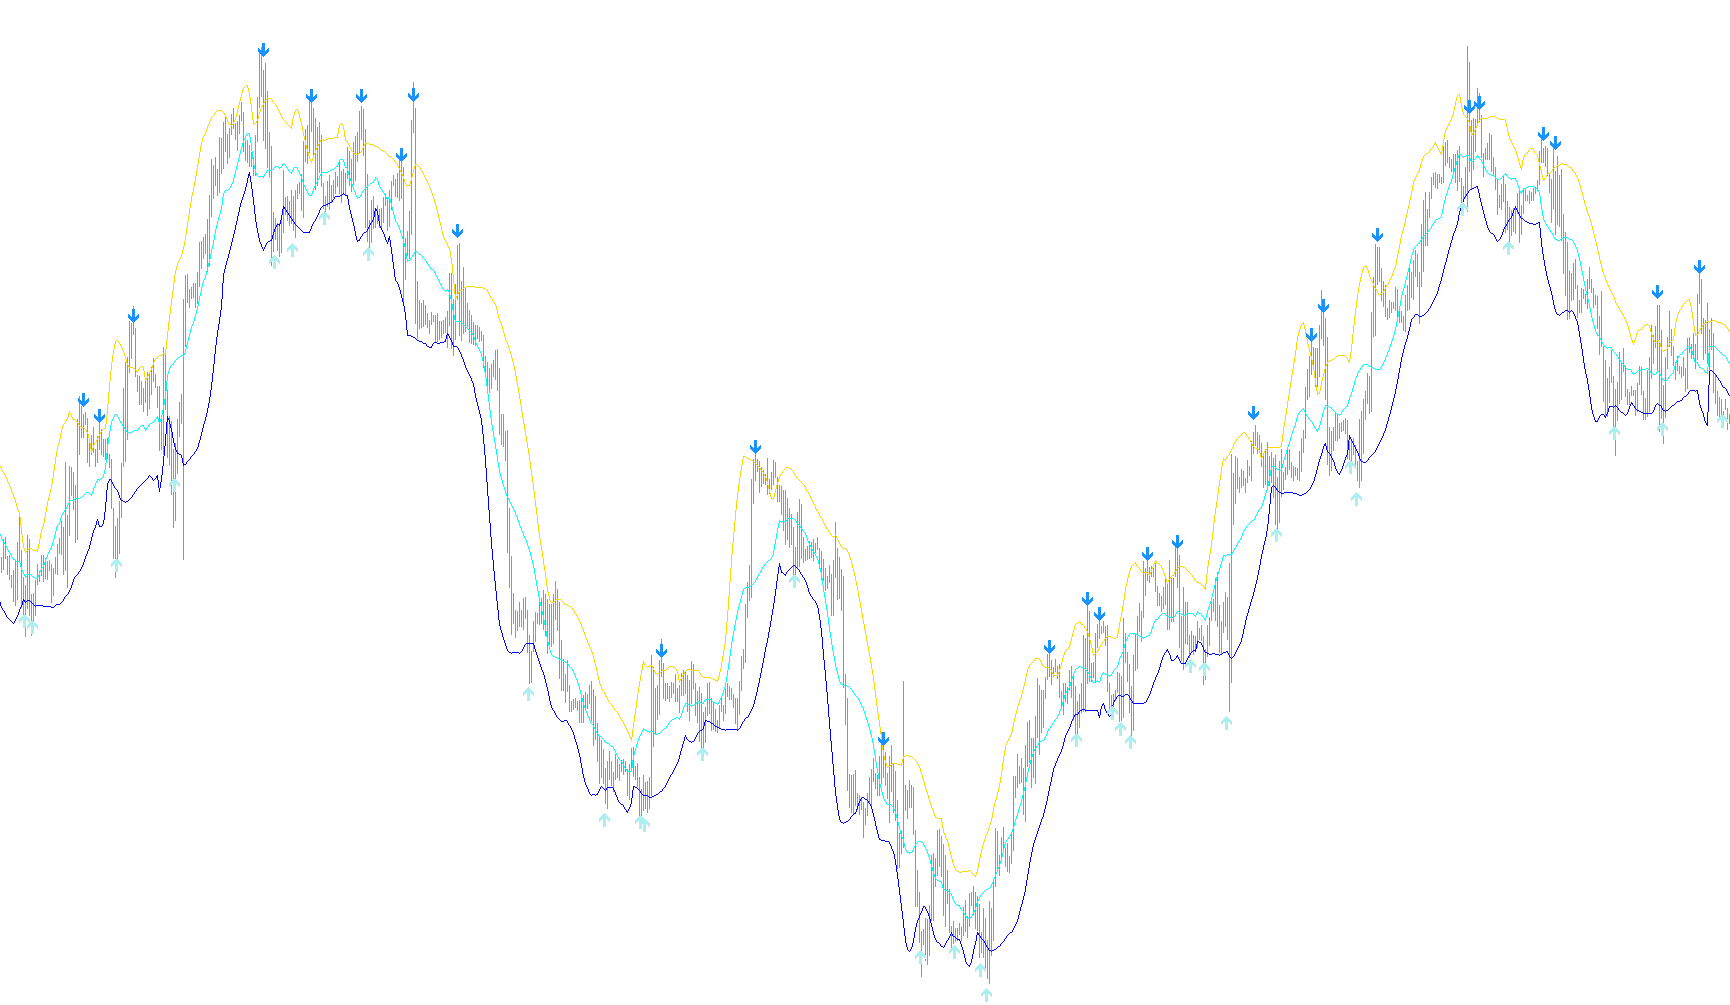
This indicator identifies trend reversal entries by detecting price closures beyond high/low EMA channels while simultaneously monitoring dynamic stop-loss and exit boundaries based on historical extremes.

ma_cross_alert_once_a
Indicator

ma_cross_alert_once_a

iATRiMA

This indicator identifies bullish and bearish trend reversals by detecting precise moving average crossovers and triggering unique notifications for each discrete intersection event.
ma_cross_alert_once_b
Indicator

ma_cross_alert_once_b

iATRiMA

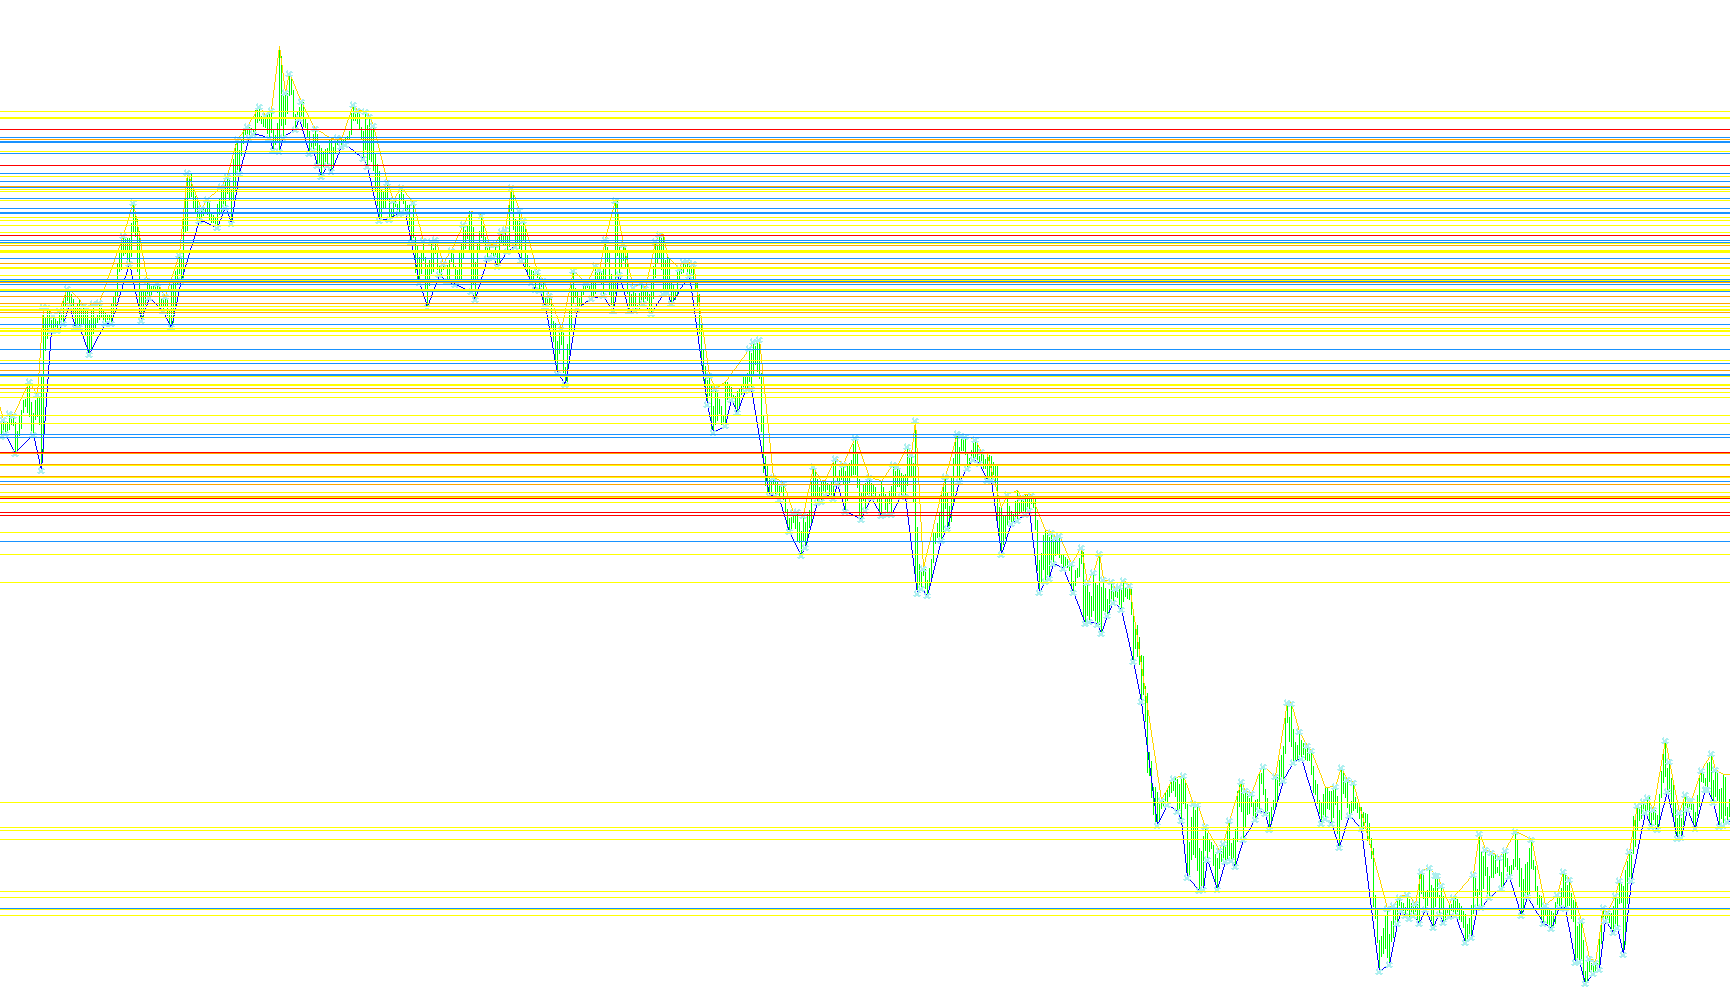
This indicator detects momentum shifts by identifying the intersection of two moving averages and triggers a single visual arrow and multi-channel notification for each unique crossover event.
MA_monika_SAR
Indicator

MA_monika_SAR

iMAiSAR

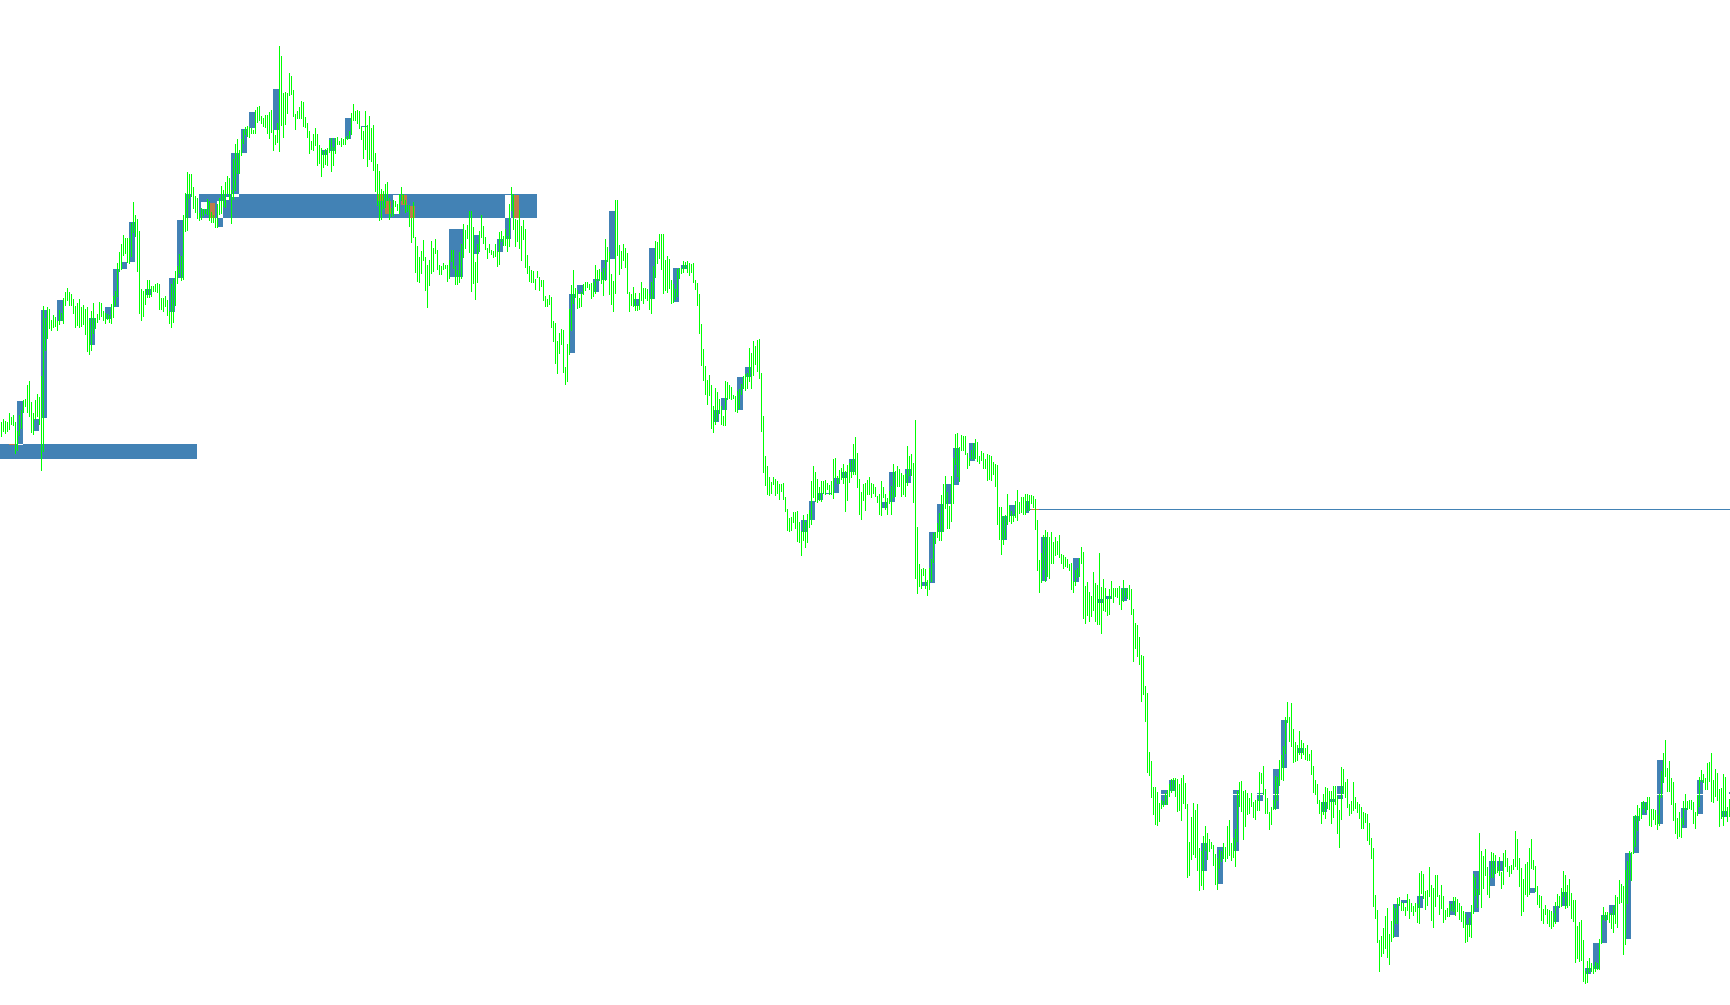
This indicator synchronizes Moving Average dynamics and Parabolic SAR reversal signals across four nested temporal horizons to provide a unified view of overarching market momentum.

Ma_Parabolic_st2_2
Indicator

Ma_Parabolic_st2_2

iMA

The algorithm identifies trend shifts by dynamically adjusting a parabolic step multiplier based on the interaction between smoothed moving average price action and rolling high/low extremes.

MA_Segments
Indicator

MA_Segments

iMA

This indicator projects horizontal segments and labels for various moving averages from multiple timeframes onto the current chart to maintain visual clarity.

MA_Support
Indicator

MA_Support

iMA

This indicator plots concurrent moving averages from multiple timeframes (M1 to MN1) onto a single chart to visualize cross-temporal trends simultaneously.

MA_Support_SAR
Indicator

MA_Support_SAR

iMAiSAR

This indicator plots concurrent Moving Average and Parabolic SAR data across M1, M5, H1, and D1 timeframes on a single M1 chart to identify structural trend alignment.
MCP_V2
Indicator

MCP_V2

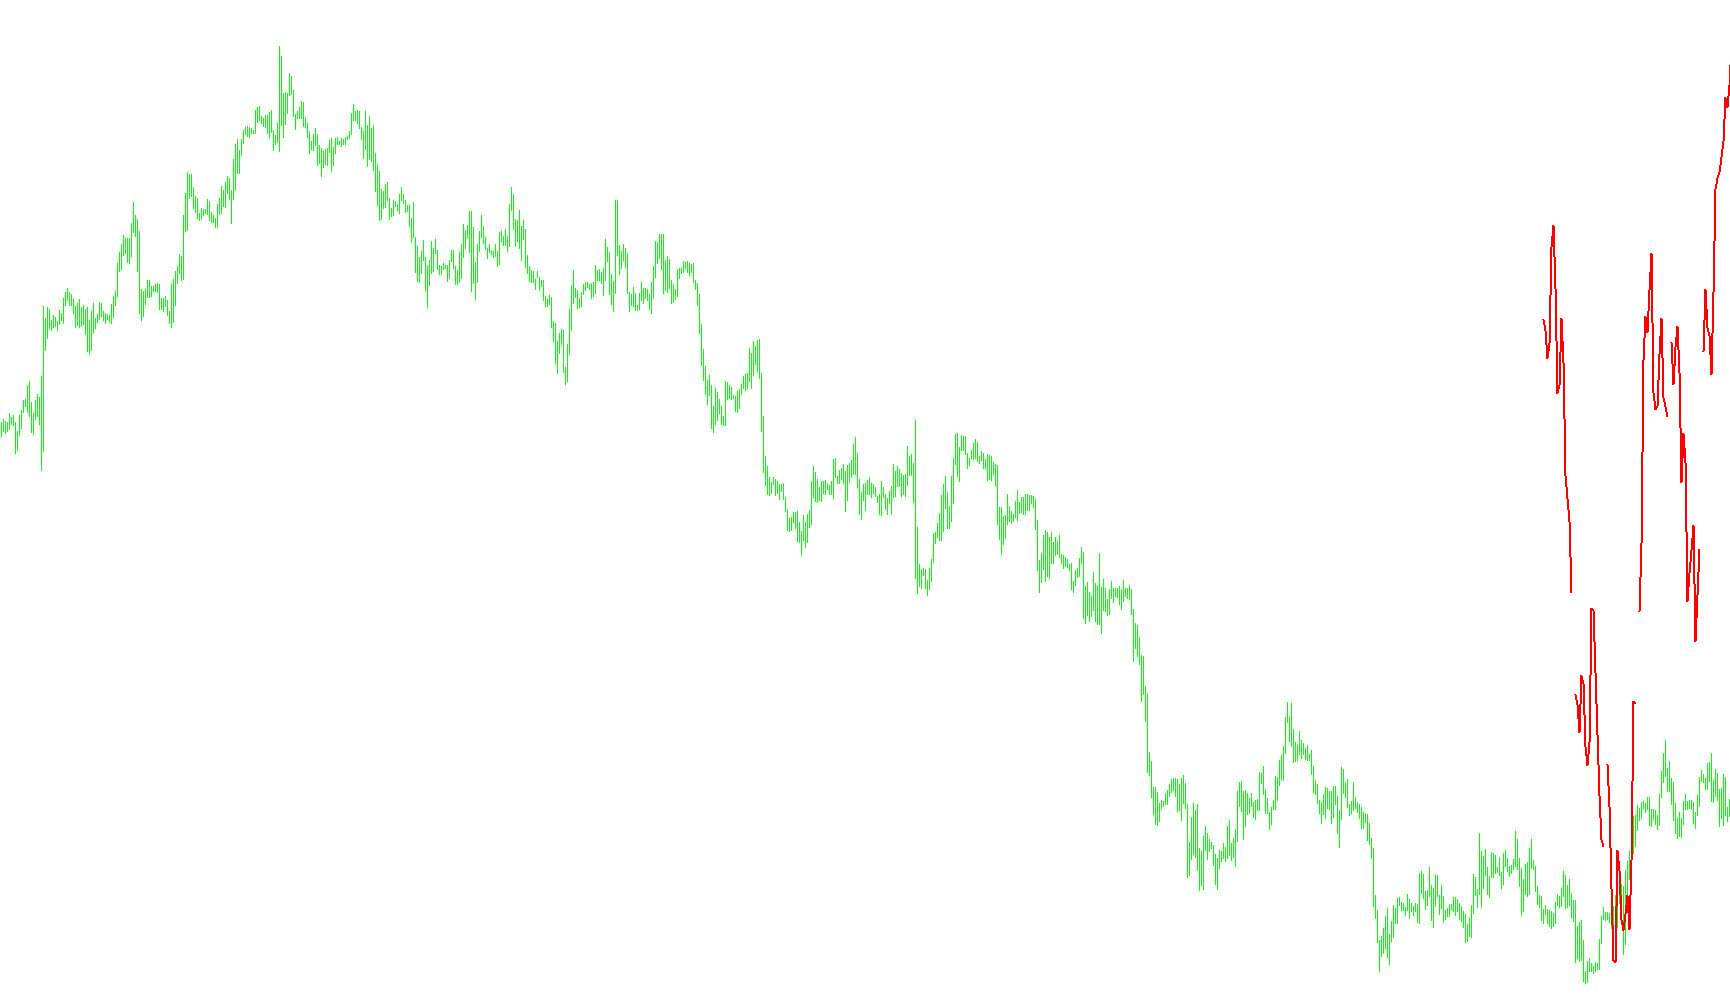
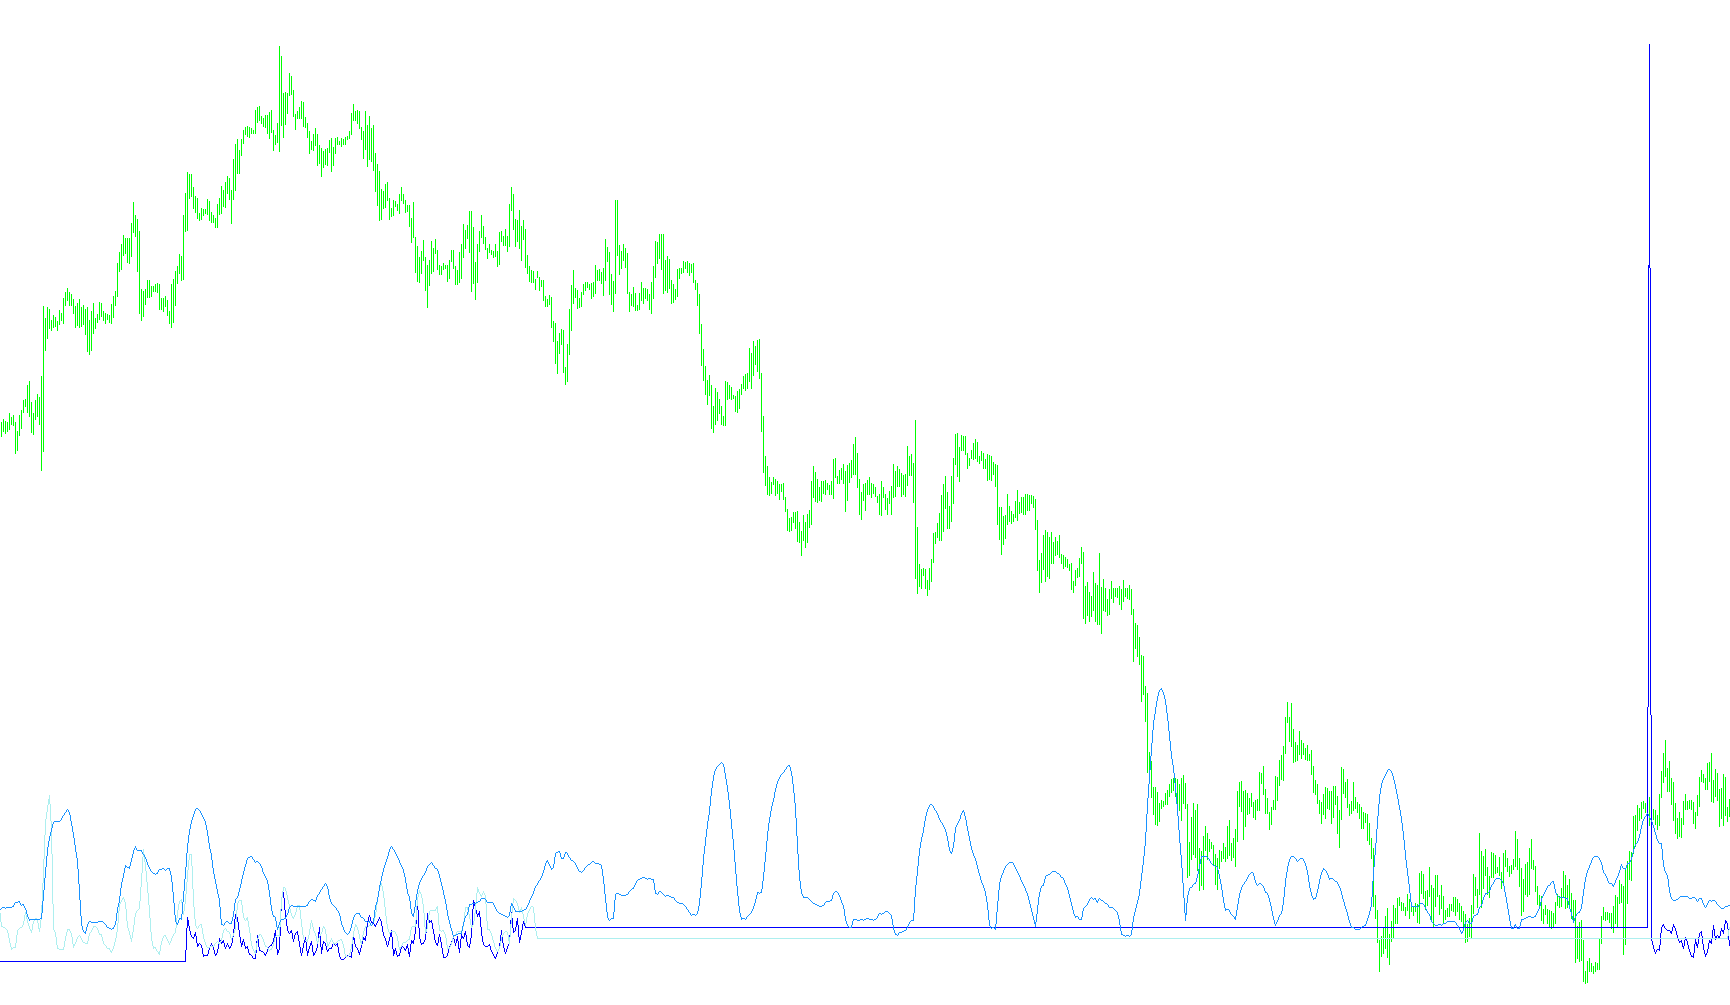
This indicator provides a visual multi-currency matrix that tracks simultaneous price action across major pairs to identify bullish and bearish sentiment by correlating individual currency movements.
MFI_price
Indicator

MFI_price

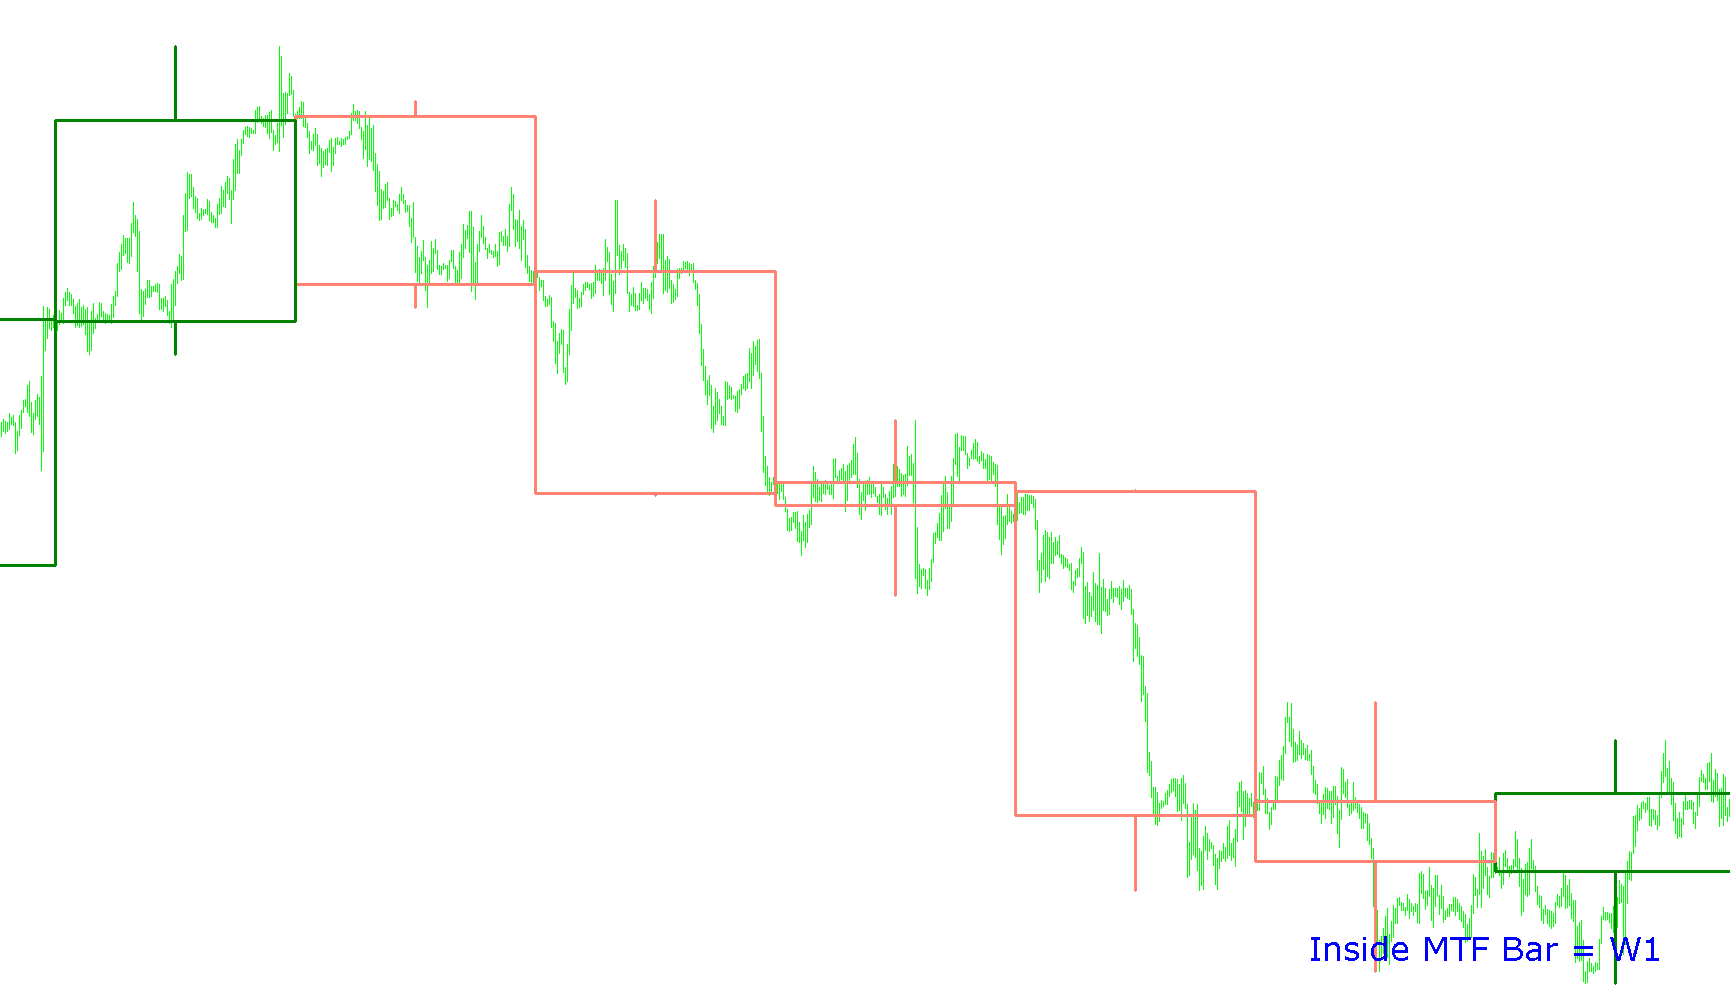
This indicator quantifies capital flow by calculating the ratio between positive and negative price movements weighted by trading volume across selectable price types.

MiBollingerBand
Indicator

MiBollingerBand

iMA

This indicator calculates nested Bollinger Bands by projecting dual standard deviation layers around a simple moving average to identify extreme price expansion and contraction zones.

MIndexq30AUG05t
Indicator

MIndexq30AUG05t

This indicator calculates a geometric mean of major currency pairs to derive a weighted composite value for a specified base currency.

Mirror_Bands
Indicator

Mirror_Bands

iMA

This indicator projects reflected price deviations by calculating the mathematical difference between primary and secondary moving average envelopes to identify structural equilibrium.

MktFlwAnlMth
Indicator

MktFlwAnlMth

This indicator tracks the temporal decay and structural progression of significant price extremes by monitoring the age and sequence of hierarchical highs and lows.

MMPRO - Dottor Market
Indicator

MMPRO - Dottor Market

This indicator automatically computes precise lot sizes, potential monetary losses, and pip values based on real-time account equity, user-defined risk percentages, and stop-loss configurations.

MMR
Indicator

MMR

iMACDiMAiRSI

This indicator synthesizes EMA and LWMA crossover dynamics with MACD momentum and RSI strength to generate a consolidated trend volatility signal.

MMR_HighLowLines
Indicator

MMR_HighLowLines

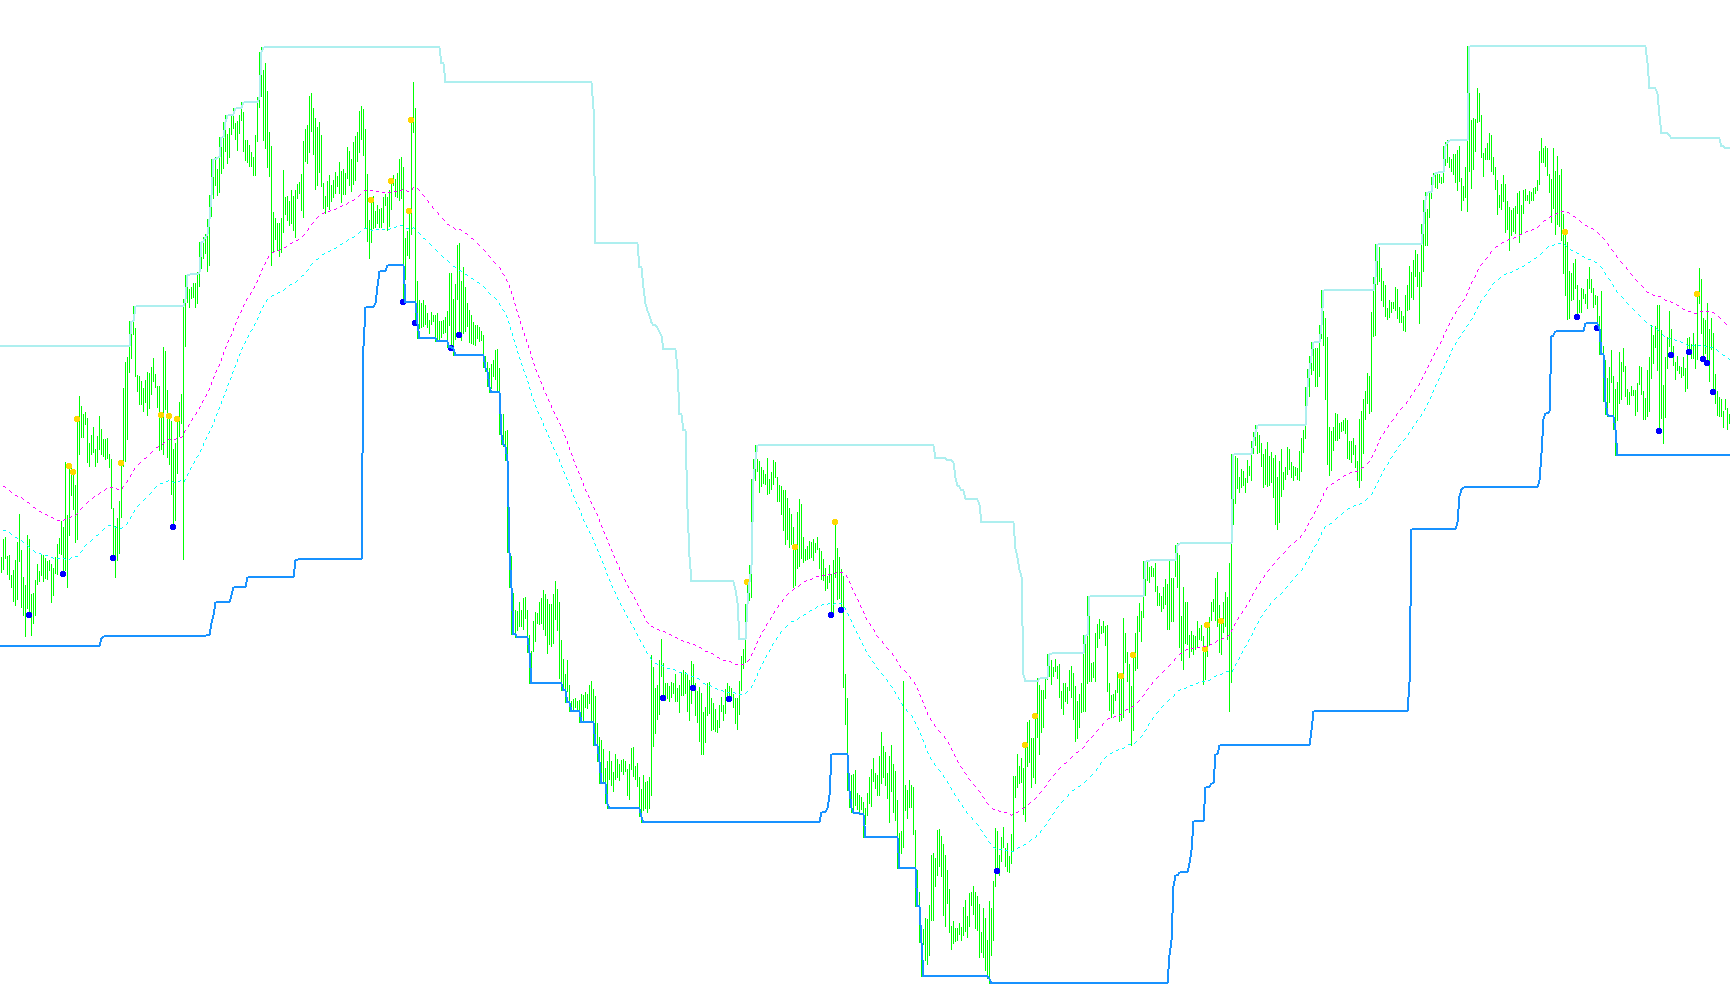
This indicator dynamically plots the rolling maximum high, minimum low, and the median midpoint across a user-defined lookback window to identify structural boundaries.

mnl_price
Indicator

mnl_price

iMAOnArray

This indicator calculates price percentage fluctuations over a specific lookback period and applies dual-layer moving averages to identify trend acceleration and momentum shifts.

Modify_All_TP_SL
Indicator

Modify_All_TP_SL

This script iterates through all active positions and pending orders on the current symbol to enforce specific price thresholds while maintaining existing protective levels if new targets are not provided.

Modify_BUY-SL-TP
Indicator

Modify_BUY-SL-TP

This script iterates through active buy positions to dynamically update or fix stop loss and take profit levels based on predefined pip offsets or absolute price coordinates.

Modify_SELL-SL-TP
Indicator

Modify_SELL-SL-TP

Iterates through active sell positions to batch update stop loss and take profit coordinates based on point offsets or fixed price targets while validating broker-enforced minimum distance constraints.

monex
Indicator

monex

This indicator synthesizes Weighted Close (HLCC/4) price action with ZigZag structural extremes to identify trend reversals and price distribution.

Indicator

Money Management

money_manager_graphic_tool
Indicator

money_manager_graphic_tool

A visual dashboard that automates precise position sizing based on real-time risk percentage, dynamic reward-to-risk ratios, and interactive threshold management.

monthHL
Indicator

monthHL

The indicator identifies previous day's price extremes to project horizontal pivot, resistance, and support levels onto the current trading session.

moving_average_ex
Indicator

moving_average_ex

iMA

This indicator maps a higher timeframe Exponential Moving Average onto the current chart to visualize long-term trend bias across nested temporalities.

MPCandle
Indicator

MPCandle

This indicator identifies the price level with the highest recurrence frequency within a specific sub-period timeframe to highlight areas of significant market liquidity and consensus.

mslmsh
Indicator

mslmsh

Identifies significant market structural levels by calculating the frequency of historical price interaction and highlighting high-congestion zones with dynamic color coding.

MTF Candles
Indicator

MTF Candles

This indicator projects higher timeframe price candles onto the current chart by mapping historical open and close data to specific temporal segments.

MTF-StdDev-4
Indicator

MTF-StdDev-4

iStdDev

This indicator visualizes concurrent standard deviation values across multiple timeframes simultaneously to assess relative price fluctuations and market volatility.

mtf_bar_indicator_v1_0
Indicator

mtf_bar_indicator_v1_0

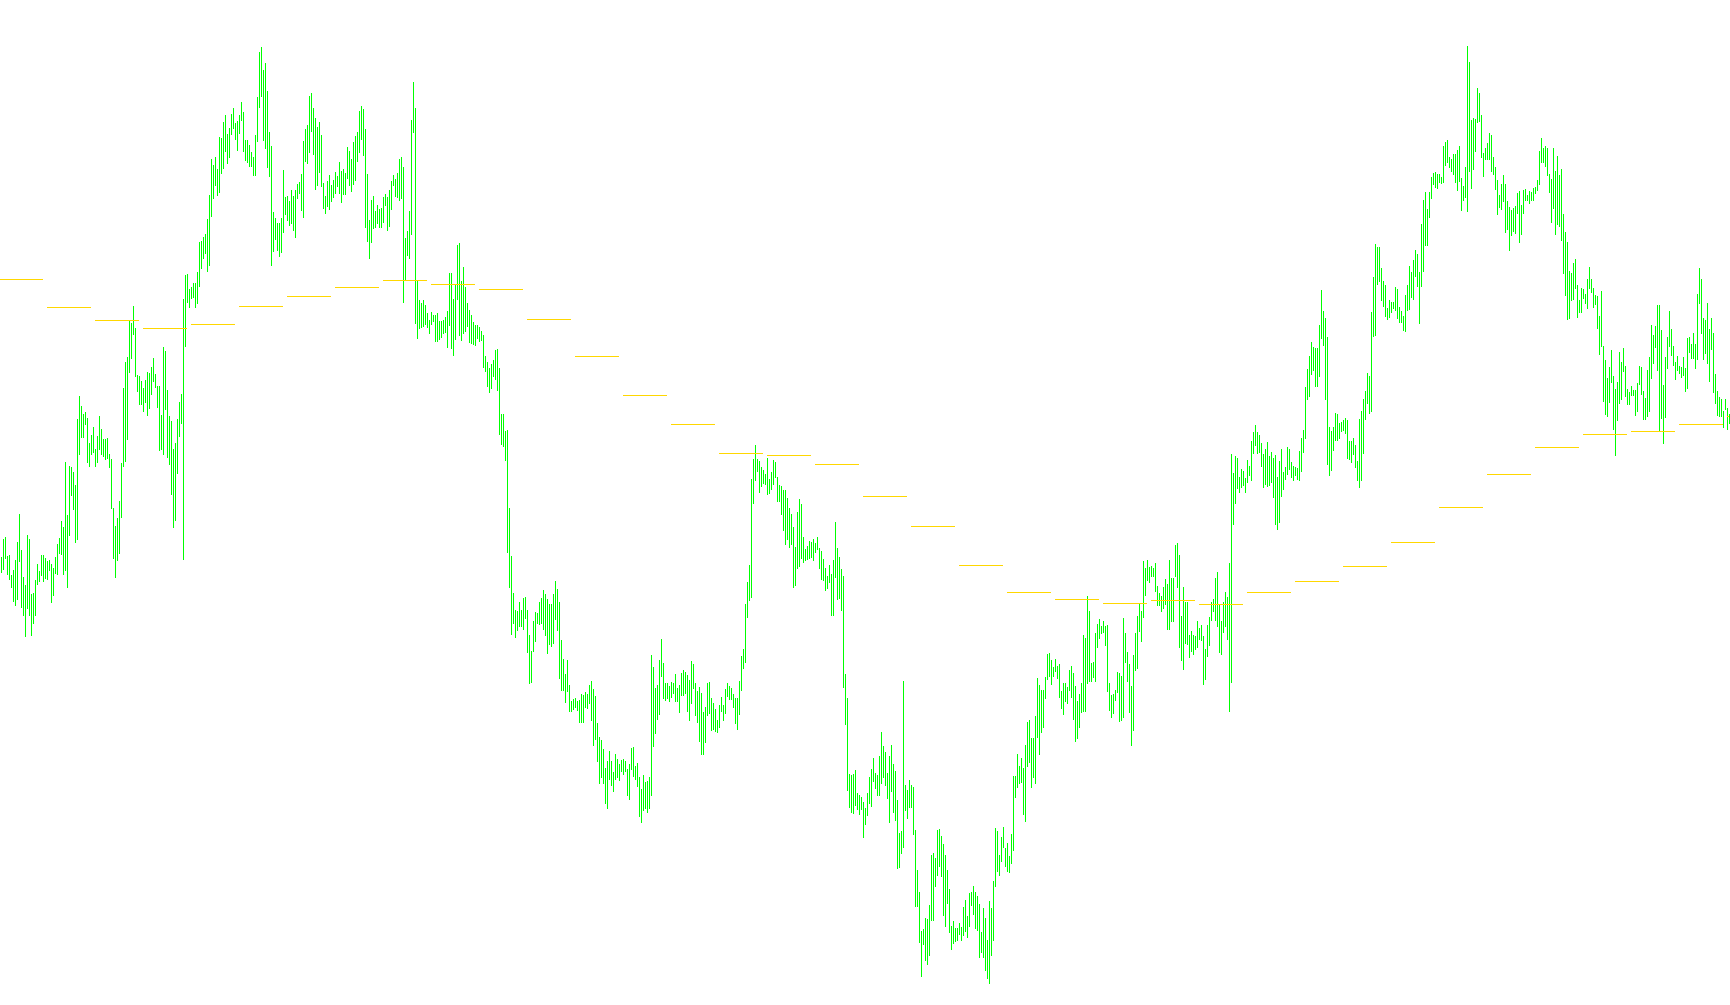
This indicator projects historical higher timeframe price boundaries and midpoints onto the current chart to visualize structural containment.

MTF_Fractal
Indicator

MTF_Fractal

iFractals

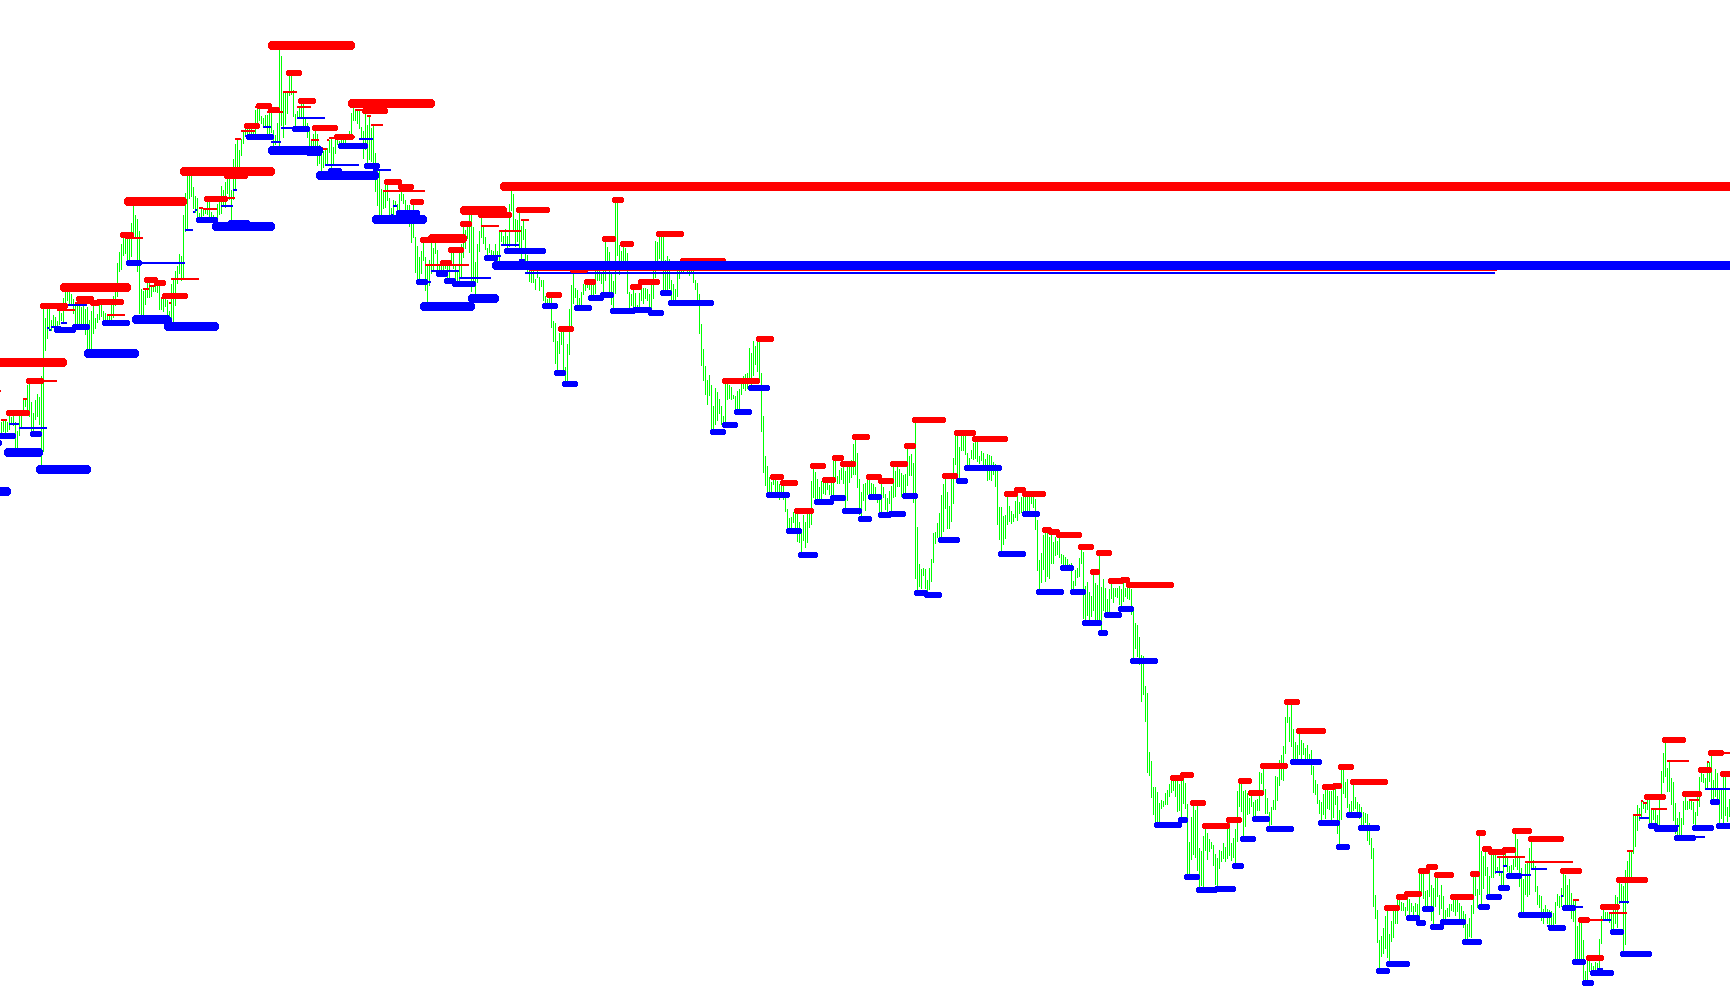
This indicator identifies higher-timeframe fractal pivot points and projects dynamic horizontal support and resistance levels by scanning for price violations.

Indicator

MTF_FractalDispersion11

MTF_Resistance_Support
Indicator

MTF_Resistance_Support

iFractals

This indicator identifies significant price boundaries by synchronizing fractal high and low extremes across three distinct timeframes simultaneously to detect multi-layered structural pivot points.

mtf_rsi
Indicator

mtf_rsi

iRSI

Visualizes multiple Relative Strength Index oscillations simultaneously in a single window, partitioned by selectable temporal horizons to identify overarching market momentum.

mtf_visualization_v1_5_1
Indicator

mtf_visualization_v1_5_1

This indicator overlays real-time candle bodies, wick extremes, and pivot levels from multiple higher timeframes onto a single chart to provide a holistic view of market structure.

Multi Pair Spread Monitor
Indicator

Multi Pair Spread Monitor

This indicator provides a real-time visual dashboard of bid-ask differentials across twenty-eight major currency pairs, dynamically highlighting high-cost fluctuations via color coding and system alerts.

Indicator

Multi.Period.MA

iMAiMAOnArray
Multi.Period.RSI
Indicator

Multi.Period.RSI

iRSI

This indicator calculates the Relative Strength Index by automatically mapping lower-interval inputs to their corresponding nearest standardized higher-timeframe archetypes.