Indicator

KoliEr_Market_Sessions_Indi

Kolier_SuperTrend_Indi
Indicator

Kolier_SuperTrend_Indi

iATR

This indicator identifies market direction by dynamically plotting trend boundaries based on the midpoint of price action relative to Average True Range volatility expansions.

Laguerre_RSI_with_Laguerre_filter_2
Indicator

Laguerre_RSI_with_Laguerre_filter_2

This indicator computes a sophisticated Laguerre Relative Strength Index combined with a multi-speed smoothing filter to identify momentum trends and visualize non-trade equilibrium zones.

lastmanstandingindicatorv11
Indicator

lastmanstandingindicatorv11

iMA

Identifies nested multi-scale price extremes by isolating distinct fractal peaks and troughs against a dynamic exponential trend filter.

lastweekfibo
Indicator

lastweekfibo

Automatically plots historical price extremes and dynamic Fibonacci retracement levels based on the preceding week's high and low price action.

Indicator

Liber_Abaci

Limiteddonchianchanel
Indicator

Limiteddonchianchanel

This algorithm maps a bounded price corridor that expands only when volatility exceeds a specific point threshold, otherwise maintaining its previous structural limits.

lineaire
Indicator

lineaire

This indicator calculates a linear regression line based on price action to project a statistical mean path bounded by dynamic deviation channels.

linear-momentum
Indicator

linear-momentum

iMAOnArray

This indicator quantifies price movement intensity by calculating the rate of change of candle distance relative to time, weighted by tick volume and smoothed through an exponential moving average.

LineMA
Indicator

LineMA

iMA

This indicator identifies and visualizes trend momentum by drawing geometric trendlines connecting specific points where two Simple Moving Averages undergo sequential crossovers.

Indicator

LinesProfitLoss

linie_wsparcia_oporu_v2
Indicator

linie_wsparcia_oporu_v2

This indicator automatically identifies and plots dynamic trend lines based on local price extremes within a user-defined historical lookback window to visualize key structural zones.

LocalTimeLine
Indicator

LocalTimeLine

Dynamically renders vertical historical markers and chronological labels tailored to the specific timeframe of the active chart.

LOCKijunSenChannel
Indicator

LOCKijunSenChannel

Calculates a central equilibrium line and corresponding boundary extremes based on the highest high and lowest low over a specific lookback period.

LOCSignal-MACDDoublePike
Indicator

LOCSignal-MACDDoublePike

iMACD

This indicator identifies high-probability trend reversals by detecting specific multi-bar momentum shifts and 'pike' formations within the MACD main line relative to its signal history.

log
Indicator

log

This indicator calculates the logarithmic returns of four distinct currency pairs simultaneously to visualize relative price velocity across different assets.

logtickdata
Indicator

logtickdata

Captures real-time price fluctuations and timestamps into a persistent CSV ledger for offline quantitative analysis.

look4trend
Indicator

look4trend

Identifies high-magnitude price swings that structurally encapsulate three consecutive opposing movements of lesser intensity.

lot_profit
Indicator

lot_profit

This indicator calculates and displays the cumulative volume of open positions alongside their net financial returns, partitioned by buy and sell directions for the active symbol.

lot_rebate_calculator
Indicator

lot_rebate_calculator

This script iterates through historical trade data to compute cumulative volume and visualize the total accrued loyalty rewards based on a user-defined per-lot rate.

LousokuMark
Indicator

LousokuMark

This indicator identifies specific Japanese candlestick reversal and continuation patterns by analyzing price action geometry, including wick length thresholds and multi-bar structural relationships.

LRDegrees
Indicator

LRDegrees

iMA

This indicator calculates multi-degree linear regression slopes to identify structural trend shifts, momentum reversals, and price orientation through geometric degree analysis.

MA predictor
Indicator

MA predictor

iMA

This indicator employs a Backpropagation Neural Network to predict future price action by analyzing non-linear price relationships filtered through Fibonacci-sequence temporal delays.

MA-EA-TSTOPS
Indicator

MA-EA-TSTOPS

An automated risk management tool that executes either a rolling high-low structural trailing stop or a fixed-pips buffer adjustment based on current market volatility.

MA-Heikin
Indicator

MA-Heikin

iMAOnArray

This indicator calculates a smoothed average of historical price points and identifies directional shifts by filtering out neutral movements to highlight bullish and bearish momentum trends.

ma-median
Indicator

ma-median

iMAiMAOnArray

This indicator generates a nested smoothing effect by applying successive Exponential Moving Averages to a price median base across three synchronized periods.

Indicator

MaBased-ZigZag

iMA
MACD MA Price-2
Indicator

MACD MA Price-2

iMAiMAOnArray

This indicator calculates momentum dynamics by deriving a MACD histogram from custom moving average types and generating a secondary signal line through an additional smoothing overlay.

MACD MA Price
Indicator

MACD MA Price

iMAiMAOnArray

This indicator computes the divergence between two moving averages and applies a secondary smoothing layer to generate a filtered signal line based on customizable price inputs.

macd-neskk
Indicator

macd-neskk

iMAiMAOnArray

This indicator synthesizes traditional MACD crossovers with secondary momentum velocity analysis to identify trend reversals and strength shifts.

macdchannels
Indicator

macdchannels

iMA

This indicator synthesizes three distinct moving average types to calculate a weighted composite mean of price momentum and trend direction.

macd_and_volumes
Indicator

macd_and_volumes

iMAiMAOnArray

This indicator synthesizes exponential moving average differences with normalized transaction intensity to visualize price momentum alongside relative liquidity flows.

MACD_FlatMarketDetector
Indicator

MACD_FlatMarketDetector

iMACDiMAOnArray

Identifies market stagnation by calculating the derivative of MACD median values and filtering volatility through an exponential smoothing gamma threshold.

MACD_Mirror
Indicator

MACD_Mirror

iMAiMAOnArray

This indicator quantifies trend polarity by calculating the difference between EMA values derived from contrasting price actions, specifically comparing high-low divergence versus open-close spread.

macd_momentum
Indicator

macd_momentum

iMAiMAOnArray

This indicator fuses standard Moving Average Convergence Divergence with a smoothed momentum differential to detect underlying velocity shifts in price action.

Indicator

MACD_OsMA_4ColorHM_2L_mtf

iMACDiOsMA
Macd_Support_and_Resistance
Indicator

Macd_Support_and_Resistance

iMACD

Identifies dynamic supply and demand levels by tracking extreme price rejection points triggered by MACD signal momentum shifts.

MACFibo v1.1
Indicator

MACFibo v1.1

iMA

This indicator identifies trend reversals by detecting moving average crossovers and dynamically projects visual Fibonacci-style trend lines from significant recent price extremes.

MACFibo
Indicator

MACFibo

iMA

This indicator identifies trend reversals by detecting moving average crossovers and visually projects dynamic lines from the recent structural extremes to the crossover point.
MAcrosses
Indicator

MAcrosses

iMA

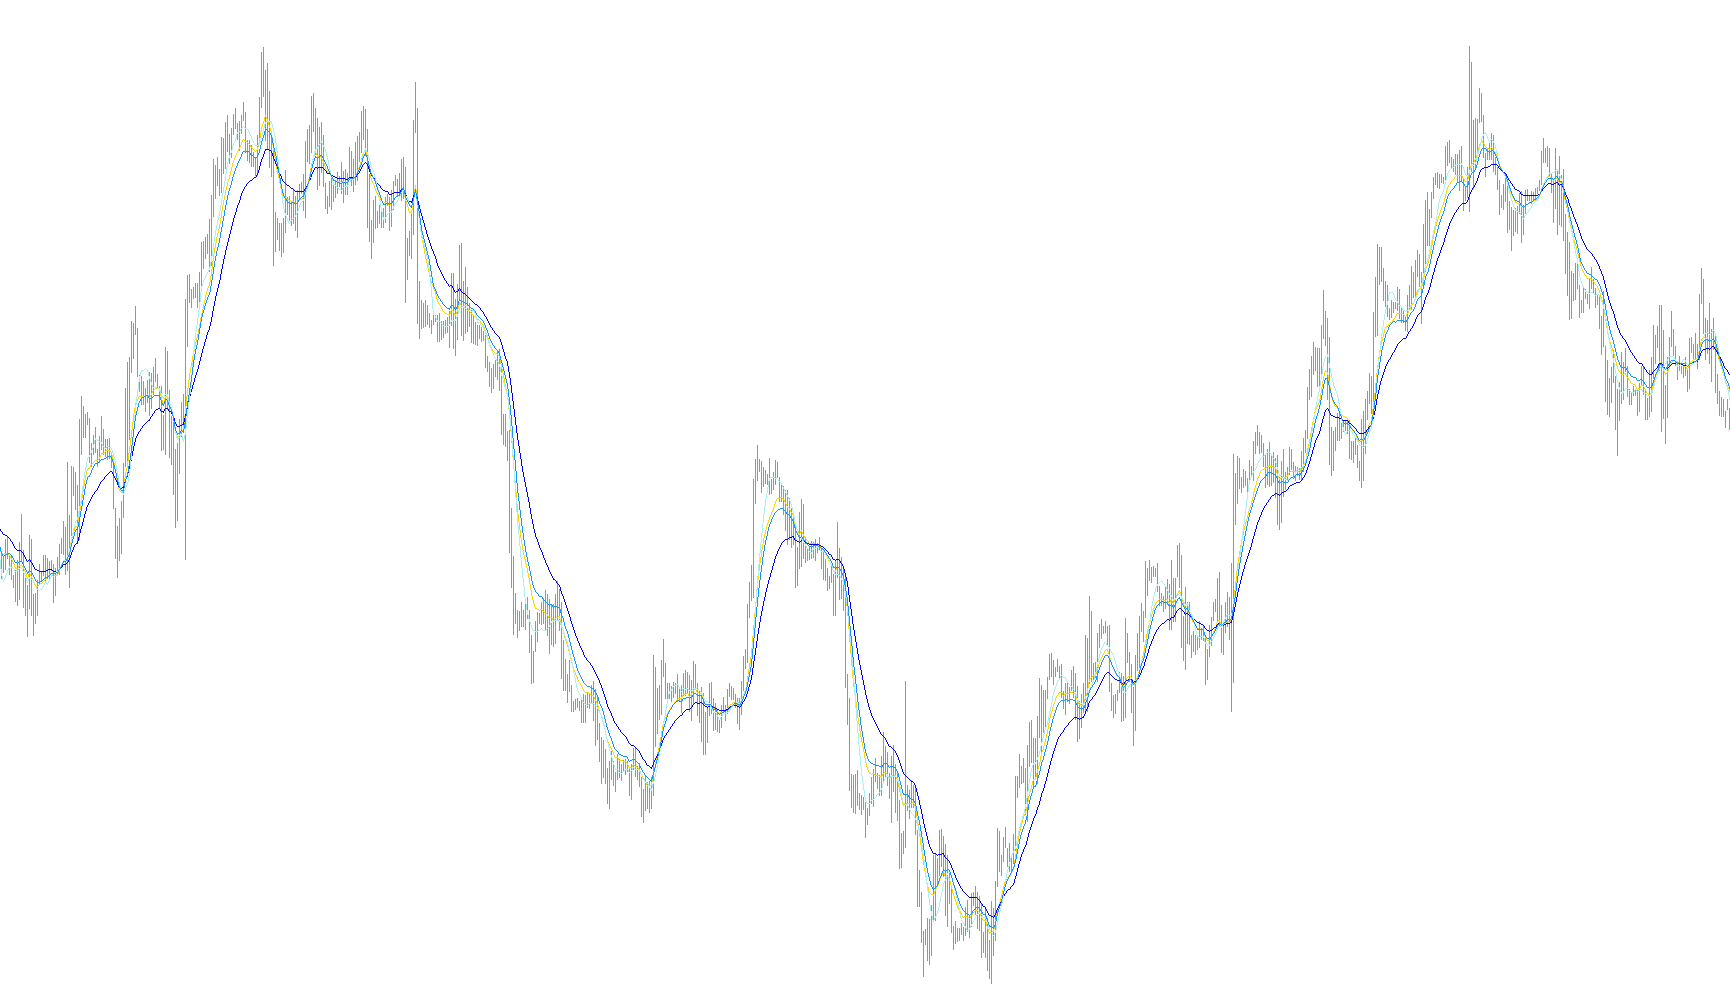
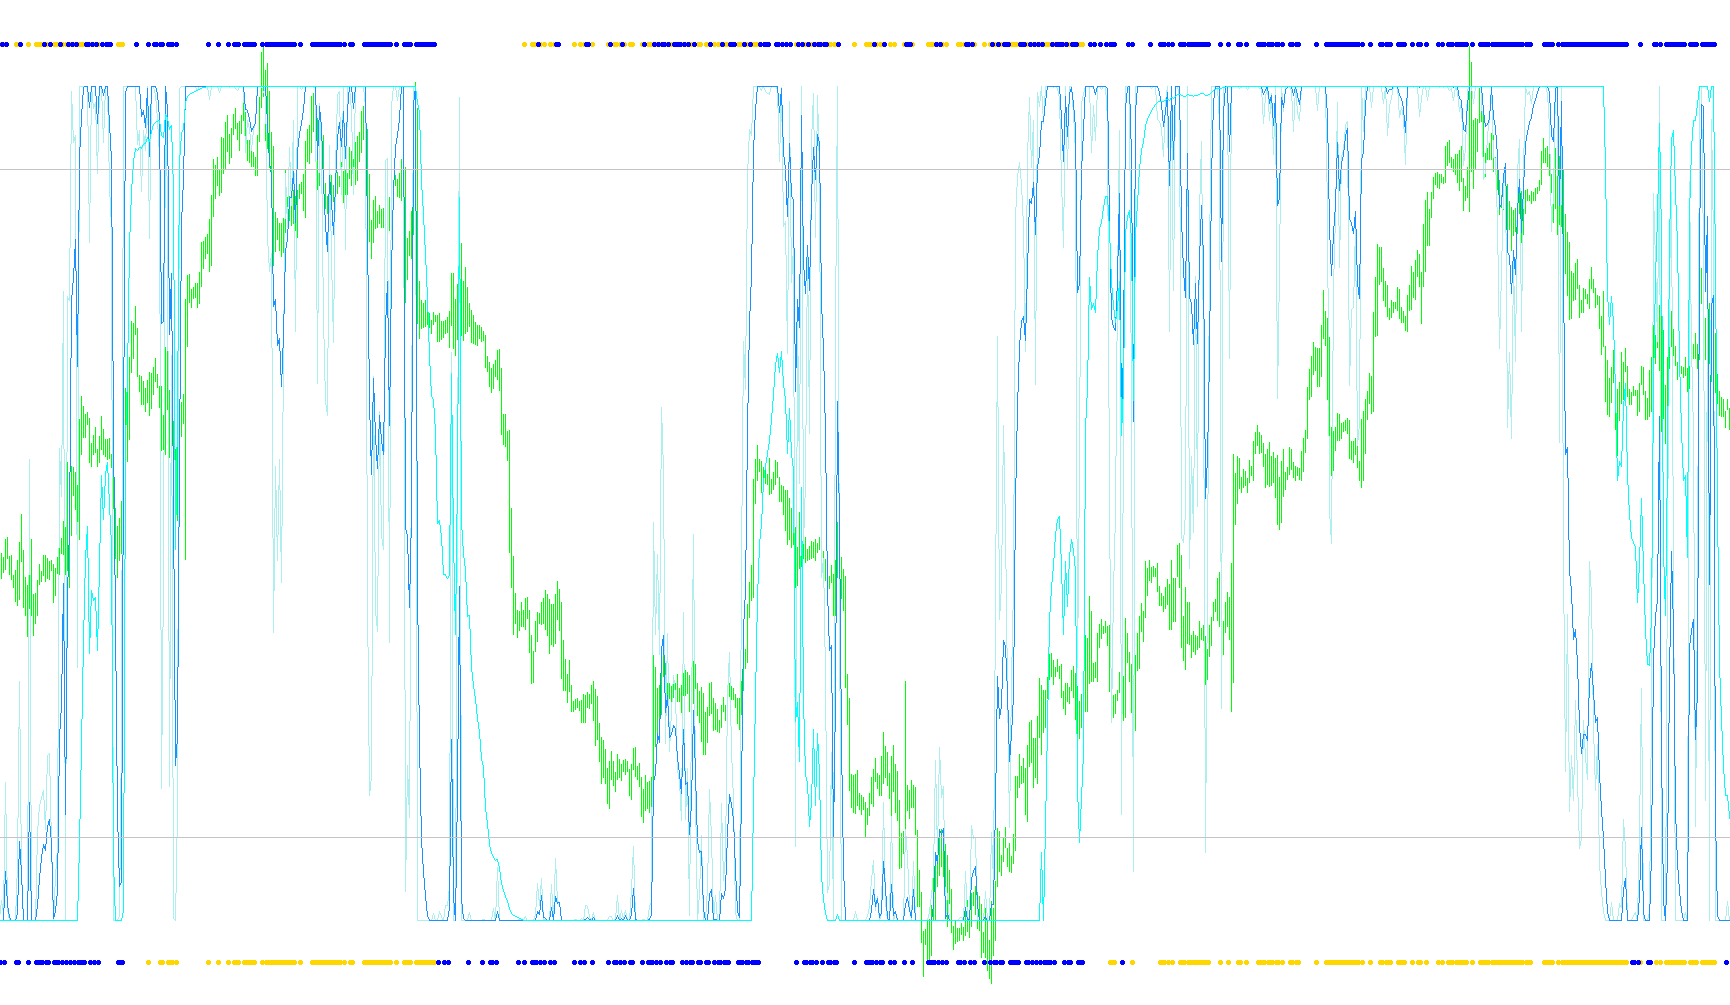
This indicator quantifies bullish and bearish momentum by calculating the percentage of faster moving averages trending above or below slower periods within a defined multi-period hierarchy.

mad
Indicator

mad

iMA

This indicator quantifies the instantaneous rate of change by calculating the point-based delta between consecutive Simple Moving Average values.

madnessMA
Indicator

madnessMA

iMA

This indicator quantifies market momentum by calculating the weighted spatial relationship and relative sorting degrees between a multi-layered array of Fibonacci-based moving averages.

MaEnv_02B_v2
Indicator

MaEnv_02B_v2

iMA

This indicator generates a dynamic multi-band envelope centered on a weighted average of three Linear Weighted Moving Averages, utilizing specific Fibonacci numerical offsets to define price volatility boundaries.

MaEnv_02B_v3a
Indicator

MaEnv_02B_v3a

iMA

This indicator calculates a composite Linear Weighted Moving Average and projects multiple symmetrical price channels based on time-frame sensitive volatility coefficients and Fibonacci retracement levels.

Main Points - Dottor Market
Indicator

Main Points - Dottor Market

This indicator calculates and visualizes key price equilibrium levels by plotting daily, weekly, and monthly pivot points simultaneously on the chart.

malock
Indicator

malock

iMA

This indicator dynamically scales the Moving Average period based on a fixed higher timeframe anchor to maintain consistent signal velocity across different chart resolutions.

MALRFast
Indicator

MALRFast

iMA

This indicator calculates a weighted differential between Linear Weighted Moving Averages and Simple Moving Averages to identify momentum shifts.

MAM_Crossover
Indicator

MAM_Crossover

iMA

Identifies structural trend reversals by detecting specific alternating fluctuations in Simple Moving Average gaps between open and close prices.

MAonMA
Indicator

MAonMA

iMAiMAOnArray

This indicator calculates a hierarchical smoothing effect by applying subsequent moving averages onto the results of previous ones to filter out high-frequency price noise.

Market Profiles
Indicator

Market Profiles

Visualizes multi-region trading windows by plotting historical high and low price boundaries across specific global economic sessions.