realvalueextended
Indicator

realvalueextended

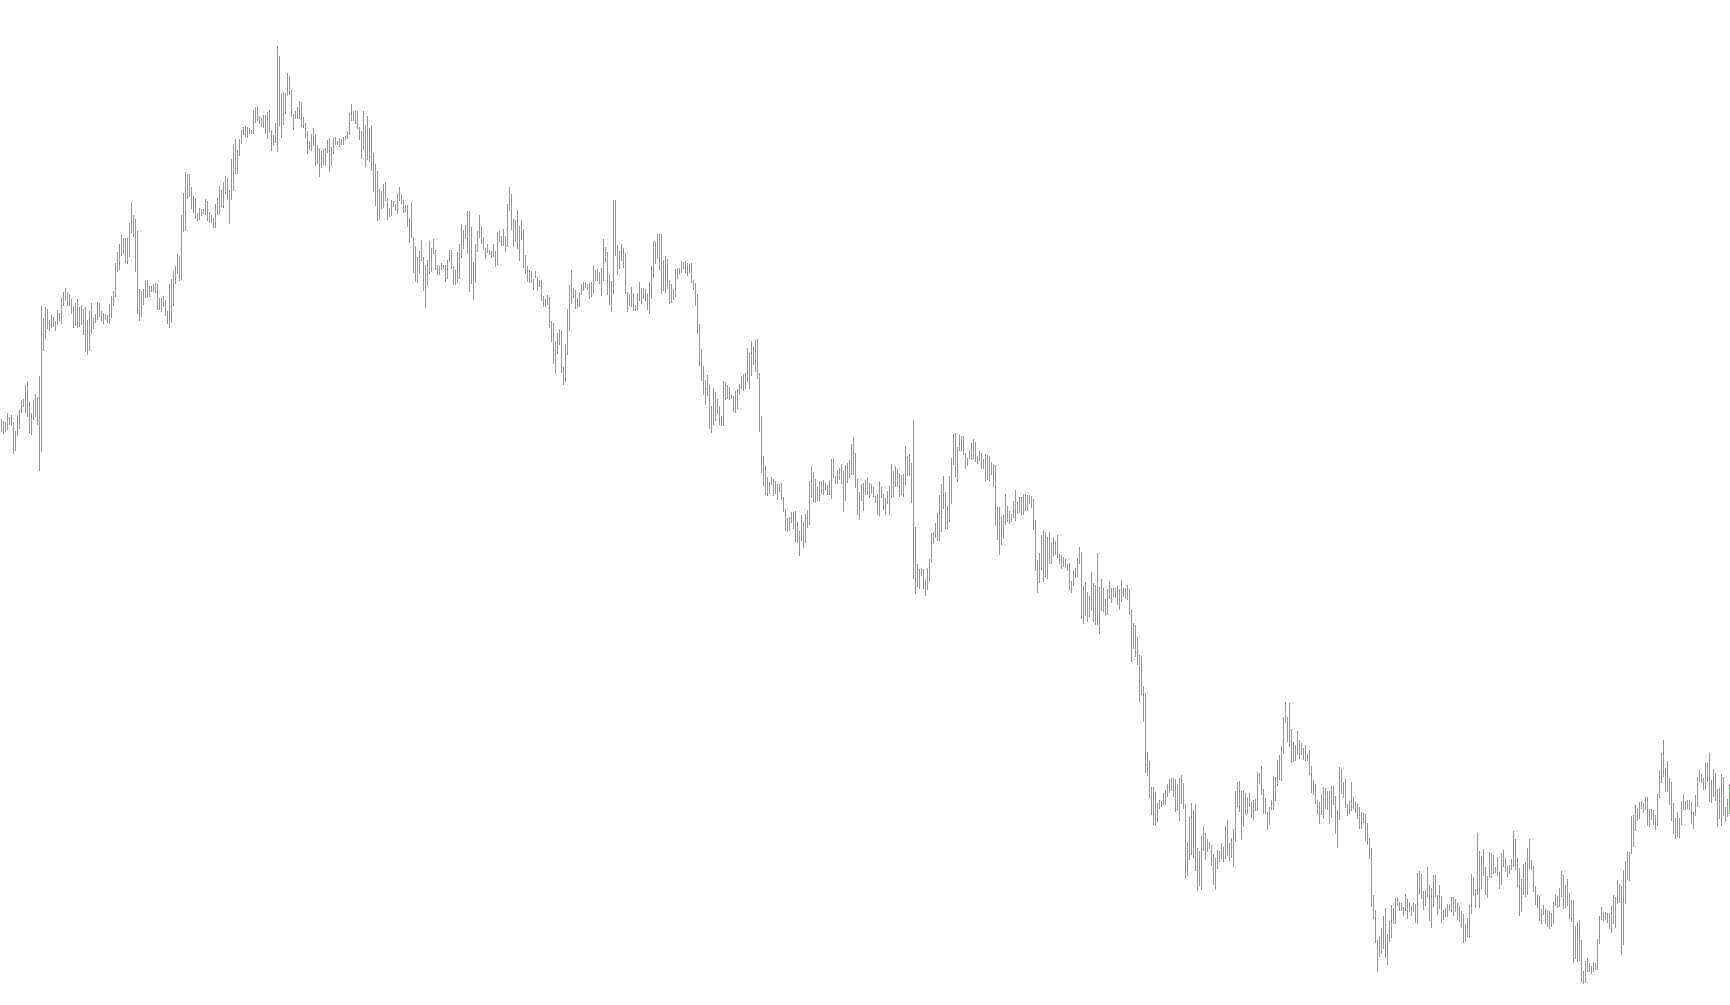
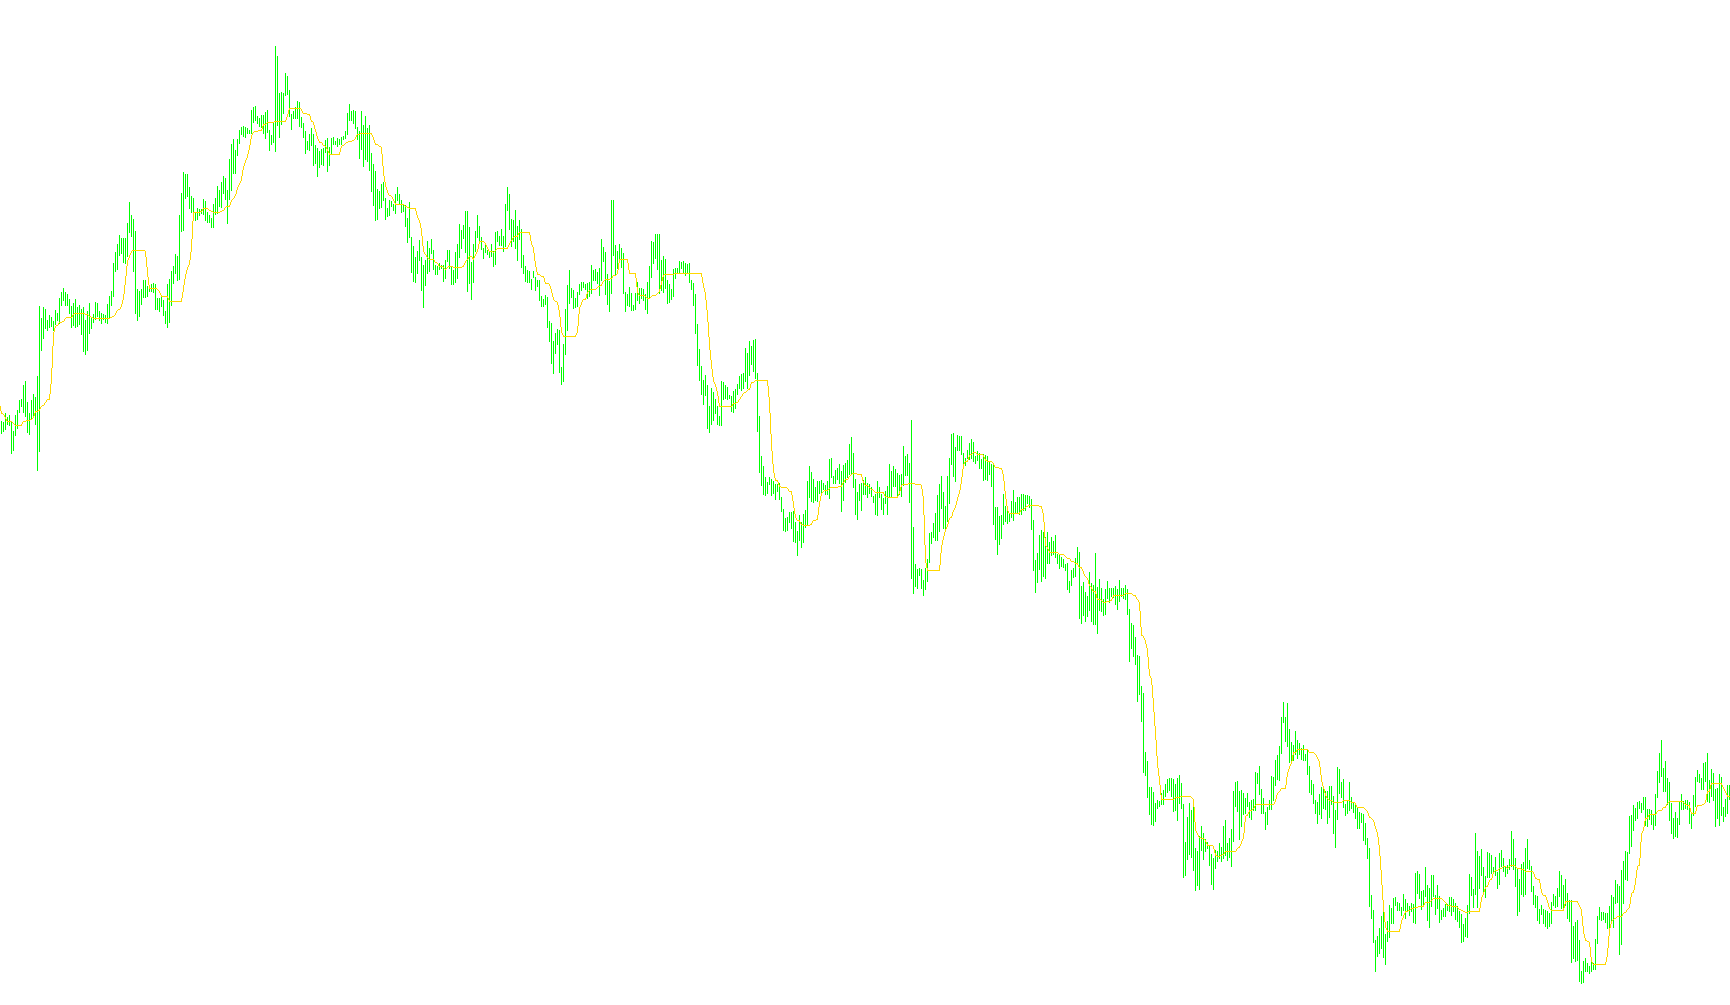
This indicator calculates a dynamic price path by blending previous values with real-time high-low fluctuations, constrained by a sensitivity threshold derived from historical range variance.
Real_Signal
Indicator

Real_Signal

iFractals

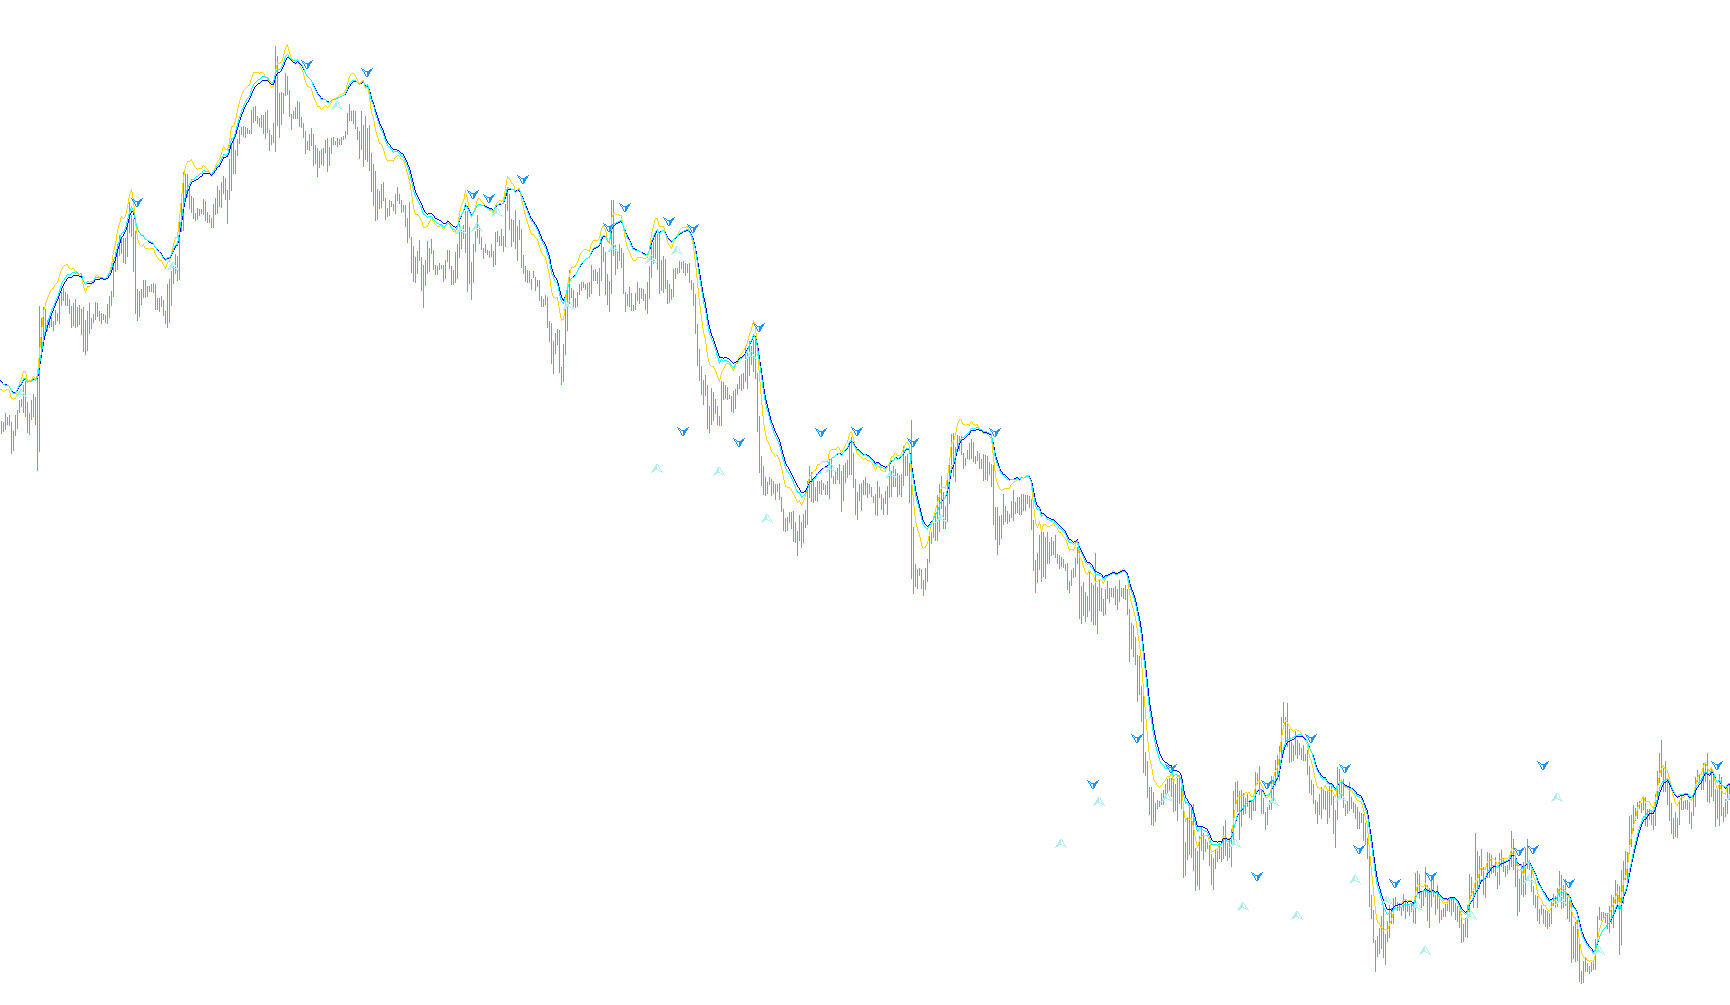
This indicator identifies potential market reversal zones by comparing current price opens against H1 and H4 fractal extremes while simultaneously mapping dynamic support and resistance levels.

RemainingTime_ja
Indicator

RemainingTime_ja

Calculates and displays the real-time remaining duration until the current price candle closes based on the selected timeframe.

renkolivechart_v600_indi
Indicator

renkolivechart_v600_indi

This indicator transforms standard price action into synthetic Renko bricks by calculating fixed-size price movement increments and exporting the resulting data to an external history file for seamless real-time visualization.

RenkoShade2
Indicator

RenkoShade2

This indicator overlays a Renko price action visualization directly onto standard timeframes by calculating fixed-size brick movements and rendering them as geometric objects.

RenkoShade2_1
Indicator

RenkoShade2_1

This indicator projects synthetic Renko bricks directly onto a standard timeframe chart by tracking price movements against a fixed point threshold to visualize market trend momentum without traditional candle noise.

RenkoShade2_3
Indicator

RenkoShade2_3

This indicator overlays synthetic Renko brick price action directly onto standard timeframes by calculating fixed-size price movements and rendering them as geometric objects.

renkotimev2
Indicator

renkotimev2

Quantifies the chronological interval elapsed between successive price blocks to measure the speed of formation.

renkotimev2ma
Indicator

renkotimev2ma

iMAOnArray

Quantifies the chronological duration between consecutive Renko bricks to visualize and smooth the rate of price formation over time.

Renko_Chart__From_Ticks
Indicator

Renko_Chart__From_Ticks

This script synthesizes price action into a non-time based Renko structure by evaluating real-time tick fluctuations against a fixed point threshold to generate discrete binary price movements.

renko_range_detector
Indicator

renko_range_detector

This indicator calculates and displays the real-time price displacement between the previous candle's open and close to determine the current Renko box size.

ReversalFractals
Indicator

ReversalFractals

This indicator identifies trend reversals by detecting 5-bar and 7-bar fractal peaks and troughs while alternating between bullish and bearish signals.

reversalnavi
Indicator

reversalnavi

This indicator identifies structural price pivot points and projects equilibrium levels to detect potential trend reversals based on multi-bar high-low range dynamics.

ReverseSymbol
Indicator

ReverseSymbol

This script performs real-time extraction of price data by calculating the mathematical inverse of market values and streaming them into a structured binary history file.

Indicator

rjt_matches

Rj_HSlice 1.1
Indicator

Rj_HSlice 1.1

This indicator maps historical buy and sell volume concentrations into a visual heatmap to identify price zones where significant order imbalances or high-frequency collisions occur.

Rj_Volume
Indicator

Rj_Volume

This indicator calculates the proportional distribution of buying and selling volume across specific price levels by decomposing candle geometry into relative intensity components.

road_map_v01
Indicator

road_map_v01

This indicator maps market structure by identifying fractal extremes to delineate impulsive waves, correction patterns, and automated Fibonacci retracement levels.

road_map_v04
Indicator

road_map_v04

rocv2.1
Indicator

rocv2.1

This indicator dynamically renders a comparative dashboard of real-time percentage fluctuations across multiple currency pairs, utilizing interactive navigation to switch between timeframes.

ROC_multi
Indicator

ROC_multi

This indicator calculates and visualizes the cumulative percentage price velocity across four distinct currency pairs simultaneously to identify aggregate market momentum.

ronz_higher_timeframe_high_n_low
Indicator

ronz_higher_timeframe_high_n_low

Projects high and low price boundaries from a specified dominant timeframe onto the current chart to identify structural liquidity zones.

ronz_price_ma_candle
Indicator

ronz_price_ma_candle

iMA

This indicator visualizes the smoothed extremes of candle geometry by mapping moving averages of open, close, high, and low prices to identify structural momentum.

RosyPipsIndicator
Indicator

RosyPipsIndicator

iSARiStochastic

This indicator identifies high-probability reversal entries by synchronizing Parabolic SAR crossovers with specific stochastic oscillators thresholds and price action body constraints.

RSI BNN Predictor
Indicator

RSI BNN Predictor

iRSI

This indicator utilizes a Backpropagation Neural Network (BPNN) to forecast future price action by training on normalized RSI data using Fibonacci-spaced historical delays.

rsi_2tf
Indicator

rsi_2tf

iRSI

This indicator synchronizes current timeframe price momentum with a higher temporal horizon to identify multi-layered trend strength and potential exhaustion points.

rsi_accumulated_ifloating_levelsp
Indicator

rsi_accumulated_ifloating_levelsp

iMAOnArray

This indicator synthesizes multiple RSI variations with a price filter and an accumulation period to identify dynamic upper and lower breakout levels.

Rsi_Bands_B
Indicator

Rsi_Bands_B

iATRiRSI

This indicator projects asymmetrical price corridors by modulating a Moving Average with Weighted RSI values scaled by ATR-based volatility variance.

Rsi_Bands_B2
Indicator

Rsi_Bands_B2

iATRiRSI

This indicator projects dynamic price envelopes by modulating a Moving Average with weighted RSI intensity and ATR-based volatility coefficients.

rsi_filter
Indicator

rsi_filter

iMAOnArrayiRSI

This indicator applies a Smoothed Moving Average to the Relative Strength Index values to isolate underlying momentum trends while minimizing market noise.

rsi_gold_silver
Indicator

rsi_gold_silver

iRSI

This indicator synthesizes the Relative Strength Index values of Gold and Silver to calculate a mean-reverting representative momentum line.

RSI_MA
Indicator

RSI_MA

iMA

This indicator calculates the Relative Strength Index and modulates its value by the point difference of a weighted exponential moving average to highlight velocity changes.

rsi_ma_trade_sist
Indicator

rsi_ma_trade_sist

iATRiMAiRSI

This indicator identifies trend reversals by detecting concurrent EMA crossovers and RSI threshold breaches to confirm momentum shifts.

rsi_ma_trade_sist_chart
Indicator

rsi_ma_trade_sist_chart

iATRiMAiRSI

This indicator identifies trend reversals by detecting crossovers between a fast and slow exponential moving average synchronized with Relative Strength Index momentum thresholds.

RSI_Mirror
Indicator

RSI_Mirror

iRSI

This indicator calculates the mathematical variance between Close-based and Open-based RSI values to isolate momentum discrepancies.

rsi_monitor
Indicator

rsi_monitor

iRSI

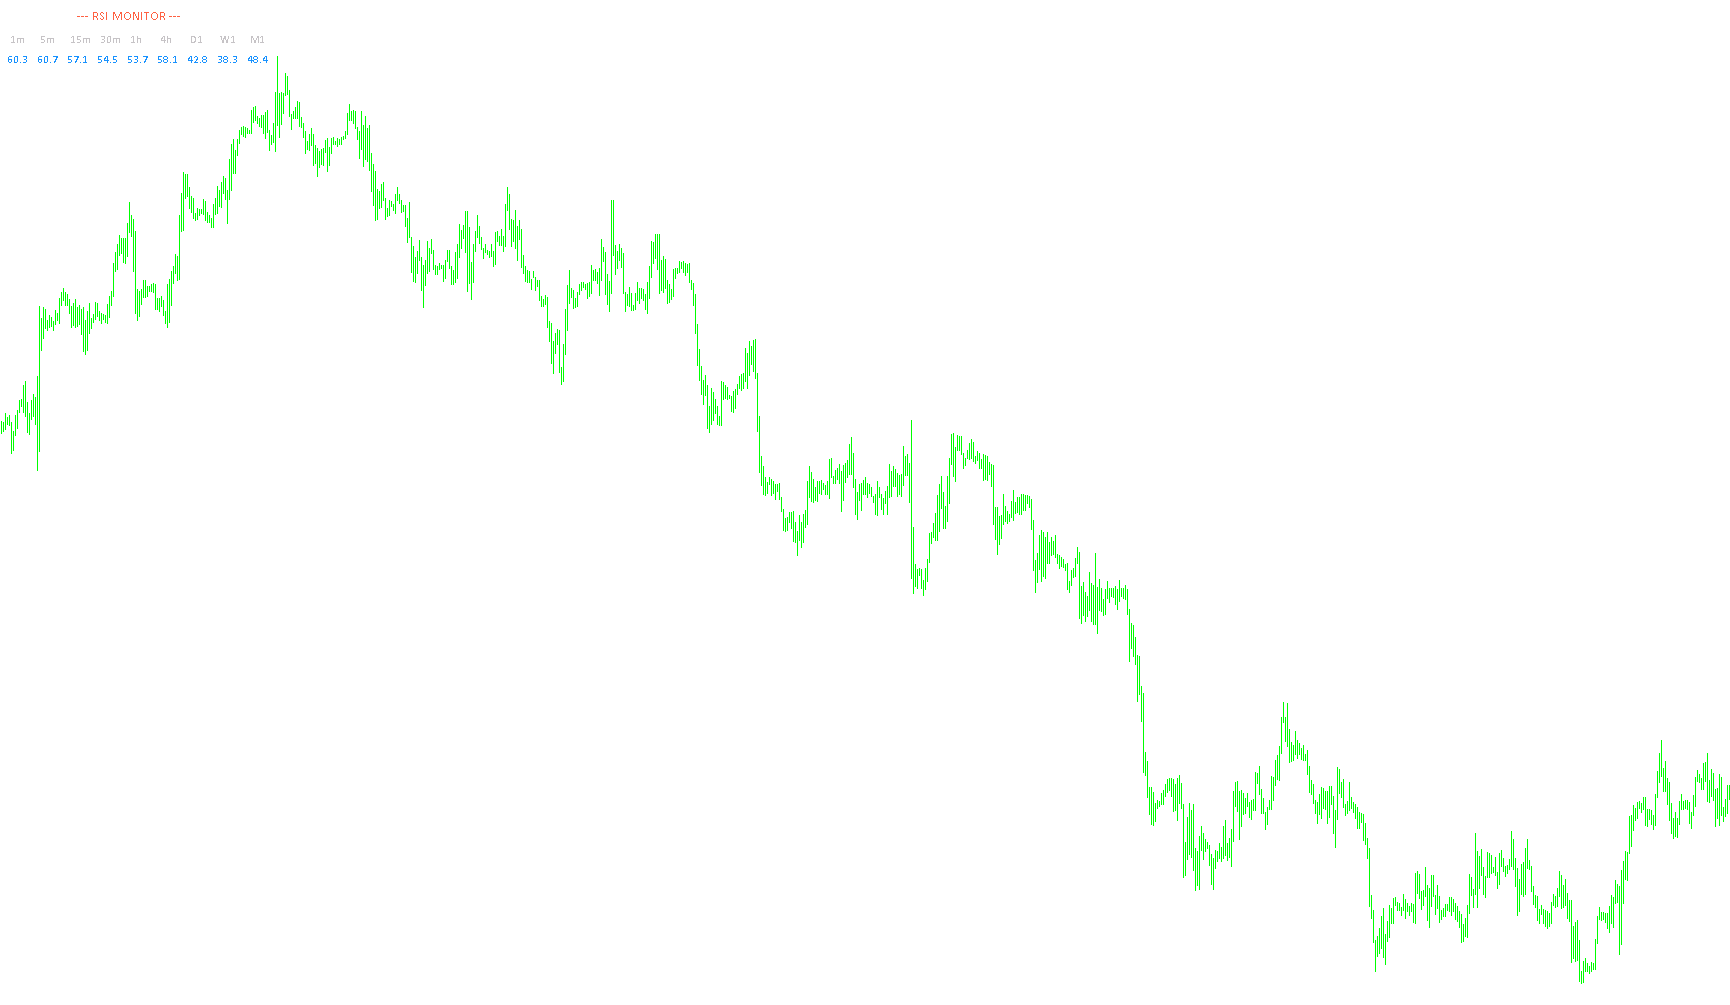
A consolidated visual dashboard that tracks Relative Strength Index values across nine concurrent timeframes with automated push, email, and audio alerts for overbought or oversold conditions.

RSI_Peak_and_Bottom
Indicator

RSI_Peak_and_Bottom

iRSI

This indicator dynamically identifies local extrema by detecting structural reversals in momentum values to highlight potential price exhaustion zones.

rsi_ts
Indicator

rsi_ts

iRSI

This indicator visualizes the Relative Strength Index while dynamically marking extreme momentum exhaustion points via arrow signals when values breach predefined upper and lower boundaries.

RSO
Indicator

RSO

Quantifies the relative intensity of upward versus downward price movements to visualize trend momentum and exhaustion points.

Indicator

RS_FRASMA

iMA
RunMedian
Indicator

RunMedian

Calculates a rolling median of the price midpoints using an incremental sorting algorithm to provide a smooth, lag-reduced trend line.

SAR Color
Indicator

SAR Color

iSAR

This indicator dynamically bifurcates the Parabolic SAR into distinct directional visual signals by comparing price action against high-point resistance thresholds.

SAR oscillator
Indicator

SAR oscillator

iSAR

This indicator calculates the real-time distance between current price action and Parabolic SAR values to visualize momentum shifts and trend exhaustion via a dual-histogram visualizer.

saveticks
Indicator

saveticks

This indicator captures intra-candle price fluctuations and volume metrics to export them into a dedicated high-frequency historical binary file while maintaining a secondary visualization window.

SayaBarCrossView
Indicator

SayaBarCrossView

iMAOnArray

This indicator quantifies price discrepancy by calculating the absolute normalized point difference between the current symbol and a secondary currency pair, smoothed via a moving average.

SayaBarView
Indicator

SayaBarView

This indicator quantifies the absolute price variance between the current active pair and a specified secondary currency pair, visualized as a historical histogram.

SayaView
Indicator

SayaView

This indicator visualizes real-time price disparities and absolute tick differentials between the current chart symbol and a user-defined secondary currency pair.

sbvolumeavg
Indicator

sbvolumeavg

Quantifies mean trading intensity by calculating average tick volume within distinct zigzag-identified swing price boundaries.

Schaff Trend s
Indicator

Schaff Trend s

iMAiMAOnArray

This indicator quantifies trend momentum by calculating a smoothed percentage of the distance between two exponential moving averages relative to their recent range.

Schaff_Trend_Cycle_-_adjustable_smoothing
Indicator

Schaff_Trend_Cycle_-_adjustable_smoothing

iMA

This indicator computes a double-smoothed stochastic cycle by applying sequential momentum filtering to MACD values, providing a smoothed trend velocity signal with multi-timeframe interpolation.