Indicator

Laguerre_RSI_v1.01m_mtf

iMA
Indicator

Laguerre_RSI_v1.01_mtf

iMA

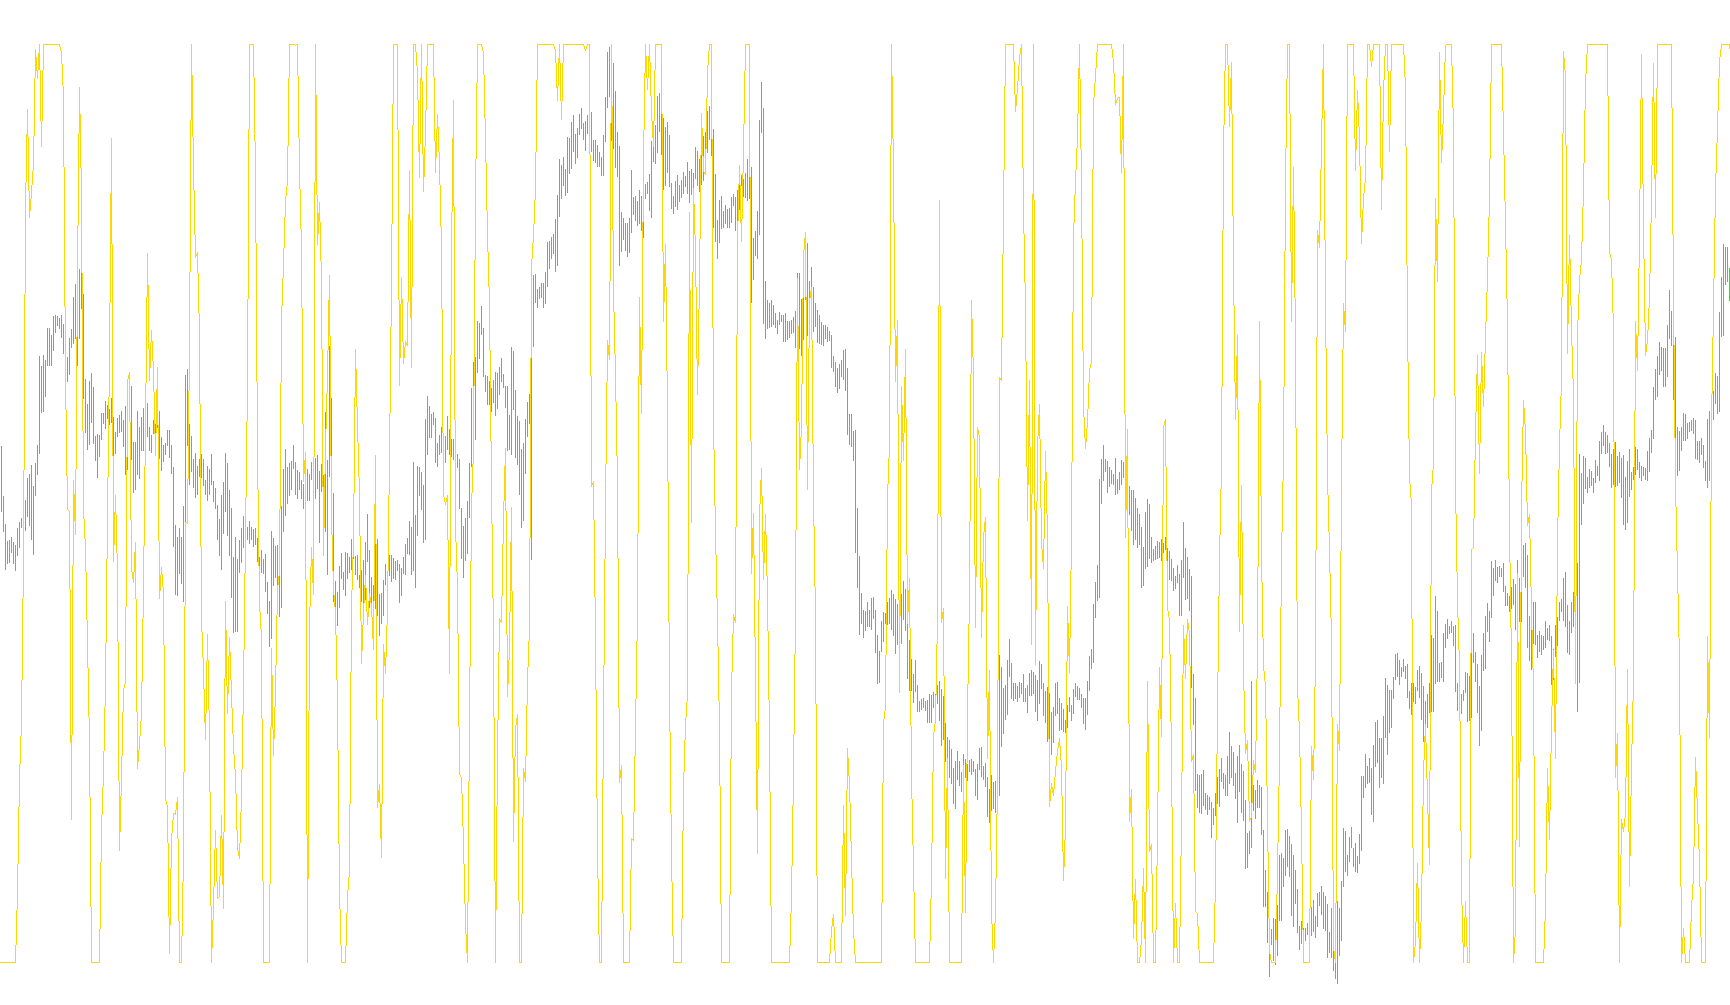
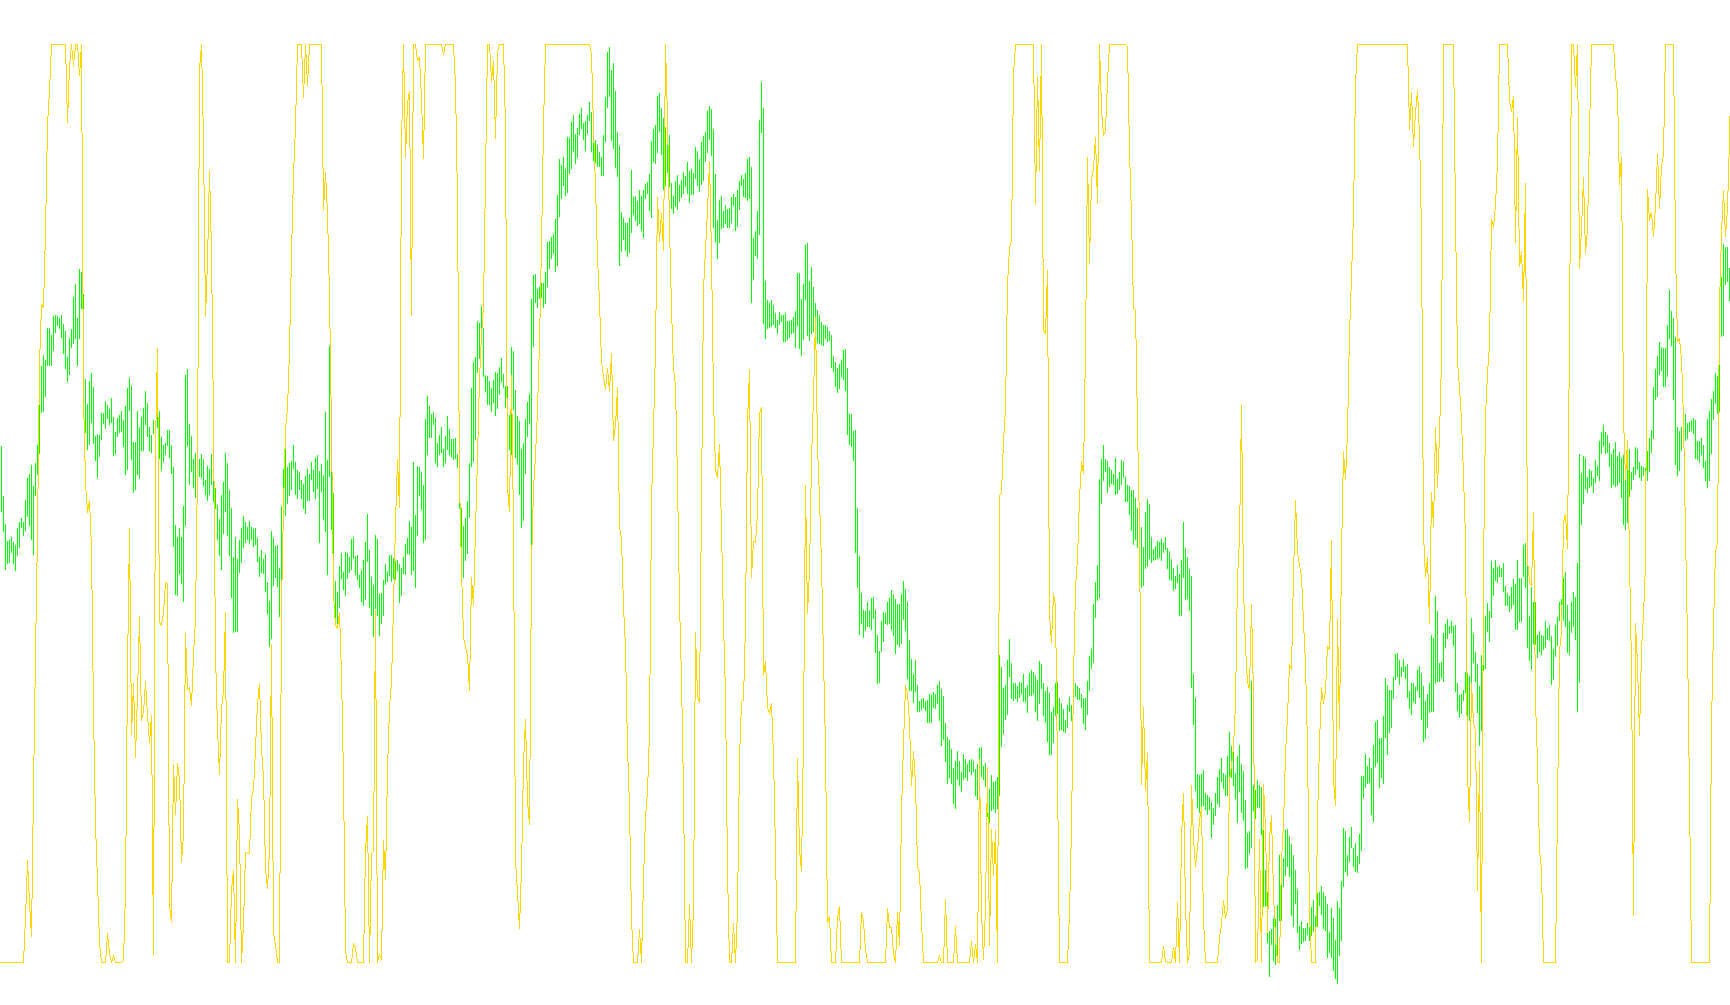
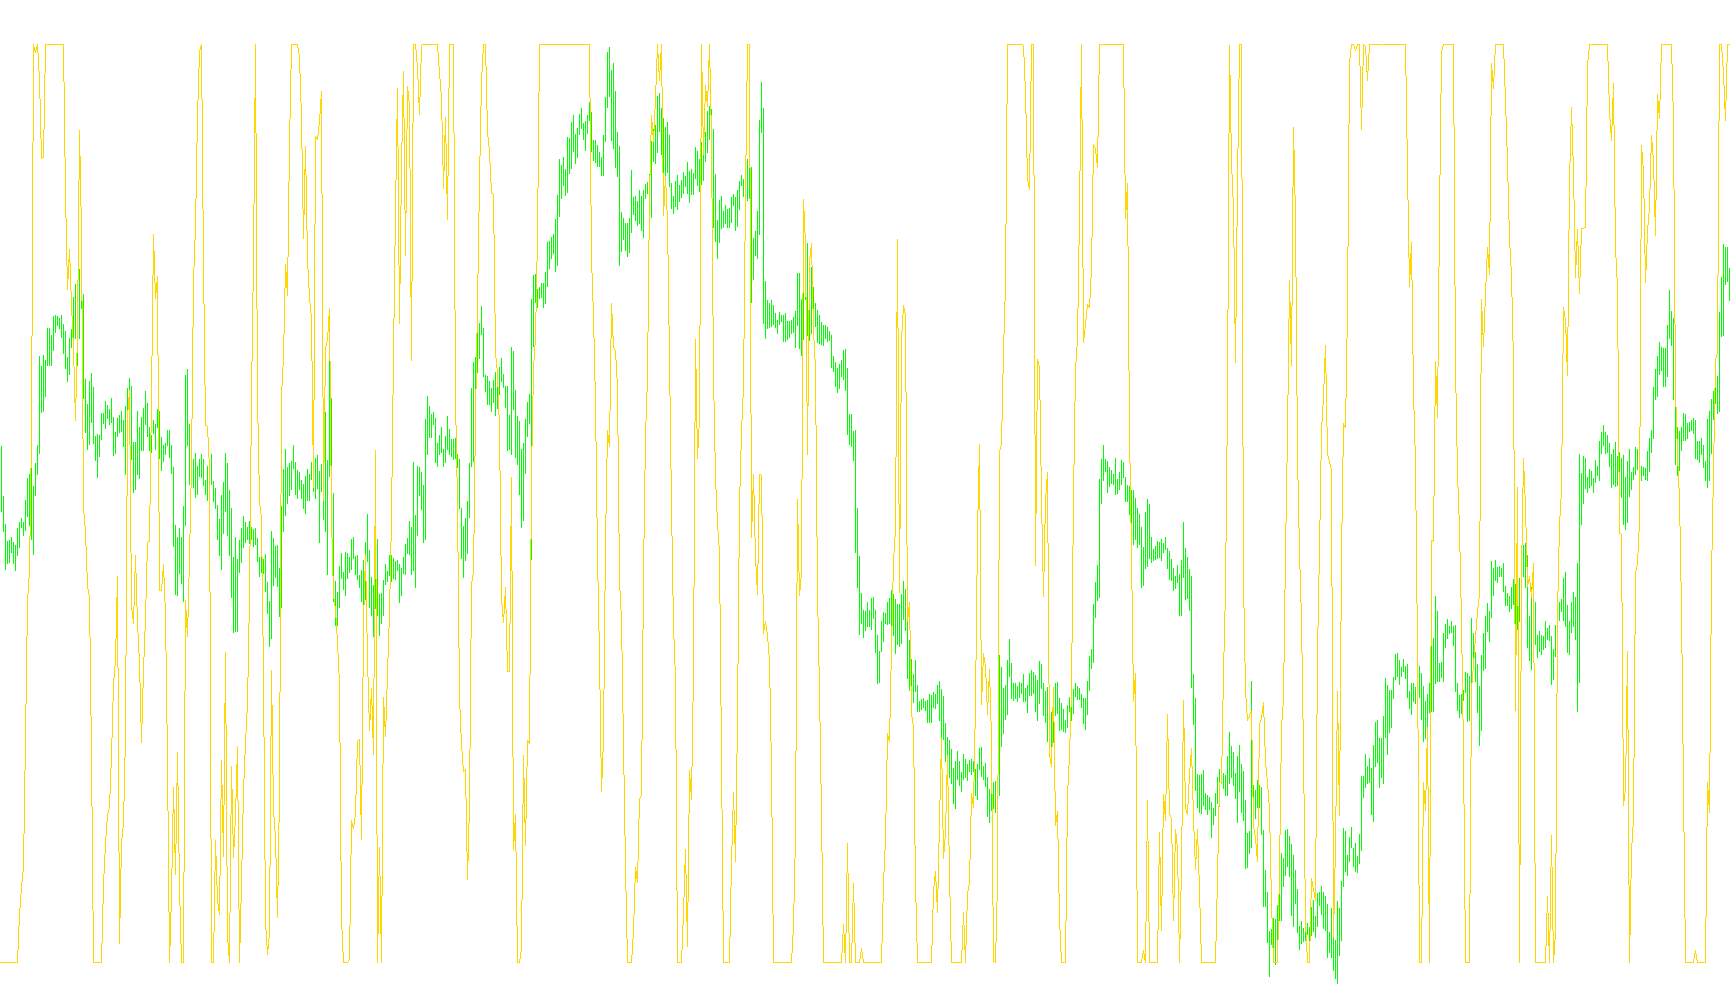
This indicator calculates a smoothed Laguerre RSI, displays it with customizable levels, and generates alerts when the RSI crosses those levels, optionally sending notifications via pop-up, email, or sound.

Laguerre_v1
Indicator

Laguerre_v1

This indicator computes a specialized momentum ratio by calculating the relative weight of cumulative positive and negative differences across four recursive Laguerre filters.

Laguerre_v2
Indicator

Laguerre_v2

This indicator computes a momentum oscillator by normalizing the cumulative differences of sequential Laguerre polynomial recursive values.

Laguerre_v4
Indicator

Laguerre_v4

This indicator calculates a bounded momentum value by applying a recursive Laguerre filter to price data and determining the ratio of positive to negative directional changes.

Laguerre_v5
Indicator

Laguerre_v5

This indicator calculates a proprietary momentum ratio by weighing the cumulative differences between sequential Laguerre polynomial components to identify price velocity.

Laguerre_v6
Indicator

Laguerre_v6

This algorithm utilizes a recursive four-layer smoothing technique to calculate a custom momentum ratio derived from the price variance between nested differential values.

Laguerre_v7
Indicator

Laguerre_v7

This indicator computes a smoothed relative strength index by calculating the ratio of cumulative upward movements to total price flux using Laguerre recursive polynomials.

Laguerre_v8
Indicator

Laguerre_v8

This indicator utilizes Laguerre functions and weighted recursive filtering to calculate a relative strength momentum value based on the cumulative differences of consecutive price levels.

lagurre cross 01
Indicator

lagurre cross 01

This indicator identifies trend reversal points by detecting crossovers in a specialized Lagurre-based relative strength index that evaluates price momentum transitions.

lagurre cross 01_v1
Indicator

lagurre cross 01_v1

Identifies bullish and bearish reversals by detecting specific crossover thresholds in a recursive momentum calculation based on the Lagurre algorithm.

LargeTimeFrame
Indicator

LargeTimeFrame

This indicator projects historical candle bodies and price ranges from a higher timeframe onto the current chart for concurrent structural analysis.

LastDayHighLow
Indicator

LastDayHighLow

This indicator projects horizontal levels representing the previous day's maximum and minimum price extremes onto the current chart.

Latest Alert_1
Indicator

Latest Alert_1

This indicator triggers automated mail and audio notifications when the live market price exceeds user-defined extremes during specific time windows.

LBS
Indicator

LBS

A foundational structural template designed for modular automated trading integration and custom logic deployment.
LCD
Indicator

LCD

iMA

This indicator quantifies trend strength by calculating the relative position of price against both Exponential Moving Averages and Linear Weighted Moving Averages to detect momentum shifts.
LC_FibonacciDaily
Indicator

LC_FibonacciDaily

This indicator dynamically calculates daily pivot points and symmetry levels by combining arithmetic mean price averages with Fibonacci retracement ratios.

LC_FibonacciDaily_v1
Indicator

LC_FibonacciDaily_v1

This indicator calculates daily pivot points and corresponding Fibonacci retracement levels based on the previous day's high, low, and closing price.

Leading
Indicator

Leading

This indicator implements a multi-stage recursive filtering algorithm to project trend momentum by smoothing price midpoints through specific alpha coefficients.

Least Square MA
Indicator

Least Square MA

This indicator calculates a weighted moving average where price data is multiplied by its chronological distance from the period start to highlight dynamic momentum shifts.

Least Square MA_v1
Indicator

Least Square MA_v1

The indicator calculates a weighted cumulative sum of price action to determine directional momentum shifts through linear distribution.

Least%20Square%20MA
Indicator

Least%20Square%20MA

This indicator calculates a weighted moving average by applying a linear variance coefficient to historical price data to visualize directional momentum shifts.

LeManChanel
Indicator

LeManChanel

This indicator identifies dynamic price boundaries by projecting the maximum historical range of the preceding bars onto the current closing price.

LeManSignal
Indicator

LeManSignal

The logic identifies bullish and bearish reversal points by comparing localized peak and trough height disparities across consecutive fractal segments.

LeManStop
Indicator

LeManStop

iMA

This indicator calculates a dynamic trailing stop level by projecting historical price volatility against current exponential moving average trends.

LeManSystem
Indicator

LeManSystem

The indicator identifies bullish and bearish price reversals by detecting instances where price action breaks through previous multi-bar swing highs and lows.

LeManTrend
Indicator

LeManTrend

iMAOnArray

This indicator quantifies relative price volatility by calculating the cumulative deviation between current bar extremes and multi-period high/low peaks, smoothed via an exponential moving average.

Indicator

Level Trading

Levels
Indicator

Levels

This indicator projects symmetrical price levels based on previous candle volatility by switching between three distinct Fibonacci expansion ratios depending on the range of the preceding bar.

Levels_A_Vlad_3
Indicator

Levels_A_Vlad_3

This indicator projects a series of recursive support and resistance levels derived from price action extremes using variable coefficient multipliers.

Levels_Nikita_en
Indicator

Levels_Nikita_en

This indicator identifies structural pivot points to project time-price symmetry, featuring multi-layered channel analysis, mirrored branch expansions, and harmonic Fibonacci retracements based on the 'Price and Time' theory.

level_sensor_116
Indicator

level_sensor_116

This indicator identifies high-frequency price intersection zones by calculating and visualizing the density of overlapping candle bodies across a specified historical range.

Indicator

Level_Trading

Indicator

level_trading_123

LGP-Pivot DJ
Indicator

LGP-Pivot DJ

Calculates and displays distinct pivot point levels for the European and US markets by identifying price extremes within specific time-defined intervals.

LGP-Pivot%20DJ-2
Indicator

LGP-Pivot%20DJ-2

This indicator dynamically calculates and displays specific pivot points, high, low, and close prices for distinct European and American trading sessions based on user-defined hourly offsets.

LGP_Ivanoff_Maloma-Demark_Levels
Indicator

LGP_Ivanoff_Maloma-Demark_Levels

This indicator identifies structural reversal points by detecting consecutive identical closing prices that break previous local highs or lows across various temporalities.

Indicator

LibDerksUtils

LibNewsTimes_v02
Indicator

LibNewsTimes_v02

Analyzes a local CSV data source to determine if current market conditions fall within a user-defined buffer period surrounding scheduled economic announcements for specific currency pairs.

Indicator

lib_display

Lida1
Indicator

Lida1

This indicator aggregates real-time trade data across multiple currency pairs to visualize net profitability, weighted averages, and overhead costs including swaps and commissions.

lil_youngin86
Indicator

lil_youngin86

iMA

This indicator visualizes directional momentum by calculating the divergence between two simple moving averages based on median and close prices, rendering a histogram that shifts color based on velocity changes.

Linear Price Bar
Indicator

Linear Price Bar

This indicator visualizes price deviation from the opening price by mapping high, low, and closing extremes as historical histogram bars.

Linear Price Bar_v1
Indicator

Linear Price Bar_v1

The indicator quantifies price action by mapping the absolute distance of high, low, and close prices relative to each candle's opening price into a visual histogram.

Linear Price Bar_v2
Indicator

Linear Price Bar_v2

This indicator visualizes the magnitude of price action relative to the opening price by mapping bullish and bearish deviations into distinct histogram buffers.

Indicator

Linear Regression Channels Different

Linear Regression Line
Indicator

Linear Regression Line

This indicator calculates a mathematical line of best fit by applying the least squares method to historical closing prices over a fixed temporal window.

Linear Regression Line2
Indicator

Linear Regression Line2

This indicator calculates a linear regression path by applying the least squares method to historical closing prices to determine the underlying mathematical trend.

Linear Regression Line2_v1
Indicator

Linear Regression Line2_v1

This indicator calculates a best-fit trendline by applying the least squares method to map a linear trajectory over a specific lookback period of closing prices.

Linear Regression Line_v1
Indicator

Linear Regression Line_v1

This indicator calculates a mathematical best-fit line using the least squares method to project historical price trends and identify underlying momentum.