lagurre cross 01
Download script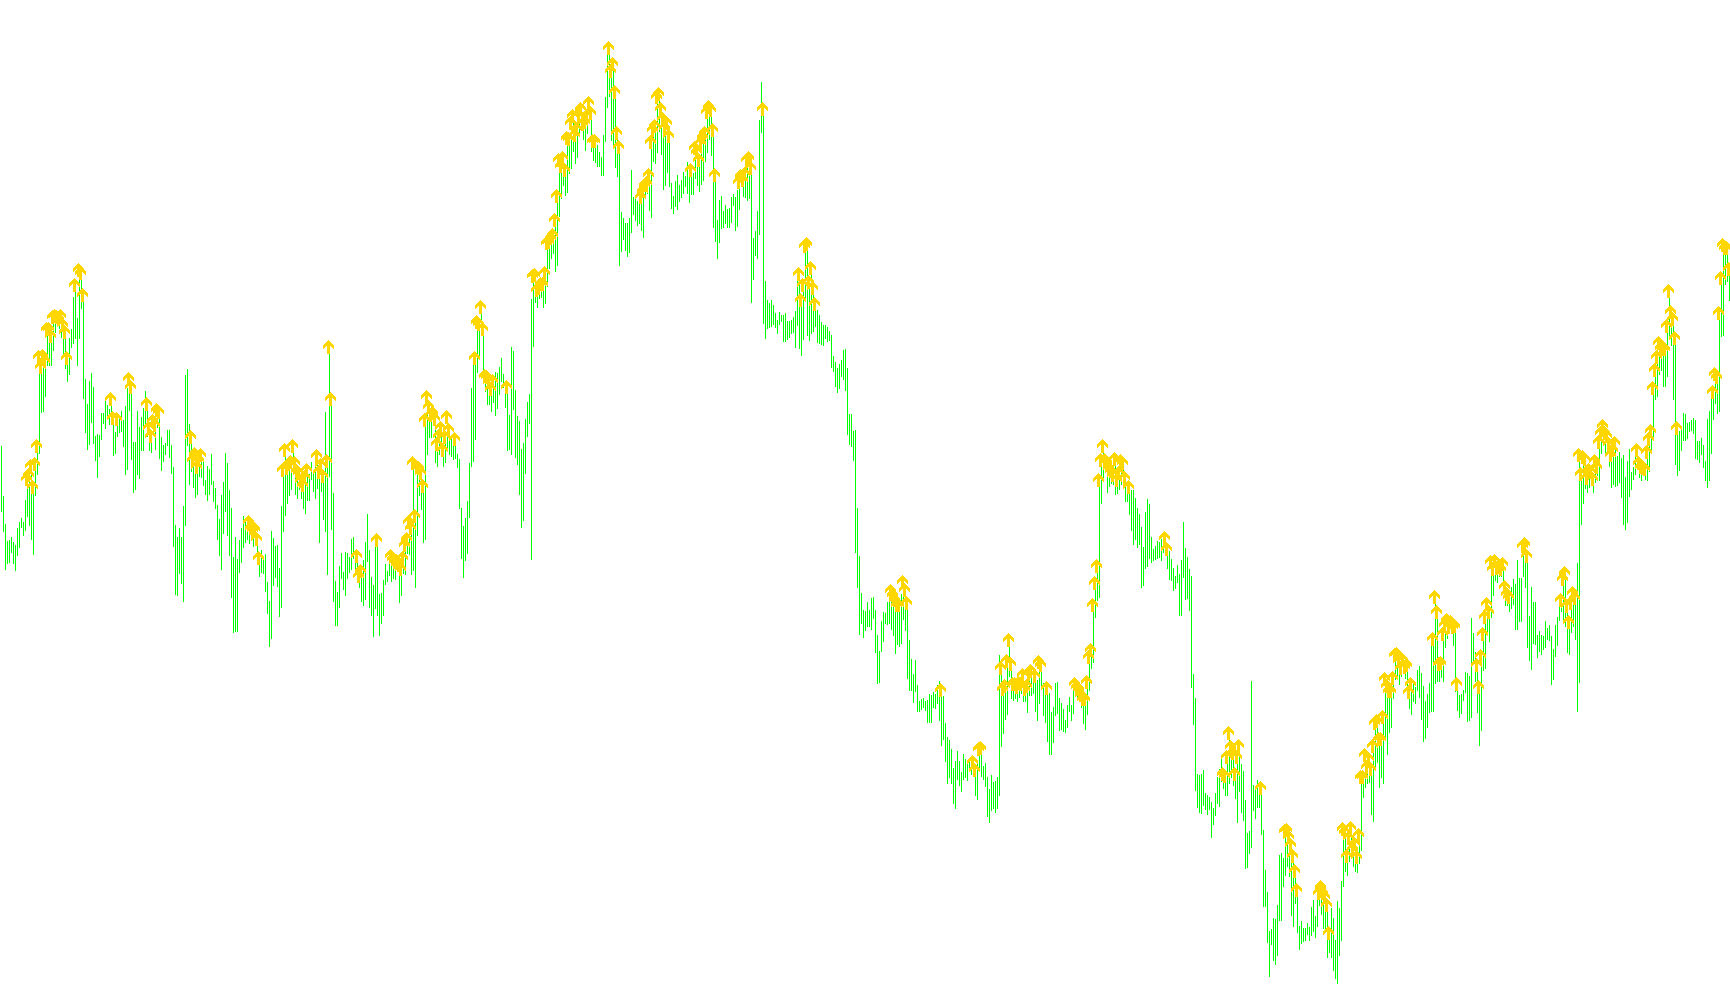
This tool is designed to provide visual signals on a trading chart by identifying specific shifts in market momentum. Rather than using standard indicators that might lag behind price movements, this script utilizes a specialized mathematical formula known as the Laguerre RSI to detect transitions between bullish and bearish trends.
How it Works
The logic operates by constantly calculating a normalized value between 0 and 1 based on recent price action. This value represents the "momentum" of the market at any given moment:
- Trend Detection: The script monitors how the price is moving relative to its recent history. It looks for specific "crossovers"—moments where the momentum shifts from one extreme to another.
- The 0.5 Threshold: The script uses a midpoint of 0.5 as the primary decision line.
- When the momentum value climbs above 0.5, it suggests an upward trend is forming.
- When the momentum value drops below 0.5, it suggests a downward trend is forming.
Visual Signals
Instead of drawing complex lines or clouds that can clutter your screen, this script simplifies information into clear, actionable visual cues:
- Bullish Signals (Up Arrows): The tool places a white arrow on the chart when the momentum value crosses from below 0.5 to above 0.5. This indicates a potential shift toward an upward movement.
- Bearish Signals (Down Arrows): The tool places a red arrow on the chart when the momentum value crosses from above 0.5 to below 0.5. This indicates a potential shift toward a downward movement.
Key Features for Traders
- Clean Visualization: By using arrows rather than continuous lines, it helps traders quickly identify "turning points" without being distracted by market noise.
- Smooth Transitions: The underlying Lagurre calculation is designed to be more responsive than many standard RSI settings, aiming to capture momentum changes more effectively while maintaining a smooth reading.
- Automatic Analysis: The script automatically scans historical data to plot these signals, allowing you to see where previous trend shifts occurred at a glance.
Price Data Components
Miscellaneous
8
Views
0
Downloads
0
Favorites
lagurre cross 01
/*-----------------------------+
|			       |
| Shared by www.Aptrafx.com    |
|			       |
+------------------------------*/

//+------------------------------------------------------------------+
//| 5 Min RSI 12-period qual INDICATOR                               |
//+------------------------------------------------------------------+
#property copyright "Ron T"
#property link      "http://www.lightpatch.com"

#property indicator_chart_window
#property indicator_buffers 2

#property indicator_color1 White
#property indicator_color2 Red


//---- buffers
double Buffer1[];
double Buffer2[];


extern double gamma=0.5;

double L0 = 0;
double L1 = 0;
double L2 = 0;
double L3 = 0;
double L0A = 0;
double L1A = 0;
double L2A = 0;
double L3A = 0;
double LRSI = 0;
double CU = 0;
double CD = 0;

// User Input


//+------------------------------------------------------------------+
//| Custom indicator initialization function                         |
//|------------------------------------------------------------------|

int init()
  {

   // 233 up arrow
   // 234 down arrow
   // 159 big dot
   // 158 little dot
   // 168 open square
   // 120 box with X

   SetIndexStyle(0,DRAW_ARROW);
   SetIndexBuffer(0, Buffer1);
   SetIndexArrow(0,233);

   SetIndexStyle(1,DRAW_ARROW);
   SetIndexBuffer(1, Buffer2);
   SetIndexArrow(1,234);

   return(0);
  }


//+------------------------------------------------------------------+
//| Custor indicator deinitialization function                       |
//+------------------------------------------------------------------+
int deinit()
  {
   int i;
   for( i=0; i<Bars; i++ ) Buffer1[i]=0;
   for( i=0; i<Bars; i++ ) Buffer2[i]=0;
   return(0);
  }


//+------------------------------------------------------------------+
//| Custom indicator iteration function                              |
//+------------------------------------------------------------------+

// Current position if 55/45 or over/under. Does any of
// the previous 'qual' period ever fall below55/above45? (last11)
//
// If qual*2 periods have been above55/below45
// then lets not try to transact any more (last22)


int start()
  {
   int      pos=Bars-100; // leave room for moving average periods
   int      ctr=0;

   bool     rising=false;
   bool    falling=false;

   double p=Point();

   double lpc, lpp;

   while(pos>=1)
     {

      lpc=lagurre(pos);
      //lpp=lagurre(pos+1);

      // rising
      if (lpp<0.5 && lpc>0.5){Buffer1[pos]=High[pos];}

      //falling
      if (lpp>0.5 && lpc<0.5) {Buffer2[pos]=Low[pos];}

 	   pos--;
     }

   return(0);
  }


double lagurre (int i)
  {
   L0A = L0;
   L1A = L1;
   L2A = L2;
   L3A = L3;
   L0 = (1 - gamma)*Open[i] + gamma*L0A;
   L1 = - gamma *L0 + L0A + gamma *L1A;
   L2 = - gamma *L1 + L1A + gamma *L2A;
   L3 = - gamma *L2 + L2A + gamma *L3A;

   CU = 0;
   CD = 0;

   if (L0 >= L1) CU = L0 - L1;      else CD = L1 - L0;
   if (L1 >= L2) CU = CU + L1 - L2; else CD = CD + L2 - L1;
   if (L2 >= L3) CU = CU + L2 - L3; else CD = CD + L3 - L2;

   if (CU + CD != 0) LRSI = CU / (CU + CD);
   return(LRSI);
  }
Comments