LCD
Download script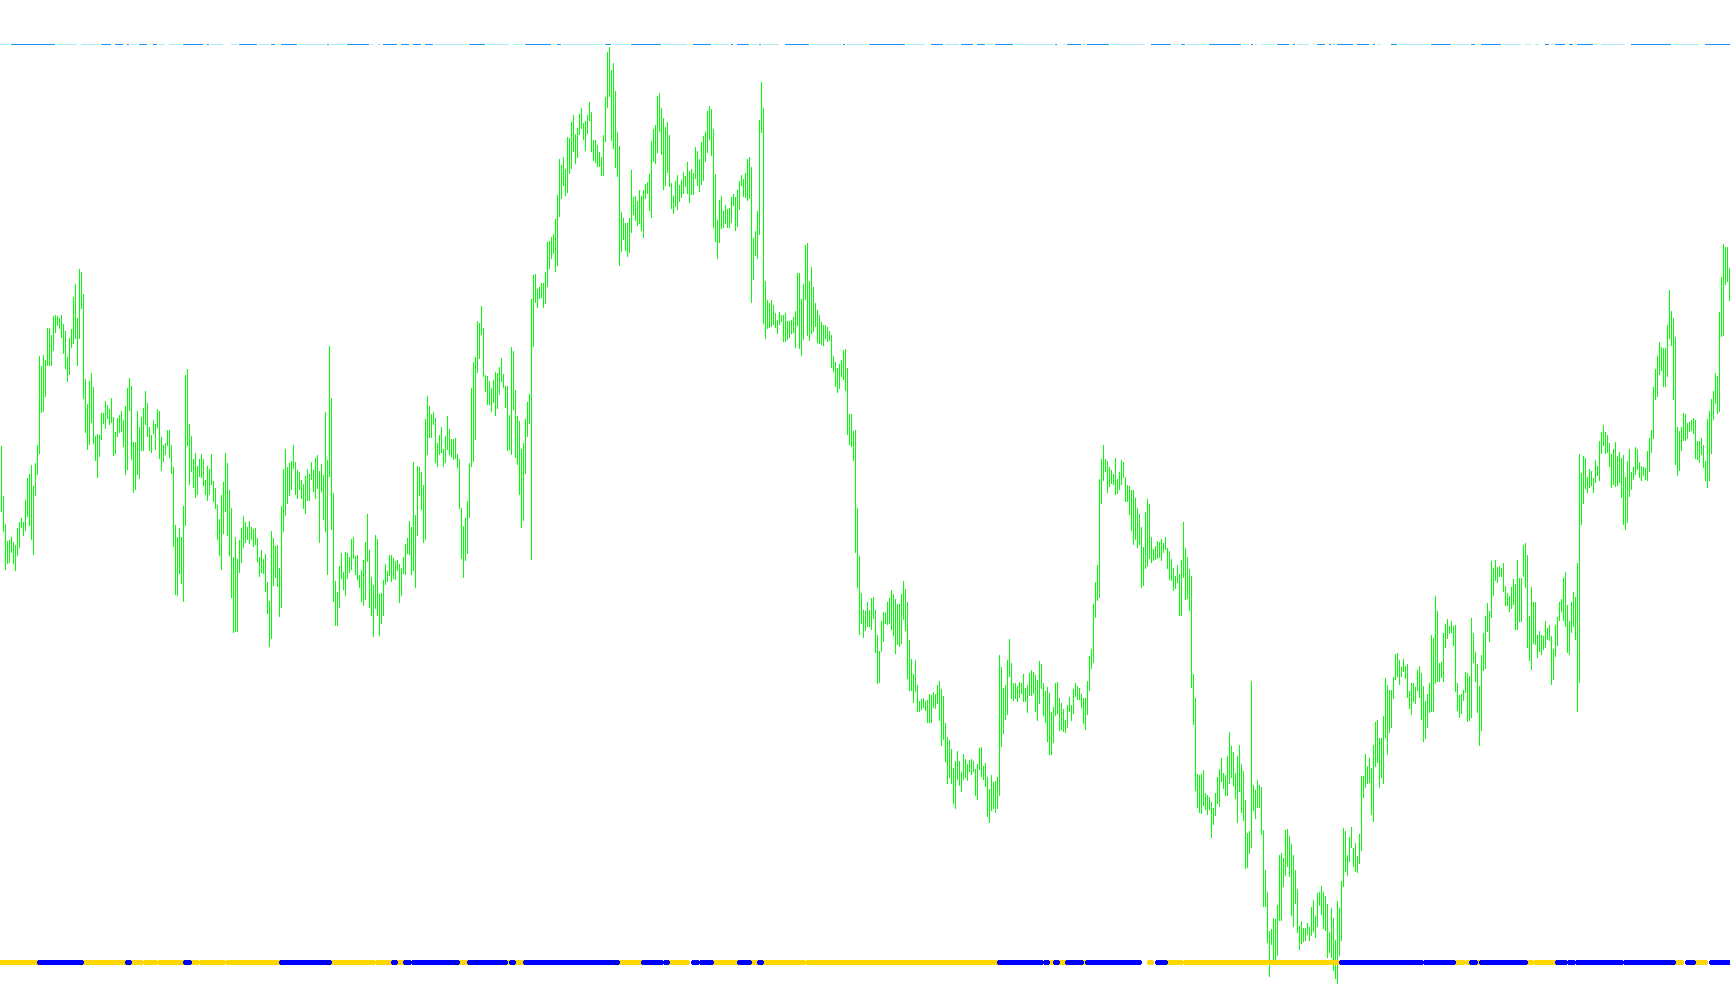
This script is designed as a technical analysis tool for the MetaTrader trading platform. Its primary purpose is to visualize the relationship between current market prices and two specific types of moving averages: the Exponential Moving Average (EMA) and the Linear Weighted Moving Average (LSMA). By comparing these trends against price action, the tool helps traders identify potential momentum shifts and entry/exit points.
Core Operational Logic
The script operates by constantly calculating and monitoring four distinct data streams based on the following logic:
1. Exponential Trend Analysis (EMA) The tool calculates an Exponential Moving Average over a user-defined period. This specific type of average gives more weight to recent price data, making it highly responsive to new market information. The script monitors two conditions:
- When the current closing price sits above this average, it triggers a specific signal.
- When the current closing price falls below this average, it triggers an opposing signal.
2. Linear Weighted Trend Analysis (LSMA) In addition to the EMA, the script calculates a Linear Weighted Moving Average. Unlike a simple average, the LSMA applies a linear weighting factor where the most recent prices have the highest impact on the final value. The script evaluates this trend using the same logic as the EMA—detecting instances where the price crosses over or under the calculated weighted line.
3. Signal Visualization The script translates these mathematical comparisons into visual data displayed in a separate window on your chart. Instead of showing complex numbers, it simplifies the data into distinct lines:
- High-Priority Signals: When the price is significantly above or below the moving averages, the script assigns a very high numerical value to the signal buffer. This creates a visible "breakout" or "trigger" point on the indicator window.
- Baseline Positioning: The tool uses a "distance from zero" parameter. This ensures that the indicators remain organized and readable, providing a clear visual gap between the baseline and the active signals.
Summary for the Trader
Essentially, this tool acts as a momentum filter. It looks at how the current price is behaving relative to two different "smoothed" versions of recent history. By observing where these lines jump or shift relative to the zero level, traders can visually confirm whether the market is currently showing strength (bullish) or weakness (bearish) based on both responsive (EMA) and weighted (LSMA) trends.
//+------------------------------------------------------------------+
//|                                              LCD BUYSELL.mq4 |
//|                                                   |
//|                                     |
//+------------------------------------------------------------------+
#property copyright "Copyright © 2006, MetaQuotes Software Corp."
#property link "http://www.stealthforex.com"

#property indicator_separate_window
#property indicator_buffers 4
#property indicator_color1 Yellow
#property indicator_color2 Blue
#property indicator_color3 Black
#property indicator_color4 Black

//------- External parameters ------------------------------------------

extern int EMAPeriod = 34; //Period EMA
extern int LSMAPeriod = 25; // Period LSMA
extern int FromZero = 3; // Distance from the zero level

//------- Buffers of the indicator ------------------------------------------

double gda_88[];
double gda_92[];
double gda_96[];
double gda_100[];

//+------------------------------------------------------------------+
//| Custom indicator initialization function |
//+------------------------------------------------------------------+
void init() {
  IndicatorDigits(2);
  SetIndexBuffer(0, gda_88);
  SetIndexLabel(0, "EMA higher than price");
  SetIndexStyle(0, DRAW_LINE, STYLE_SOLID, 5);
  SetIndexBuffer(1, gda_92);
  SetIndexLabel(1, "EMA lower than price");
  SetIndexStyle(1, DRAW_LINE, STYLE_SOLID, 5);
  SetIndexBuffer(2, gda_96);
  SetIndexLabel(2, "LSMA higher than price");
  SetIndexStyle(2, DRAW_LINE, STYLE_SOLID, 1);
  SetIndexBuffer(3, gda_100);
  SetIndexLabel(3, "LSMA lower than price");
  SetIndexStyle(3, DRAW_LINE, STYLE_SOLID, 1);
  Comment("Special Projects and Defence Limited");
}

//+------------------------------------------------------------------+
//| Custom indicator iteration function |
//+------------------------------------------------------------------+
int start() {
  double ld_0;
  double ld_8;
  double ld_16;
  double ld_24;
  double l_ima_52;
  int li_40 = IndicatorCounted();
  if (li_40 < 0) return;
  if (li_40 > 0) li_40--;
  li_40 = Bars - li_40;
  for (int li_36 = 0; li_36 < li_40; li_36++) {
    gda_92[li_36] = -FromZero;
    gda_88[li_36] = -FromZero;
    l_ima_52 = iMA(NULL, 0, EMAPeriod, 0, MODE_EMA, PRICE_TYPICAL, li_36);
    if (Close[li_36] > l_ima_52) gda_88[li_36] = 2147483647;
    if (Close[li_36] < l_ima_52) gda_92[li_36] = 2147483647;
  }
  int li_44 = Bars - LSMAPeriod - 5;
  int li_48 = li_44 - LSMAPeriod - 1;
  for (li_36 = li_48; li_36 >= 0; li_36--) {
    ld_0 = 0;
    for (int li_32 = LSMAPeriod; li_32 >= 1; li_32--) {
      ld_8 = LSMAPeriod + 1;
      ld_8 /= 3.0;
      ld_16 = 0;
      ld_16 = (li_32 - ld_8) * (Close[LSMAPeriod - li_32 + li_36]);
      ld_0 += ld_16;
    }
    ld_24 = 6.0 * ld_0 / (LSMAPeriod * (LSMAPeriod + 1));
    //+------------------------------------------------------------------+

    gda_96[li_36] = FromZero;
    gda_100[li_36] = FromZero;
    if (ld_24 > Close[li_36]) gda_100[li_36] = 2147483647;
    if (ld_24 < Close[li_36]) gda_96[li_36] = 2147483647;
  }
  return (0);
}
Comments