Laguerre_v8
Download script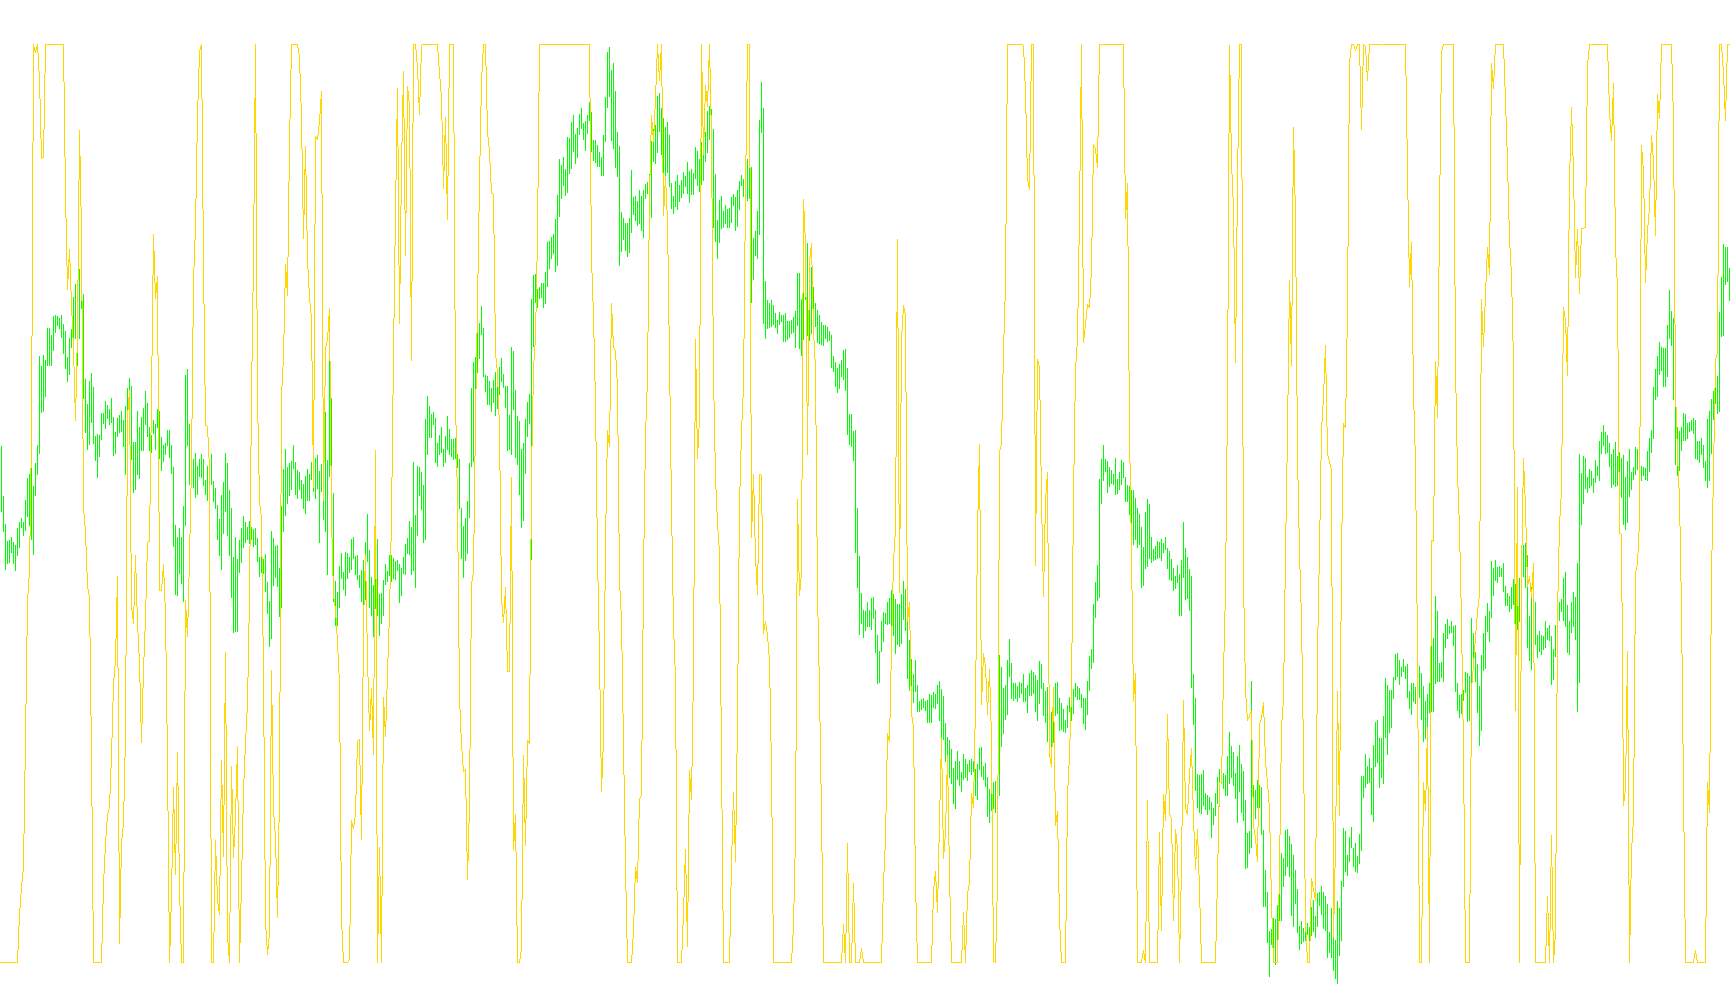
This custom indicator is designed to provide traders with a specialized visual tool that measures market momentum and relative strength. Rather than looking at raw price action alone, it uses a mathematical framework known as the "Laguerre" approach to smooth out market noise and identify underlying trends more clearly.
Core Logic & Methodology
The script functions by processing historical price data through a series of recursive calculations. Here is a breakdown of how it interprets the market:
1. Dynamic Smoothing (The Laguerre Component) The indicator begins by applying a smoothing filter to the closing prices of the assets. By utilizing a specific "Gamma" value, the script balances the importance of new price information against historical data. This prevents the indicator from reacting too wildly to minor price fluctuations while ensuring it remains responsive enough to capture significant movements.
2. Momentum Differential Once the smoothed data is established, the tool calculates the differences between four consecutive layers of this processed data (represented as L0 through L3). By looking at these gaps, the script determines whether the market is accelerating upward, slowing down, or pushing downward. It effectively captures the "velocity" of the price movement across different scales.
3. Relative Strength Calculation The final step involves condensing those differences into a single ratio. The script compares the positive momentum (upward moves) against the negative momentum (downward moves). This result is expressed as a percentage-like value, which creates a specialized oscillator.
How to Interpret the Results
The indicator appears in a separate window below your main price chart, allowing you to observe market sentiment independently of price volatility.
- Trend Identification: The tool helps distinguish between true directional trends and temporary "noise." Because it uses recursive smoothing, the resulting line provides a cleaner picture of whether the current momentum is favoring the bulls or the bears.
- Visual Boundaries: The script includes predefined levels (0.85 and 0.15). These serve as reference points to help identify potential overextended conditions or areas where the momentum might be reaching an extreme, potentially signaling a cooling-off period or a trend reversal.
- Lookback Sensitivity: The indicator is programmed to analyze a specific number of historical bars (defaulting to 950). This ensures that the data being used to calculate current momentum is based on a substantial enough sample size to be statistically relevant for your trading strategy.
//+------------------------------------------------------------------+
//|                                                     Laguerre.mq4 |
//|                                                     Emerald King |
//|                                     mailto:info@emerald-king.com |
//+------------------------------------------------------------------+
#property copyright "Emerald King"
#property link      "mailto:info@emerald-king.com"

#property indicator_separate_window
#property indicator_color1 Magenta
#property indicator_level2 0.85
#property indicator_level3 0.15

//---- input parameters
extern double gamma=0.6;
extern int CountBars=950;

double L0 = 0;
double L1 = 0;
double L2 = 0;
double L3 = 0;
double L0A = 0;
double L1A = 0;
double L2A = 0;
double L3A = 0;
double LRSI = 0;
double CU = 0;
double CD = 0;

double val1[];
//+------------------------------------------------------------------+
//| Custom indicator initialization function                         |
//+------------------------------------------------------------------+

int init()
  {
//---- indicators
//----
   SetIndexBuffer(0,val1);
   return(0);
  }
//+------------------------------------------------------------------+
//| Custor indicator deinitialization function                       |
//+------------------------------------------------------------------+
int deinit()
  {
//---- TODO: add your code here
   Comment("");
//----
   return(0);
  }
//+------------------------------------------------------------------+
//| Custom indicator iteration function                              |
//+------------------------------------------------------------------+
int start()
  {
   if (CountBars>Bars) CountBars=Bars;

   SetIndexDrawBegin(0,Bars-CountBars);

   int i;
   int    counted_bars=IndicatorCounted();

   //if(CountBars<=Lookback) return(0);
   //---- initial zero
   //if(counted_bars<1)
   //{
   //   for(i=1;i<=Lookback;i++) val1[CountBars-i]=0.0;
   //}

   i=CountBars-1;
   while(i>=0)
   {
      L0A = L0;
      L1A = L1;
      L2A = L2;
      L3A = L3;
      L0 = (1 - gamma)*Close[i] + gamma*L0A;
      L1 = - gamma *L0 + L0A + gamma *L1A;
      L2 = - gamma *L1 + L1A + gamma *L2A;
      L3 = - gamma *L2 + L2A + gamma *L3A;

      CU = 0;
      CD = 0;

      if (L0 >= L1) CU = L0 - L1; else CD = L1 - L0;
      if (L1 >= L2) CU = CU + L1 - L2; else CD = CD + L2 - L1;
      if (L2 >= L3) CU = CU + L2 - L3; else CD = CD + L3 - L2;

      if (CU + CD != 0) LRSI = CU / (CU + CD);
      val1[i] = LRSI;
	  i--;
	}
   return(0);
 }
//+------------------------------------------------------------------+
Comments