Linear Regression Line
Download script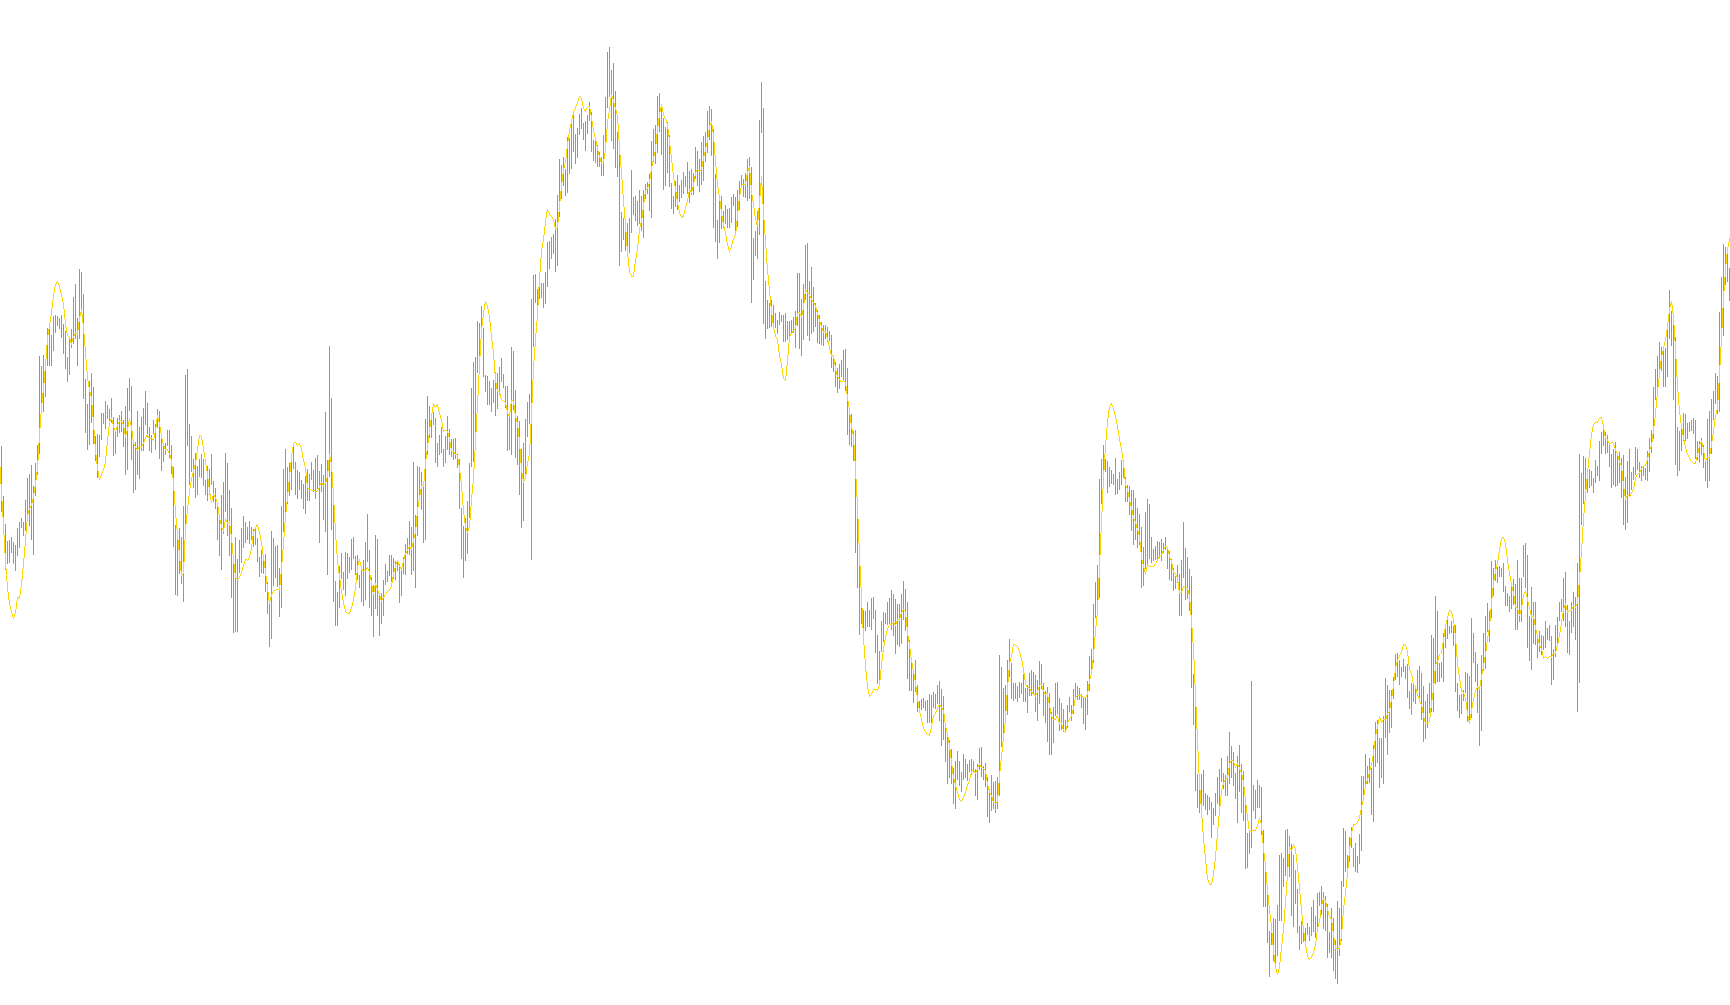
This tool is designed to provide a visual representation of price trends on a trading chart by calculating and plotting a Linear Regression Line. Unlike standard moving averages that simply smooth out previous data points, this script uses statistical mathematics to determine the "line of best fit" for a specific period of time.
How the Logic Works
1. Data Collection and Period Setting The script begins by looking at a user-defined window of historical data (the "Period"). For every point on the chart, it gathers the closing prices of the candles within that timeframe. By focusing on this specific look-back period, the tool identifies the prevailing direction of the market trend over that interval.
2. Statistical Calculation To draw the line accurately, the script performs several simultaneous mathematical operations:
- Summation: It calculates the totals of the prices and their corresponding positions in time.
- Slope Calculation: It determines the steepness of the price movement (the "slope"). This helps distinguish between a flat market, a steady climb, or a sharp decline.
- Intercept Determination: It calculates where the trend line would logically begin based on the current data set.
- Correlation Analysis: The logic internally calculates the relationship between the time elapsed and the price changes to ensure the resulting line represents the most mathematically accurate path through the "noise" of the market.
3. Dynamic Drawing Once the calculations are complete, the script identifies the exact coordinate for the end of the regression line. It then plots this as a continuous orange line on your chart window. Because it recalculates at every step, the line moves dynamically as new price data arrives, adjusting its angle to reflect the most recent trends.
Key Purpose
The primary goal of this logic is to filter out temporary market fluctuations (noise) and reveal the underlying trend. By providing a "best fit" line, it allows traders to see the general trajectory of the asset's price more clearly than they might by looking at raw price action alone.
//+------------------------------------------------------------------+
//|                                       Linear Regression Line.mq4 |
//|                                                      MQL Service |
//|                                           scripts@mqlservice.com |
//+------------------------------------------------------------------+
#property copyright "MQL Service"
#property link      "www.mqlservice.com"

#property indicator_chart_window
#property indicator_buffers 1
#property indicator_color1 Orange
#property indicator_width1 2
//---- input parameters
extern int LRLPeriod=14;
//---- buffers
double LRLBuffer[];

int shift=0;
int n=0;
double sumx=0, sumy=0, sumxy=0, sumx2=0, sumy2=0;
double m=0, yint=0, r=0;
//+------------------------------------------------------------------+
//|                    INITIALIZATION FUNCTION                       |
//+------------------------------------------------------------------+
int init()
  {
//---- indicators
   SetIndexStyle(0,DRAW_LINE);
   SetIndexBuffer(0,LRLBuffer);
   IndicatorDigits(Digits);
   if(LRLPeriod < 2) LRLPeriod = 2;
   IndicatorShortName("Linear Regression Line ("+LRLPeriod+")");
   SetIndexDrawBegin(0,LRLPeriod+2);
   IndicatorDigits(MarketInfo(Symbol(),MODE_DIGITS)+4);
//----
   return(0);
  }
//+------------------------------------------------------------------+
//|                   DEINITIALIZATION FUNCTION                      |
//+------------------------------------------------------------------+
int deinit()
  {
   return(0);
  }
//+------------------------------------------------------------------+
//|                      ITERATION FUNCTION                          |
//+------------------------------------------------------------------+
int start()
  {
   int limit;
   int counted_bars=IndicatorCounted();
   if(counted_bars<0) counted_bars=0;
   if(counted_bars>0) counted_bars--;
   limit=Bars-counted_bars;

   for(int shift=limit-1; shift>=0; shift--)
      {
         sumx = 0;
         sumy = 0;
         sumxy = 0;
         sumx2 = 0;
         sumy2 = 0;
         for(n = 0; n <= LRLPeriod-1; n++)
             {
               sumx = sumx + n;
               sumy = sumy + Close[shift + n];
               sumxy = sumxy + n * Close[shift + n];
               sumx2 = sumx2 + n * n;
               sumy2 = sumy2 + Close[shift + n] * Close[shift + n];
             }
         m=(LRLPeriod*sumxy-sumx*sumy)/(LRLPeriod*sumx2-sumx*sumx);
         yint=(sumy+m*sumx)/LRLPeriod;
         r=(LRLPeriod*sumxy-sumx*sumy)/MathSqrt((LRLPeriod*sumx2-sumx*sumx)*(LRLPeriod*sumy2-sumy*sumy));
         LRLBuffer[shift]=yint-m*LRLPeriod;
         //Print (" "+shift+" "+LRLBuffer[shift]);
      }
   return(0);
  }
//+------------------------------------------------------------------+
Comments