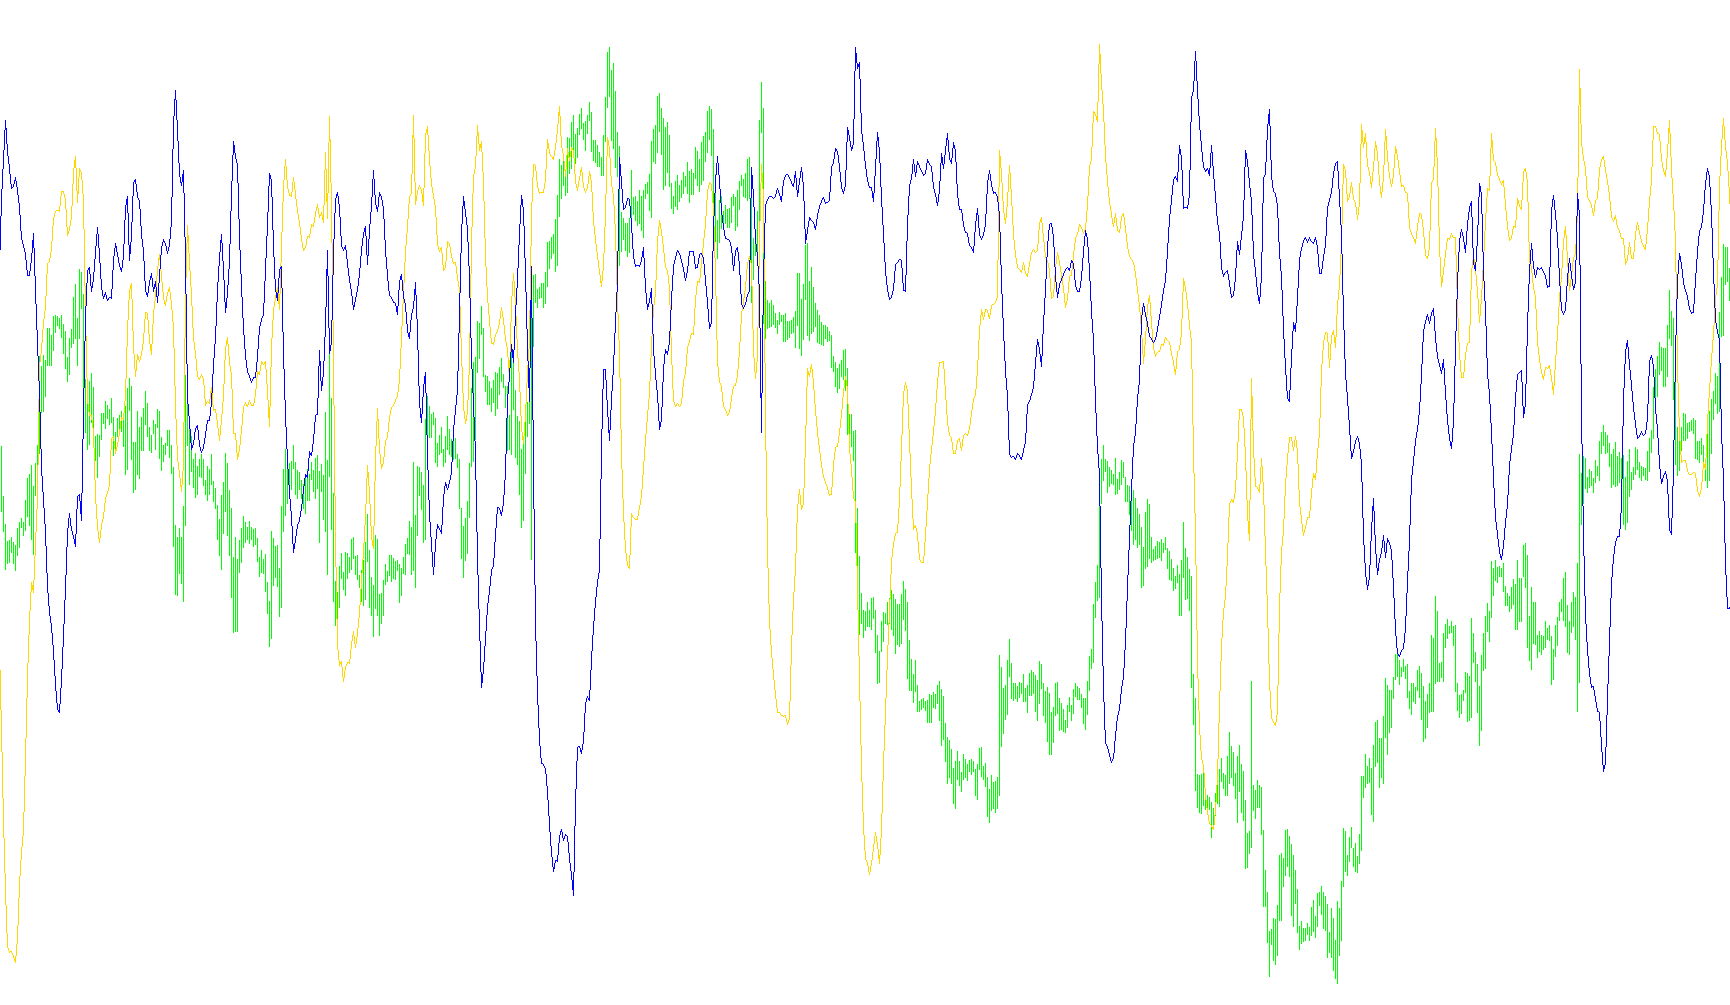
This script is designed as a technical analysis tool for the MetaTrader platform, specifically engineered to help traders visualize market momentum and potential trend reversals by measuring the distance between current price action and historical extremes.
Core Logic Overview
The primary objective of this indicator is to calculate the "tension" or "gap" between the current market price and its recent highs and lows across three different time horizons. By analyzing these gaps, the tool provides a visual representation of whether the market is stretched in one direction or is consolidating.
How it Works
The script operates through a multi-step calculation process:
1. Multi-Horizon Analysis The tool looks at three distinct historical windows simultaneously (defined by the "Min", "Midle", and "Max" settings). For every price point on your chart, the script identifies the highest high and the lowest low within these three specific timeframes.
2. Distance Calculation Instead of simply looking at where the price is, the script calculates how far the current price has moved away from those identified historical peaks and valleys:
- Upper Pressure: It measures the distance between the current high and the highest points of the three lookback periods.
- Lower Pressure: It measures the distance between the current low and the lowest points of the three lookback periods.
3. Trend Smoothing To prevent the visual data from appearing jagged or overly sensitive to minor price "noise," the script includes an optional smoothing mechanism (the EMA filter). This averages out the calculated distances over a set number of bars, resulting in smoother lines that are easier for a human trader to interpret at a glance.
Visual Representation
The logic produces two distinct lines on a separate window below your main price chart:
- Green Line: Typically represents the upward pressure or growth momentum based on the calculated high-point deviations.
- Red Line: Typically represents the downward pressure or retracement momentum based on the low-point deviations.
Practical Application
By observing the interaction between these two lines, a user can identify when the market is becoming "overextended." When one line moves significantly higher than the other, it suggests that the price is pulling away from its recent historical boundaries. Conversely, when the lines converge or shift dominance, it may signal a cooling of momentum or a potential change in the current trend direction.
//+------------------------------------------------------------------+
//|                                                   LeManTrend.mq4 |
//|                                         Copyright © 2009, LeMan. |
//|                                                 b-market@mail.ru |
//+------------------------------------------------------------------+
#property copyright "Copyright © 2009, LeMan."
#property link      "b-market@mail.ru"
//----
#property indicator_separate_window
#property indicator_buffers 2
#property indicator_color1 Green
#property indicator_color2 Red
//---- Âõîäíûå ïàðàìåòðû
extern int Min       = 13;
extern int Midle     = 21;
extern int Max       = 34;
extern int PeriodEMA = 3;
//---- Áóôåðû
double ExtMapBuffer1[];
double ExtMapBuffer2[];
double TempBuffer1[];
double TempBuffer2[];

//+------------------------------------------------------------------+
int init() {
//----
   IndicatorDigits(Digits);
   IndicatorBuffers(4);

   SetIndexBuffer(0,ExtMapBuffer1);
   SetIndexBuffer(1,ExtMapBuffer2);
   SetIndexBuffer(2,TempBuffer1);
   SetIndexBuffer(3,TempBuffer2);

   SetIndexStyle(0,DRAW_LINE);
   SetIndexStyle(1,DRAW_LINE);

   SetIndexDrawBegin(0,Max);
   SetIndexDrawBegin(1,Max);
//----
   return(0);
}
//+------------------------------------------------------------------+
int deinit() {
//----

//----
   return(0);
}
//+------------------------------------------------------------------+
int start() {
//----
   int i, counted_bars = IndicatorCounted();
//----
   if (Bars <= Max) {
      return(0);
   }
//---- initial zero
   if (counted_bars < 1) {
      for(i=1; i<=Max; i++) {
         ExtMapBuffer1[Bars-i] = 0.0;
         ExtMapBuffer2[Bars-i] = 0.0;
      }
   }
//----
   i = Bars-counted_bars-1;
//----
   while(i >= 0) {
      double High1 = iHigh(NULL, 0, iHighest(NULL, 0, MODE_HIGH, Min,i+1));
      double High2 = iHigh(NULL, 0, iHighest(NULL, 0, MODE_HIGH, Midle,i+1));
      double High3 = iHigh(NULL, 0, iHighest(NULL, 0, MODE_HIGH, Max,i+1));
      TempBuffer1[i] = ((High[i]-High1)+(High[i]-High2)+(High[i]-High3));
      double Low1 = iLow(NULL, 0, iLowest(NULL, 0, MODE_LOW, Min, i+1));
      double Low2 = iLow(NULL, 0, iLowest(NULL, 0, MODE_LOW, Midle, i+1));
      double Low3 = iLow(NULL, 0, iLowest(NULL, 0, MODE_LOW, Max, i+1));
      TempBuffer2[i] = ((Low1-Low[i])+(Low2-Low[i])+(Low3-Low[i]));
      i--;
   }
   if (counted_bars > 0) {
      counted_bars--;
   }
   int limit = Bars-counted_bars;

   for(i=0; i<limit; i++) {
      if (PeriodEMA > 0 ) {
         ExtMapBuffer1[i] = iMAOnArray(TempBuffer1,Bars,PeriodEMA,0,MODE_EMA,i);
         ExtMapBuffer2[i] = iMAOnArray(TempBuffer2,Bars,PeriodEMA,0,MODE_EMA,i);
      } else {
         ExtMapBuffer1[i] = TempBuffer1[i];
         ExtMapBuffer2[i] = TempBuffer2[i];
      }
   }
//----
   return(0);
  }
//+------------------------------------------------------------------+
Comments