LeManSignal
Download script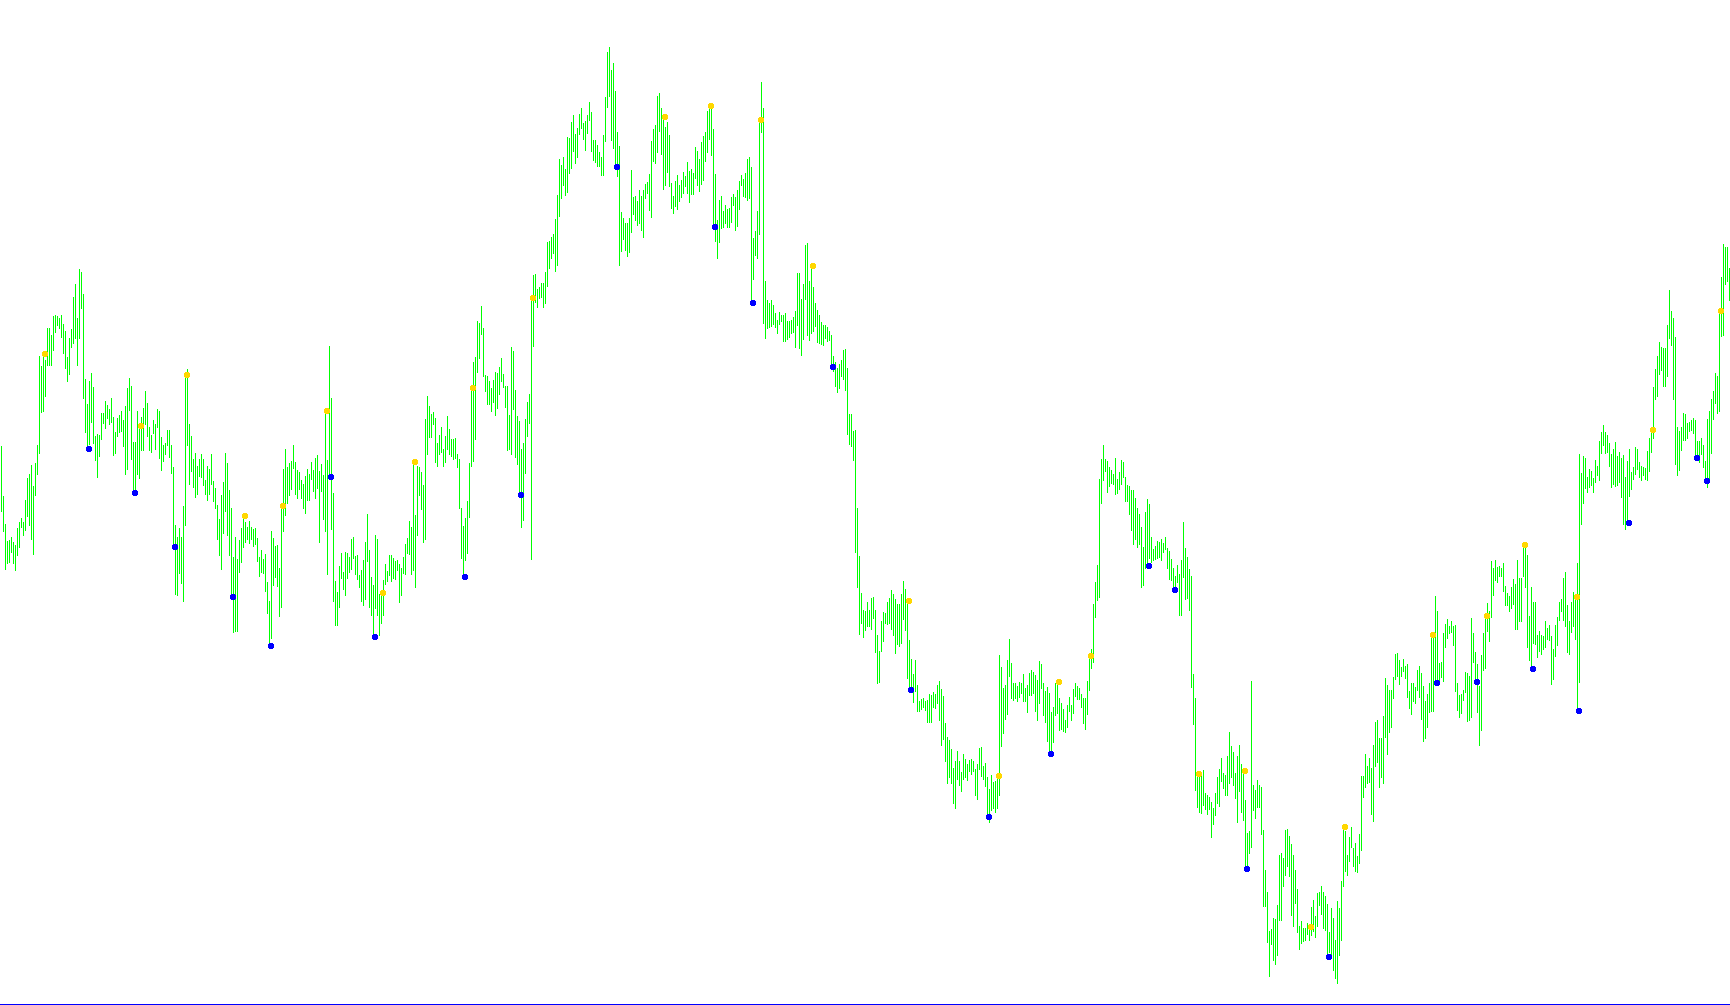
The LeManSignal is a technical analysis tool designed to identify specific trend reversals or momentum shifts by analyzing price action over a defined period. Instead of relying on standard moving averages or complex oscillators, this script focuses on the relationship between historical highs and lows to pinpoint potential entry points for "Buy" and "Sell" opportunities.
Core Logic and Mechanism
The indicator functions by scanning the market history to identify significant price peaks (highs) and troughs (lows). It uses a user-defined parameter (N) to determine how far back in time it should look to establish these structural points. By comparing these levels across different segments of the chart, the script identifies specific patterns that suggest a change in market direction.
How the Signals are Generated
Buy Signals (Green Arrows) The logic for a Buy signal is triggered when the script detects a specific "breakout" behavior in the price peaks. It looks for a scenario where:
- A recent peak in the past is lower than an even older peak, indicating a period of descending highs.
- This is followed by a new high that breaks above those previous levels. Essentially, it identifies a moment where the price has consolidated or moved downward and has finally "broken out" to the upside, signaling potential bullish momentum.
Sell Signals (Red Arrows) Conversely, the Sell signal is triggered by identifying a similar pattern in the market troughs. The logic looks for:
- A recent low in the past that is higher than an older low, suggesting a period of ascending lows.
- This is followed by a new price action that drops below those previous levels. The script identifies this as a "breakdown," where the price fails to hold its previous support and breaks into a downward trend, signaling potential bearish momentum.
Visual Execution
When these conditions are met, the indicator places an arrow directly on your chart:
- Green Arrows appear above the candles to highlight potential entry points for long positions (Buying).
- Red Arrows appear below the candles to highlight potential entry points for short positions (Selling).
By filtering out minor price fluctuations and focusing only on these structural shifts between highs and lows, the tool aims to provide traders with clear visual cues on when a trend is likely shifting in favor of a new direction.
//+------------------------------------------------------------------+
//|                                                  LeManSignal.mq4 |
//|                                         Copyright © 2009, LeMan. |
//|                                                 b-market@mail.ru |
//+------------------------------------------------------------------+
#property copyright "Copyright © 2009, LeMan."
#property link      "b-market@mail.ru"
//----
#property indicator_chart_window
#property indicator_buffers 2
#property indicator_color1 Green
#property indicator_color2 Red
#property indicator_width1 2
#property indicator_width2 2
//----
extern int N    = 12;
//----
double OpenUp[];
double OpenDown[];
//+------------------------------------------------------------------+
int init() {
//----
   string short_name;
//----
   IndicatorDigits(Digits);
   IndicatorBuffers(2);
//----
   short_name = "LeManSignal ("+N+")";
   IndicatorShortName(short_name);
//----
   SetIndexBuffer(0,OpenUp);
   SetIndexBuffer(1,OpenDown);

   SetIndexEmptyValue(0,0.0);
   SetIndexEmptyValue(1,0.0);

   SetIndexStyle(0,DRAW_ARROW,EMPTY,2);
   SetIndexArrow(0,159);
   SetIndexLabel(0, "Open Buy");
   SetIndexStyle(1,DRAW_ARROW,EMPTY,2);
   SetIndexArrow(1,159);
   SetIndexLabel(1, "Open Sell");

//----
   return(0);
}
//+------------------------------------------------------------------+
int start() {

   double LevelStop = MarketInfo(Symbol(),14);

   int counted_bars = IndicatorCounted();
   if (counted_bars > 0) counted_bars--;

   int limit;
   limit = Bars - counted_bars;

   for (int i = limit; i >= 0; i--) {

      double H1 = iHigh(NULL, 0, iHighest(NULL, 0, MODE_HIGH, N, i+1));
      double H2 = iHigh(NULL, 0, iHighest(NULL, 0, MODE_HIGH, N, i+1+N));
      double H3 = iHigh(NULL, 0, iHighest(NULL, 0, MODE_HIGH, N, i+2));
      double H4 = iHigh(NULL, 0, iHighest(NULL, 0, MODE_HIGH, N, i+2+N));
      double L1 = iLow(NULL, 0, iLowest(NULL, 0, MODE_LOW, N, i+1));
      double L2 = iLow(NULL, 0, iLowest(NULL, 0, MODE_LOW, N, i+1+N));
      double L3 = iLow(NULL, 0, iLowest(NULL, 0, MODE_LOW, N, i+2));
      double L4 = iLow(NULL, 0, iLowest(NULL, 0, MODE_LOW, N, i+2+N));

      OpenUp[i] = EMPTY_VALUE;
      OpenDown[i] = EMPTY_VALUE;

      // Óñëîâèå ïîêóïêè
      if (H3 <= H4 && H1 > H2) {
         OpenUp[i] = High[i+1] + Point;
      }
      // Óñëîâèå ïðîäàæè
      if (L3 >= L4 && L1 < L2) {
         OpenDown[i] = Low[i+1] - Point;
      }
  }

//----
   return(0);
}
//+------------------------------------------------------------------+
Comments