Least Square MA
Download script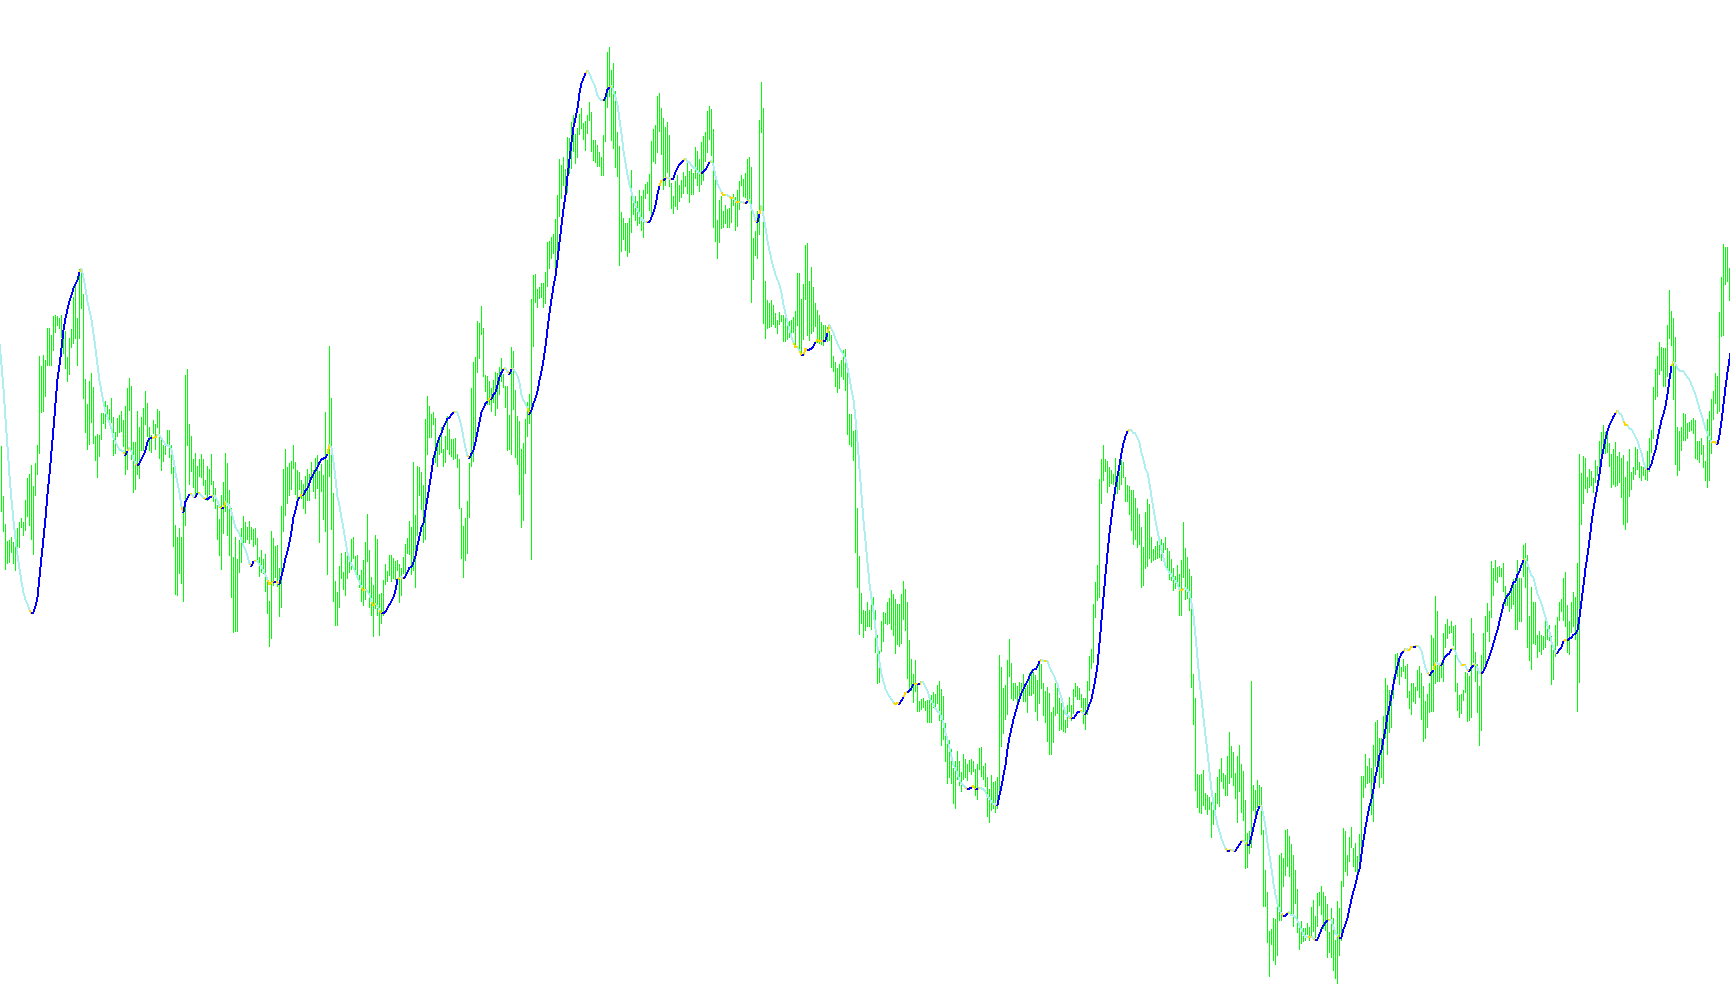
This custom indicator for MetaTrader is designed to provide visual guidance on price trends by analyzing historical price data and calculating a weighted momentum value. Instead of simply showing a basic moving average, it uses a specific mathematical approach to emphasize more recent price actions while smoothing out the noise of older data.
Core Logic and Calculations
The script works by looking back at a predefined number of candles (the period). For every point on your chart, it performs the following steps:
- Weighted Accumulation: It calculates the sum of closing prices over the selected period. However, it applies a multiplier to these prices based on their position in time. This ensures that the calculation is not "flat"; it gives different importance to different candles within the timeframe, creating a more nuanced view of where the price is heading.
- Normalization: Once the weighted sum is calculated, the script performs a division process to normalize the value. This converts the raw data into a smoothed trend line that follows the market's flow without being overly erratic.
Visual Representation and Color Coding
The primary goal of this script is to provide a clear visual distinction between upward and downward momentum through its use of colored lines. The logic handles the display as follows:
- Trend Detection: The script constantly compares the current calculated value against the previous one. By identifying whether the trend is increasing or decreasing, it determines which color to display.
- Dynamic Coloring:
- When the momentum is moving in one direction (e.g., rising), the script prioritizes one specific color buffer.
- When the momentum shifts in the opposite direction, it hides the previous color and activates the next one.
- If there is no change in value, the indicator remains neutral to avoid "flickering" or false signals during periods of consolidation.
User Experience
For a trader, this means the tool acts as a visual flow indicator. Rather than looking at a messy web of price action, you see a clean, colored line that shifts hue based on the strength and direction of the market trend. It simplifies technical analysis by highlighting the prevailing "mood" of the market in real-time.
//+------------------------------------------------------------------+
//|                                                        |
//|                      Copyright © 2004, MetaQuotes Software Corp. |
//|                                       http://www.metaquotes.net/ |
//+------------------------------------------------------------------+
#property  copyright "Copyright © 2005, FX Sniper "
#property  link      "http://www.metaquotes.net/"

//---- indicator settings
#property  indicator_chart_window
#property  indicator_buffers 3
#property indicator_color1 Yellow
#property indicator_color2 Green
#property indicator_color3 Red

//---- buffers
double ExtMapBuffer1[];
double ExtMapBuffer2[];
double ExtMapBuffer3[];
int width;

extern int Rperiod = 34;
extern int Draw4HowLongg = 1500;
int Draw4HowLong;
int shift;
int i;
int loopbegin;
double sum[];
int length;
double lengthvar;
double tmp ;
double wt[];
int c;

//+------------------------------------------------------------------+
//| Custom indicator initialization function                         |
//+------------------------------------------------------------------+
int init()
  {
//---- 2 additional buffers are used for counting.
   IndicatorBuffers(5);

//---- drawing settings
   SetIndexBuffer(2,ExtMapBuffer1);
   SetIndexBuffer(1,ExtMapBuffer2);
   SetIndexBuffer(0,ExtMapBuffer3);
   SetIndexBuffer(3,sum);
   SetIndexBuffer(4,wt);

   SetIndexStyle(2,DRAW_LINE,STYLE_SOLID,2);
   SetIndexStyle(1,DRAW_LINE,STYLE_SOLID,2);
   SetIndexStyle(0,DRAW_LINE,STYLE_SOLID,2);

//---- initialization done
   return(0);
  }

int start()

  {   Draw4HowLong = Bars-Rperiod - 5;
      length = Rperiod;
      loopbegin = Draw4HowLong - length - 1;

      for(shift = loopbegin; shift >= 0; shift--)
      {
         sum[1] = 0;
         for(i = length; i >= 1  ; i--)
         {
         lengthvar = length + 1;
         lengthvar /= 3;
         tmp = 0;
         tmp = ( i - lengthvar)*Close[length-i+shift];
         sum[1]+=tmp;
         }
         wt[shift] = sum[1]*6/(length*(length+1));

//========== COLOR CODING ===========================================

       ExtMapBuffer3[shift] = wt[shift]; //red
       ExtMapBuffer2[shift] = wt[shift]; //green
       ExtMapBuffer1[shift] = wt[shift]; //yellow

       //  for(c=loopbegin;c==shift;c++)
       // {
        if (wt[shift+1] > wt[shift])
        {
        ExtMapBuffer2[shift+1] = EMPTY_VALUE;
  // ObjectCreate("smiley_face", OBJ_ARROW, 0, Time[shift], Low[shift]-Point*20);
  // Print("time=  ",Time[shift]);
  // ObjectSet("smiley_face", OBJPROP_ARROWCODE, 242);
  // ObjectSet("smiley_face", OBJPROP_COLOR , Red);
  // ObjectSet("smiley_face", OBJPROP_WIDTH  , 1);
  // ObjectsRedraw();

        //ExtMapBuffer3[shift+1] = EMPTY_VALUE;
        //ExtMapBuffer3[shift+1] = EMPTY_VALUE;

        }
       else if (wt[shift+1] < wt[shift])
        {
        ExtMapBuffer1[shift+1] = EMPTY_VALUE; //-1 red/greem tight
       //ExtMapBuffer3[shift+1] = EMPTY_VALUE;

        }
         else
         {

         ExtMapBuffer1[shift+1]=CLR_NONE;//EMPTY_VALUE;
         ExtMapBuffer2[shift+1]=CLR_NONE;//EMPTY_VALUE;
         }

      }

      return(0);
  }
//+------------------------------------------------------------------+
Comments