Linear Price Bar_v1
Download script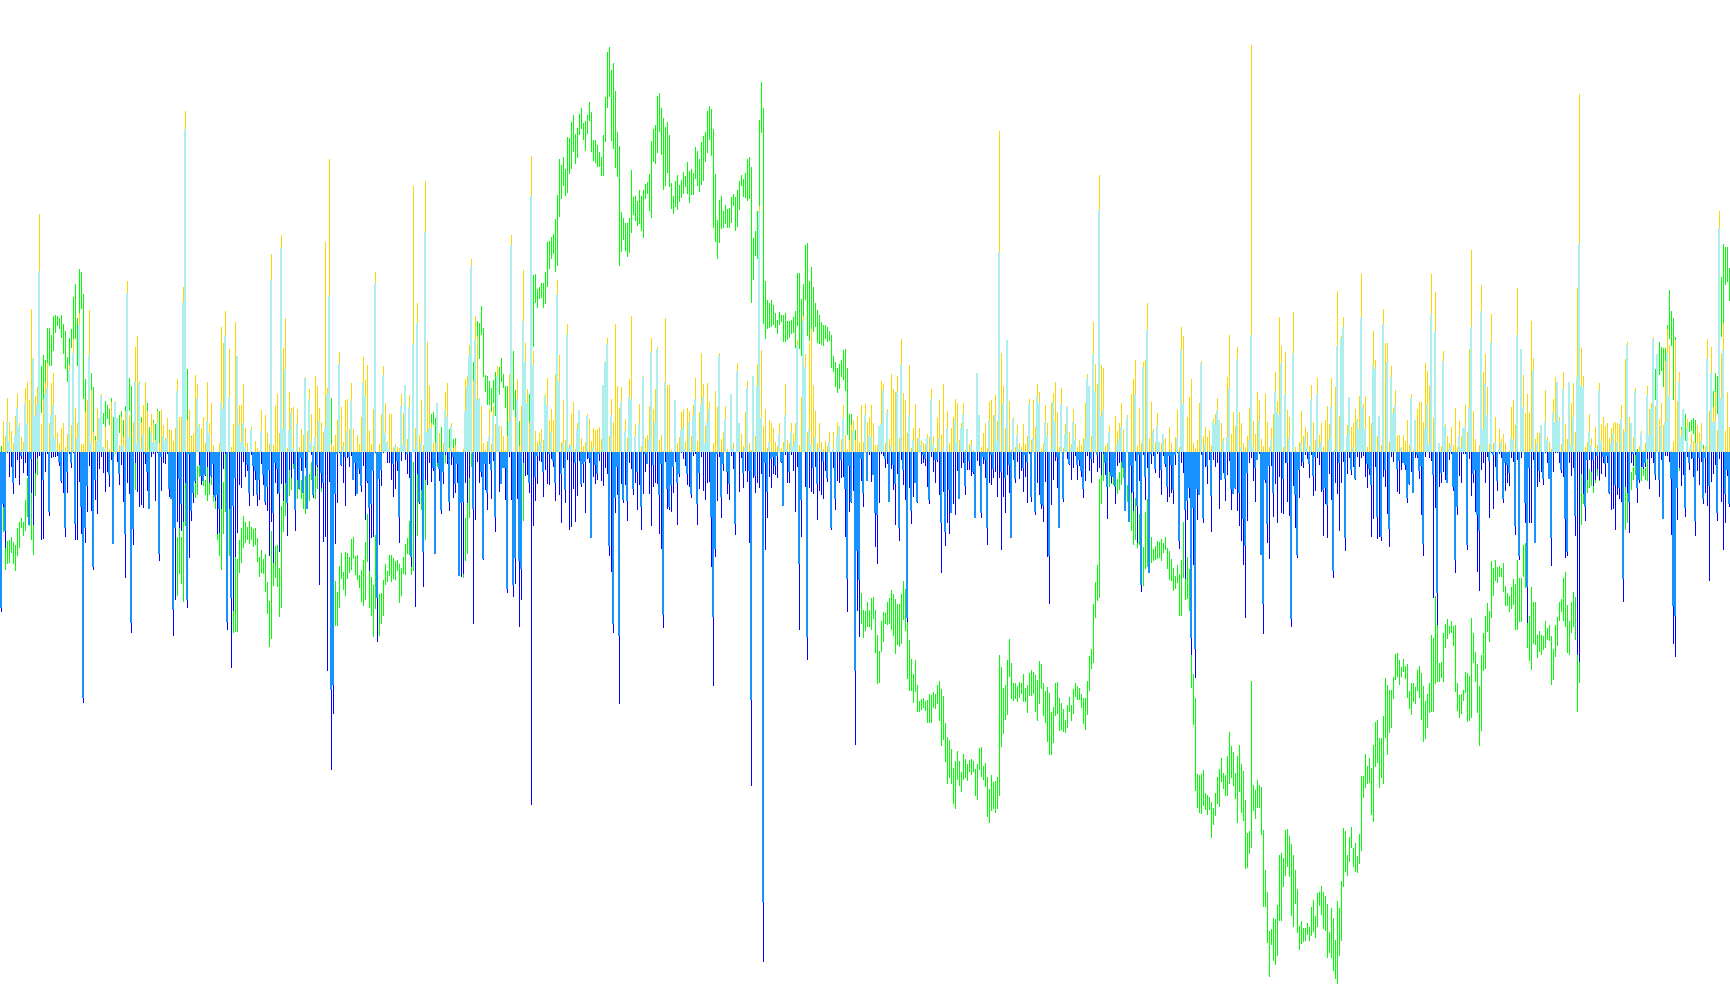
This tool is designed to provide a visual representation of price movement dynamics by isolating and mapping the relative performance of each individual bar on your trading chart. Rather than looking at raw prices, it breaks down the "anatomy" of every candle to show you exactly how much distance was covered in different directions relative to where the period began.
How it Works
The logic follows a straightforward process of decomposing each price bar into three key components: the high point, the low point, and the closing result, all measured as a distance from the opening price.
1. Relative Movement Mapping For every bar on your chart, the script calculates the distance between the Opening Price and two other key points:
- The High: It measures how far upward the price climbed from the start of the bar.
- The Low: It measures how far downward the price dropped from the start of the bar.
By calculating these as distances rather than absolute prices, the tool allows you to see the "reach" of the price action regardless of whether the market was at a very high or very low level.
2. Directional Differentiation The script then categorizes the price movement based on the final outcome of the bar (the Closing Price). It identifies whether the bar ended higher, lower, or exactly equal to its starting point:
- Upward Movement: If the price closed higher than it opened, the tool highlights the positive distance covered.
- Downward Movement: If the price closed lower than it opened, the tool captures the negative distance.
Visual Output
The data is presented as a series of histograms in a separate window below your main chart. This creates a visual "map" of market volatility and sentiment:
- It distinguishes between the total range (the highs and lows) and the final result (the close).
- By using different colors and histogram styles, it allows you to quickly see at a glance which directions held the most momentum over time.
In short, this script transforms standard price bars into a linear map of progress, making it easier to visualize how aggressively the market is moving in one direction versus another relative to its starting point for each period.
/*-----------------------------+
|			       |
| Shared by www.Aptrafx.com    |
|			       |
+------------------------------*/

//+------------------------------------------------------------------+
//|                                             Linear Price Bar.mq4 |
//|                                      Copyright © 2006, Keris2112 |
//|                                                             none |
//+------------------------------------------------------------------+
#property copyright "Copyright © 2006, Keris2112"
#property link      "none"

#property indicator_separate_window
#property indicator_buffers 4
#property indicator_color1 Blue
#property indicator_color2 Red
#property indicator_color3 Blue
#property indicator_color4 Red


//---- buffers

double ExtMapBuffer1[];
double ExtMapBuffer2[];
double ExtMapBuffer3[];
double ExtMapBuffer4[];

//+------------------------------------------------------------------+
//| Custom indicator initialization function                         |
//+------------------------------------------------------------------+
int init()
  {
//---- indicators
   SetIndexStyle(0,DRAW_HISTOGRAM);
   SetIndexBuffer(0,ExtMapBuffer1);
   SetIndexStyle(1,DRAW_HISTOGRAM);
   SetIndexBuffer(1,ExtMapBuffer2);
   SetIndexStyle(2,DRAW_HISTOGRAM,EMPTY,3);
   SetIndexBuffer(2,ExtMapBuffer3);
   SetIndexStyle(3,DRAW_HISTOGRAM,EMPTY,3);
   SetIndexBuffer(3,ExtMapBuffer4);

//----
   return(0);
  }
//+------------------------------------------------------------------+
//| Custor indicator deinitialization function                       |
//+------------------------------------------------------------------+
int deinit()
  {
//----

//----
   return(0);
  }
//+------------------------------------------------------------------+
//| Custom indicator iteration function                              |
//+------------------------------------------------------------------+
int start()
  {
   int    counted_bars=IndicatorCounted();
   int i;
   int UpDays, DownDays, NeutralDays;
   double BarH, BarL, BarC;

//----
   for(i=0; i<Bars; i++)
      {
      BarH = High[i]-Open[i];
      BarL = Low[i]-Open[i];
      BarC = Close[i]-Open[i];
      if(BarC>0) UpDays += 1;
         else if(BarC<0) DownDays +=1;
         else if(BarC==0) NeutralDays +=1;


      ExtMapBuffer1[i] = BarH;
      ExtMapBuffer2[i] = BarL;
//      SortBuffer1[i] = BarH;
//      SortBuffer2[i] = BarL;
      if(Close[i]>Open[i])
         {
         ExtMapBuffer3[i] = BarC;
         ExtMapBuffer4[i] = 0;
         }
         else
         {
         ExtMapBuffer3[i] = 0;
         ExtMapBuffer4[i] = BarC;
         }


      }

//----
   return(0);
  }
//+------------------------------------------------------------------+
Comments