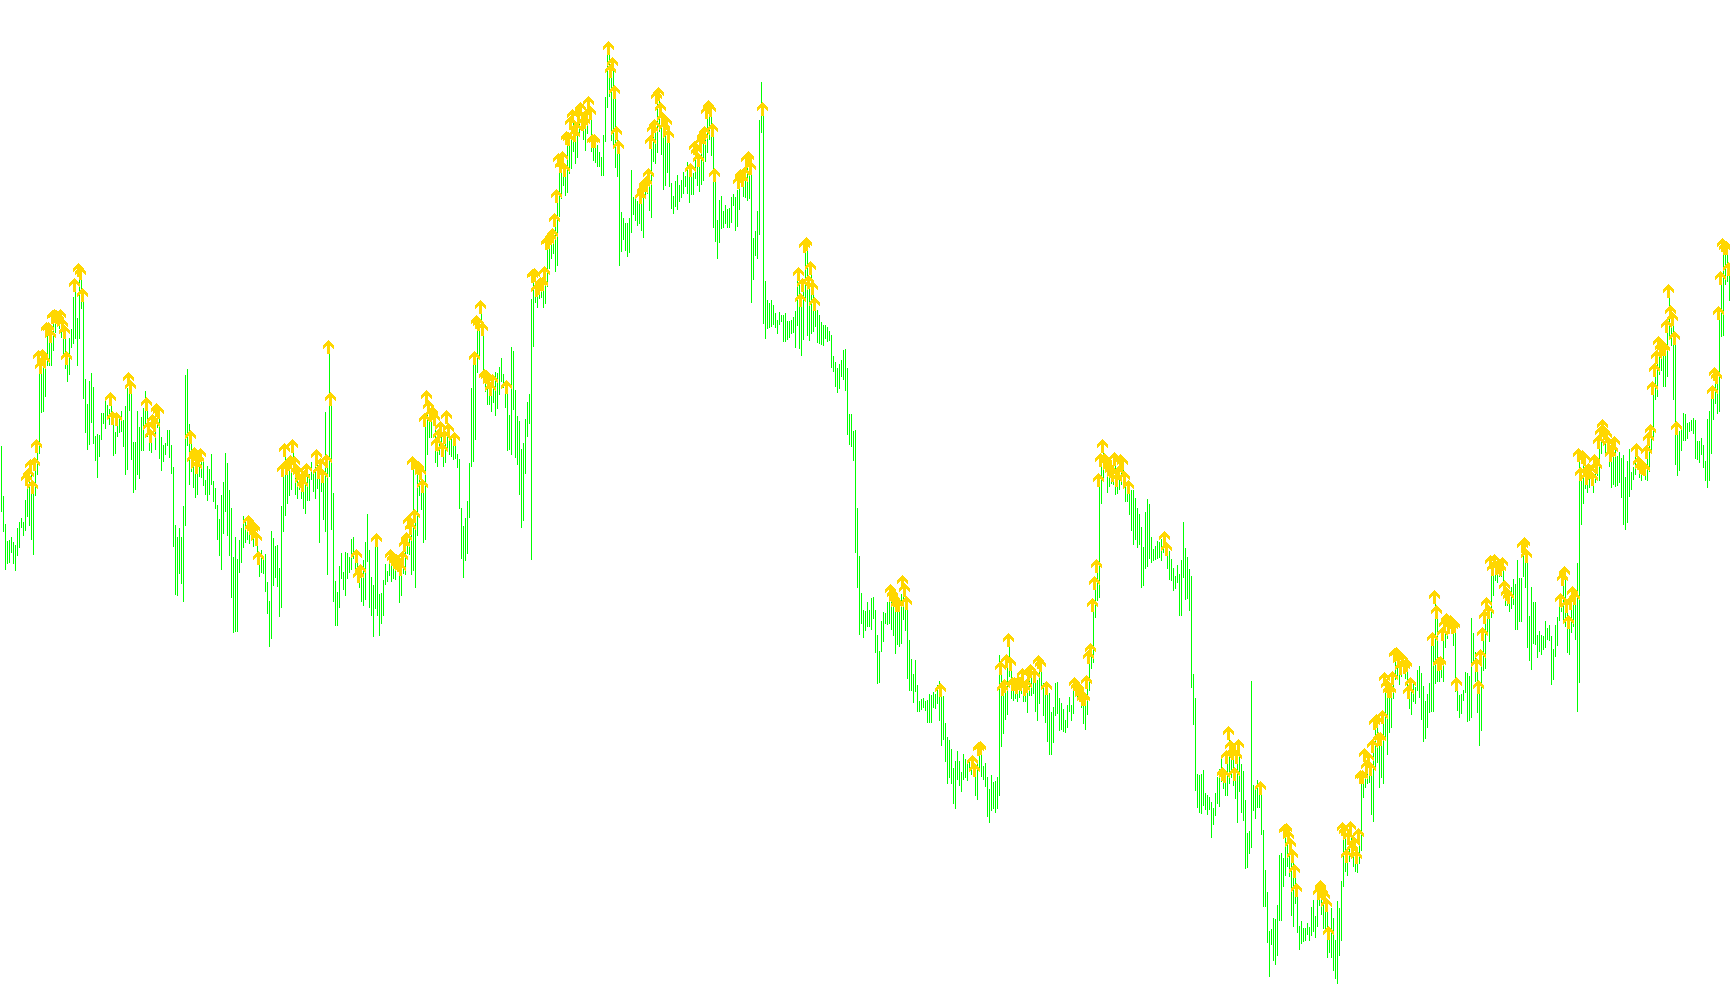
This technical indicator is designed to identify specific momentum shifts in price action by utilizing a specialized mathematical formula known as the Lagurre RSI. Unlike standard oscillators that may lag behind market movements, this logic focuses on calculating the relative strength of price changes while smoothing out noise to provide clearer entry and exit signals.
Core Logic Overview
The script functions by analyzing the relationship between current price movement and historical trends. It converts raw price data into a normalized value (a decimal) that represents the "strength" of the current trend.
The primary objective is to detect "crossovers"—moments where the momentum shifts from being predominantly bearish to bullish, or vice versa.
How it Works
- Momentum Calculation: The script calculates four distinct layers of price data. By comparing these layers against each other, it determines whether the upward pressure (bullish) or downward pressure (bearish) is dominant at any given moment.
- The 0.5 Threshold: The indicator looks for a specific "tipping point" at the 0.5 mark.
- Bullish Signal: When the momentum value moves from below 0.5 to above 0.5, it indicates that upward pressure has taken over. The script then places a white arrow on the chart.
- Bearish Signal: When the momentum value moves from above 0.5 to below 0.5, it indicates that downward pressure has taken over. The script then places a red arrow on the chart.
- Smoothing Factor (Gamma): The logic includes a "Gamma" setting, which allows the user to control the sensitivity of the calculation. This determines how quickly the indicator reacts to new price information versus how much it weighs historical data.
Visual Representation
Instead of creating a separate window with a wavy line, this script plots directly on your main price chart:
- White Arrows: Appear at the high of a candle when the logic detects a shift toward bullish momentum.
- Red Arrows: Appear at the low of a candle when the logic detects a shift toward bearish momentum.
By focusing on these specific crossover points, the tool aims to highlight potential trend reversals or continuations for traders who prefer to see clear visual cues on their primary price action.
//+------------------------------------------------------------------+
//| 5 Min RSI 12-period qual INDICATOR                               |
//+------------------------------------------------------------------+
#property copyright "Ron T"
#property link      "http://www.lightpatch.com"

#property indicator_chart_window
#property indicator_buffers 2

#property indicator_color1 White
#property indicator_color2 Red


//---- buffers
double Buffer1[];
double Buffer2[];


extern double gamma=0.5;

double L0 = 0;
double L1 = 0;
double L2 = 0;
double L3 = 0;
double L0A = 0;
double L1A = 0;
double L2A = 0;
double L3A = 0;
double LRSI = 0;
double CU = 0;
double CD = 0;

// User Input


//+------------------------------------------------------------------+
//| Custom indicator initialization function                         |
//|------------------------------------------------------------------|

int init()
  {

   // 233 up arrow
   // 234 down arrow
   // 159 big dot
   // 158 little dot
   // 168 open square
   // 120 box with X

   SetIndexStyle(0,DRAW_ARROW);
   SetIndexBuffer(0, Buffer1);
   SetIndexArrow(0,233);

   SetIndexStyle(1,DRAW_ARROW);
   SetIndexBuffer(1, Buffer2);
   SetIndexArrow(1,234);

   return(0);
  }


//+------------------------------------------------------------------+
//| Custor indicator deinitialization function                       |
//+------------------------------------------------------------------+
int deinit()
  {
   int i;
   for( i=0; i<Bars; i++ ) Buffer1[i]=0;
   for( i=0; i<Bars; i++ ) Buffer2[i]=0;
   return(0);
  }


//+------------------------------------------------------------------+
//| Custom indicator iteration function                              |
//+------------------------------------------------------------------+

// Current position if 55/45 or over/under. Does any of
// the previous 'qual' period ever fall below55/above45? (last11)
//
// If qual*2 periods have been above55/below45
// then lets not try to transact any more (last22)


int start()
  {
   int      pos=Bars-100; // leave room for moving average periods
   int      ctr=0;

   bool     rising=false;
   bool    falling=false;

   double p=Point();

   double lpc, lpp;

   while(pos>=1)
     {

      lpc=lagurre(pos);
      //lpp=lagurre(pos+1);

      // rising
      if (lpp<0.5 && lpc>0.5){Buffer1[pos]=High[pos];}

      //falling
      if (lpp>0.5 && lpc<0.5) {Buffer2[pos]=Low[pos];}

 	   pos--;
     }

   return(0);
  }


double lagurre (int i)
  {
   L0A = L0;
   L1A = L1;
   L2A = L2;
   L3A = L3;
   L0 = (1 - gamma)*Open[i] + gamma*L0A;
   L1 = - gamma *L0 + L0A + gamma *L1A;
   L2 = - gamma *L1 + L1A + gamma *L2A;
   L3 = - gamma *L2 + L2A + gamma *L3A;

   CU = 0;
   CD = 0;

   if (L0 >= L1) CU = L0 - L1;      else CD = L1 - L0;
   if (L1 >= L2) CU = CU + L1 - L2; else CD = CD + L2 - L1;
   if (L2 >= L3) CU = CU + L2 - L3; else CD = CD + L3 - L2;

   if (CU + CD != 0) LRSI = CU / (CU + CD);
   return(LRSI);
  }
Comments