LeManChanel
Download script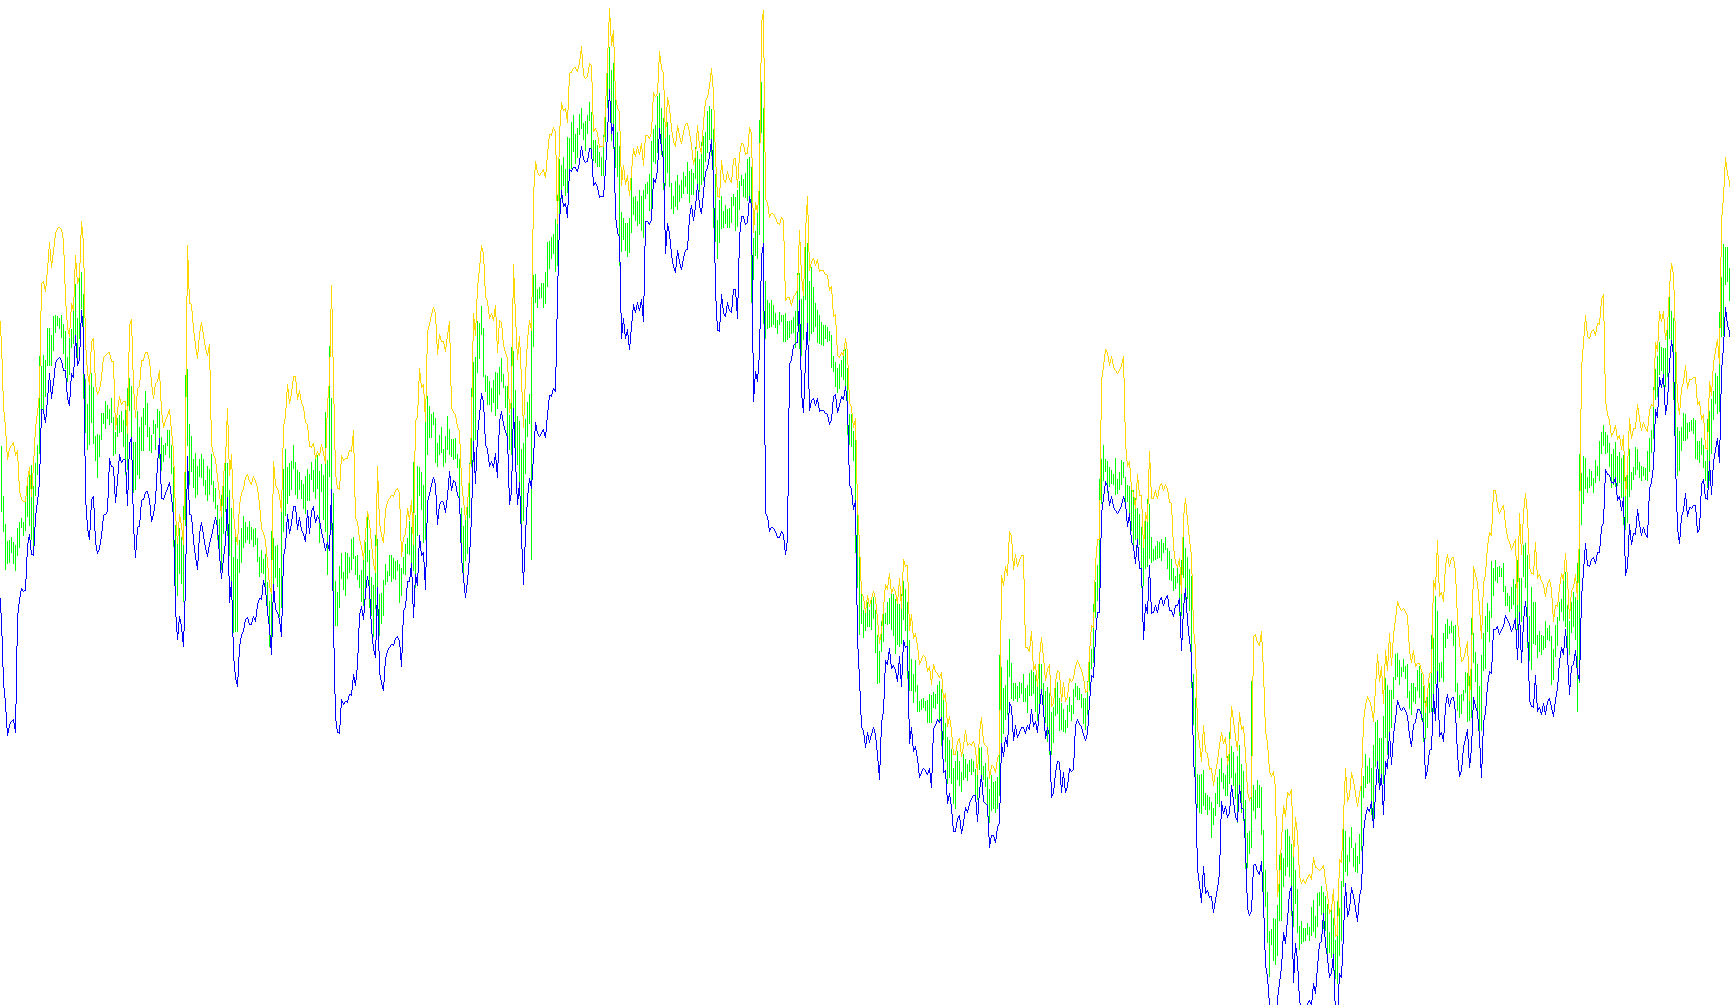
This custom indicator is designed to provide traders with a visual representation of market boundaries by identifying specific price levels based on historical volatility. Rather than simply following the current price, it calculates "channels" that help define potential zones of support and resistance.
How the Logic Works
The tool operates by analyzing the relationship between the closing prices and the high/low extremes of preceding candles over a specific period (defined by the user-set variable 'N'). Here is the step-by-step breakdown of its logic:
1. Measuring Price Deviations The indicator first scans the recent price action to calculate two distinct types of price "gaps" or deviations:
- Upper Deviation: It measures the distance between a previous candle's closing price and the current high.
- Lower Deviation: It measures the distance between a previous candle's closing price and the current low.
2. Identifying Peak Volatility Instead of using an average of these deviations, the script looks back over the defined period (N) to find the maximum deviation recorded. By identifying the largest "jump" or stretch in price during that window, the indicator establishes a baseline for how far the price typically moves away from its equilibrium point during periods of high activity.
3. Plotting the Channels Once the maximum deviations are identified, the tool projects two lines onto your chart:
- The Upper Boundary: This is calculated by taking the current closing price and adding the maximum upper deviation found in the lookback period.
- The Lower Boundary: This is calculated by taking the current closing price and subtracting the maximum lower deviation found in the lookback period.
Summary for Traders
Essentially, this script creates a dynamic "envelope" around the current price. By looking at the largest historical price swings over your chosen timeframe, it attempts to predict the outer limits of the current market move. When the price nears these lines, it can be interpreted as reaching a point of significant extension relative to recent history, potentially signaling a cooling-off period or a reversal point.
//+------------------------------------------------------------------+
//|                                                  LeManChanel.mq4 |
//|                                         Copyright © 2009, LeMan. |
//|                                                 b-market@mail.ru |
//+------------------------------------------------------------------+
#property copyright "Copyright © 2009, LeMan."
#property link      "b-market@mail.ru"
//----
#property indicator_chart_window
#property indicator_buffers 2
#property indicator_color1 Violet
#property indicator_color2 Violet
#property indicator_width1 1
#property indicator_width2 1
#property indicator_style1 0
#property indicator_style2 0
//----
extern int N = 12;
//----
double Up[];
double Down[];
double hoBuffer[];
double olBuffer[];
//+------------------------------------------------------------------+
int init() {
//----
   string short_name;
   short_name = "LeManChanel ("+N+")";
//----
   IndicatorDigits(Digits);
   IndicatorBuffers(4);
//----
   SetIndexBuffer(0,Up);
   SetIndexBuffer(1,Down);
   SetIndexBuffer(2,hoBuffer);
   SetIndexBuffer(3,olBuffer);

   SetIndexStyle(0,DRAW_LINE);
   SetIndexStyle(1,DRAW_LINE);
//----
   SetIndexDrawBegin(0,N);
   SetIndexDrawBegin(1,N);
   SetIndexShift(0,1);
   SetIndexShift(1,1);
//----
   IndicatorShortName(short_name);
   SetIndexLabel(0,"Up");
   SetIndexLabel(1,"Dn");
//----
   return(0);
}
//+------------------------------------------------------------------+
int start() {
   int i, limit, mho, mol, counted_bars = IndicatorCounted();
   if (Bars <= N) return(0);
   if(counted_bars > 0) counted_bars--;
   limit = Bars-counted_bars;

   for (i = limit-1; i >= 0 ; i--) hoBuffer[i] = High[i]-Close[i+1];
   for (i = limit-1; i >= 0 ; i--) olBuffer[i] = Close[i+1]-Low[i];

   for (i = limit-1; i >= 0; i--) {
      mho = ArrayMaximum(hoBuffer,N,i);
      mol = ArrayMaximum(olBuffer,N,i);
      Up[i] = Close[i]+hoBuffer[mho];
      Down[i] = Close[i]-olBuffer[mol];
   }
//----
   return(0);
}
//+------------------------------------------------------------------+
Comments