LargeTimeFrame
Download script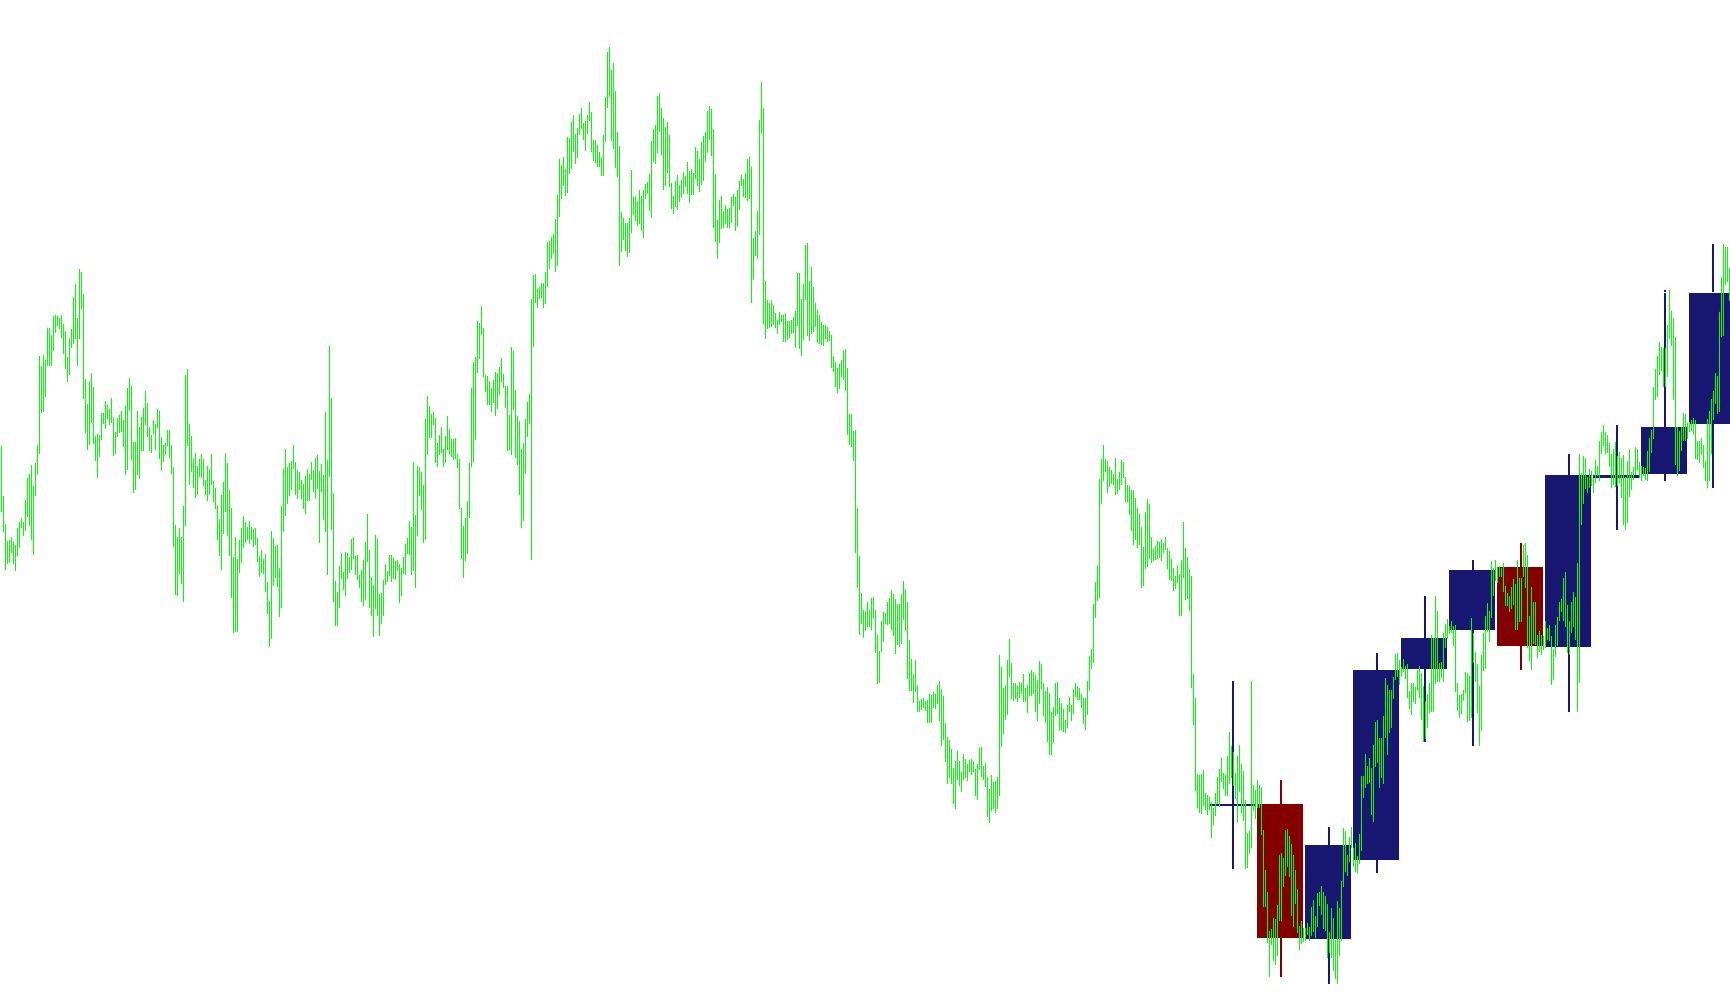
This tool is designed to provide traders with a clear visual representation of higher-timeframe price action directly on their current trading chart. It allows you to "see" the larger market structure—such as daily or weekly trends—without having to switch back and forth between different timeframes, helping you maintain a better perspective on the overall market direction while executing trades on smaller scales.
How it Works
The script functions by fetching data from a specific, higher timeframe that you choose (for example, viewing Daily bars while trading on a 15-minute chart). It then maps out the most recent price candles from that larger timeframe onto your current screen using two distinct visual elements:
- Body Representation: The script identifies the "body" of the larger candles (the distance between the opening and closing prices). These are drawn as colored rectangles on your chart. If the higher timeframe candle was bullish (closed higher than it opened), these areas appear in a specific color; if it was bearish, they change to a contrasting color.
- Price Range Representation: To ensure you can see the full extent of the price movement, the script also draws vertical markers that highlight the "wicks" or the high and low points of those larger candles. This gives you an immediate sense of the total volatility and boundaries reached during that period.
Key Features and Logic
- Dynamic Configuration: You can customize which timeframe to display (e.g., H4, Daily, Weekly) and decide how many previous bars from that timeframe you want to see at once.
- Visual Hierarchy: The script uses a "Background" setting for these objects, meaning the markings are designed to sit behind your current price action. This ensures that while the higher timeframe data is visible, it doesn't clutter your view or interfere with your ability to read your current active candles.
- Automated Cleanup: Every time the chart refreshes, the script automatically clears out old drawings and redraws the most recent data. This ensures that the information you are looking at is always current and perfectly aligned with the latest market ticks.
- Safety Check: The script includes a built-in validation logic to ensure it only functions correctly if the chosen timeframe is actually larger than your current chart. If you try to display a smaller timeframe on a large chart, the system will provide a notification to prevent visual confusion.
Price Data Components
9
Views
0
Downloads
0
Favorites
LargeTimeFrame
//+------------------------------------------------------------------+
//|                                               LargeTimeFrame.mq4 |
//|                                      Copyright © 2005, Miramaxx. |
//|                                    mailto: morrr2001[dog]mail.ru |
//+------------------------------------------------------------------+
//|Ïîñòðîåíèå íà ãðàôèêå ñâå÷åé ñòàðøåãî òàéìôðåéìà.                 |
//+------------------------------------------------------------------+
#property copyright "Copyright © 2005, Miramaxx."
#property link "mailto: morrr2001[dog]mail.ru"
//----
#property indicator_chart_window
//----
extern string Timeframe="D1";
extern int CountBars=10;
extern color Bear=Maroon;
extern color Bull=MidnightBlue;
//----
   datetime time1;
   datetime time2;
   double open_price,close_price;
   int bar_tf;
   int PeriodName=0;
   int num=0;
   string error="Ïàðàìåòð Timeframe çàäàí íå âåðíî \nÏðèìåð: äëÿ ÷àñîâîãî ãðàôèêà âûáåðèòå ïàðàìåòð D1.";
//+------------------------------------------------------------------+
//|                                                                  |
//+------------------------------------------------------------------+
   void ObjDel()
  {
   for(;num>=0;num--)
      ObjectDelete("Objtf"+num);
  }
//+------------------------------------------------------------------+
//|                                                                  |
//+------------------------------------------------------------------+
int init()
  {
   if (Timeframe=="M1") PeriodName=PERIOD_M1; //â òîì æå ïîðÿäêå, ÷òî è êíîïêè íà ïàíåëè
   else
      if (Timeframe=="M5") PeriodName=PERIOD_M5;
      else
         if (Timeframe=="M15")PeriodName=PERIOD_M15;
         else
            if (Timeframe=="M30")PeriodName=PERIOD_M30;
            else
               if (Timeframe=="H1") PeriodName=PERIOD_H1;
               else
                  if (Timeframe=="H4") PeriodName=PERIOD_H4;
                  else
                     if (Timeframe=="D1") PeriodName=PERIOD_D1;
                     else
                        if (Timeframe=="W1") PeriodName=PERIOD_W1;
                        else
                           if (Timeframe=="MN") PeriodName=PERIOD_MN1;
                           else
                             {
                              Comment(error);
                              return(0);
                             }
   Comment("LargeTimeframe(",Timeframe,")");
   return(0);
  }
//+------------------------------------------------------------------+
//|                                                                  |
//+------------------------------------------------------------------+
int deinit()
  {
   ObjDel();
   Comment("");
   return(0);
  }
//+------------------------------------------------------------------+
//|                                                                  |
//+------------------------------------------------------------------+
int start()
  {
   int i;
   ObjDel();
   num=0;
//----
   if (PeriodName<=Period())
     {
      Comment(error);
      return(0);
     }
//----
   for(bar_tf=CountBars;bar_tf>=0;bar_tf--)
     {
      time1=iTime(NULL,PeriodName,bar_tf);
      i=bar_tf-1;
      if (i<0)
         time2=Time[0];
      else
         time2=iTime(NULL,PeriodName,i)-Period()*60;
      open_price=iOpen(NULL,PeriodName,bar_tf);
      close_price=iClose(NULL,PeriodName,bar_tf);
//---
      ObjectCreate("Objtf"+num,OBJ_RECTANGLE,0,time1,open_price,time2,close_price);
      if (time2-time1<PeriodName*60/2)
         time2=Time[0];
      else
         time2=time1+PeriodName*60/2;
      num++;
//----
      ObjectCreate("Objtf"+num,OBJ_TREND,0,time2,iHigh(NULL,PeriodName,bar_tf),time2,iLow(NULL,PeriodName,bar_tf));
      ObjectSet("Objtf"+num, OBJPROP_WIDTH, 2);
      ObjectSet("Objtf"+num, OBJPROP_RAY, false);
      ObjectSet("Objtf"+num, OBJPROP_BACK, true);
//----
      if (close_price>open_price)
        {
         ObjectSet("Objtf"+(num-1),OBJPROP_COLOR, Bull);
         ObjectSet("Objtf"+num,OBJPROP_COLOR, Bull);
        }
      else
        {
         ObjectSet("Objtf"+(num-1),OBJPROP_COLOR, Bear);
         ObjectSet("Objtf"+num,OBJPROP_COLOR, Bear);
        }
      num++;
     }
   return(0);
  }
//+------------------------------------------------------------------+
Comments