Indicator

LSMA_ind_03

LSMA_ind_03x
Indicator

LSMA_ind_03x

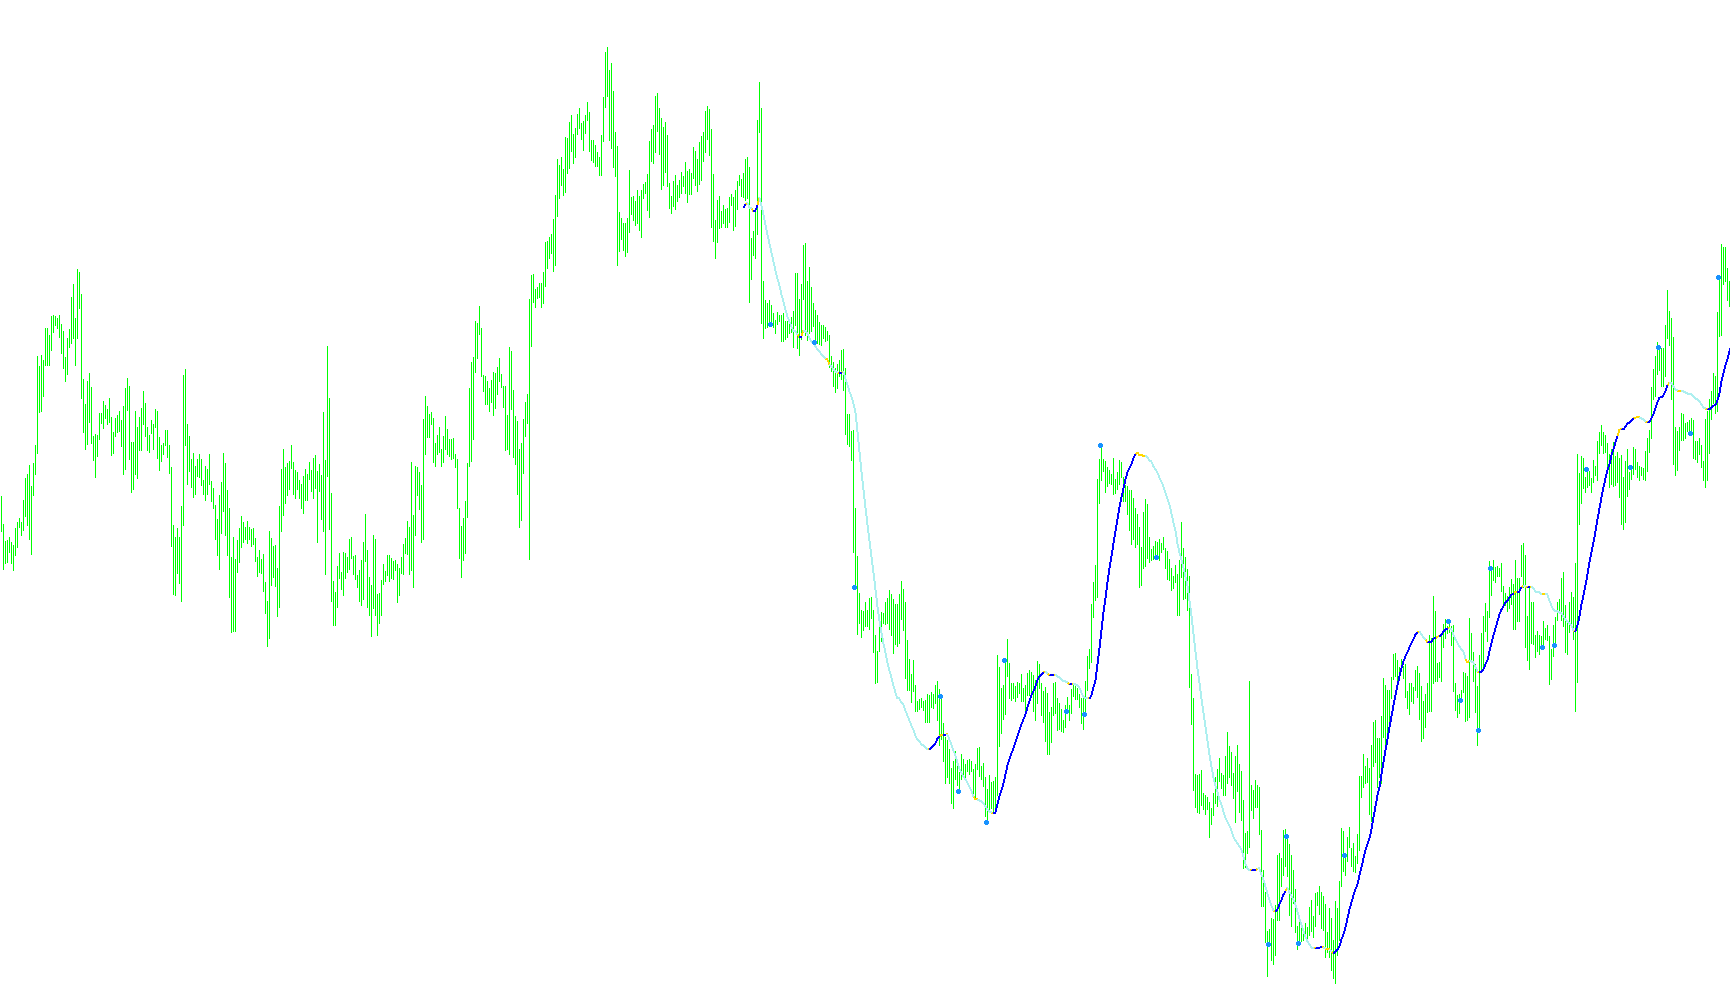
This indicator calculates a linear weighted moving average to identify trend reversals and provides visual signals based on consecutive directional shifts.

LSMA_ind_03x_v1
Indicator

LSMA_ind_03x_v1

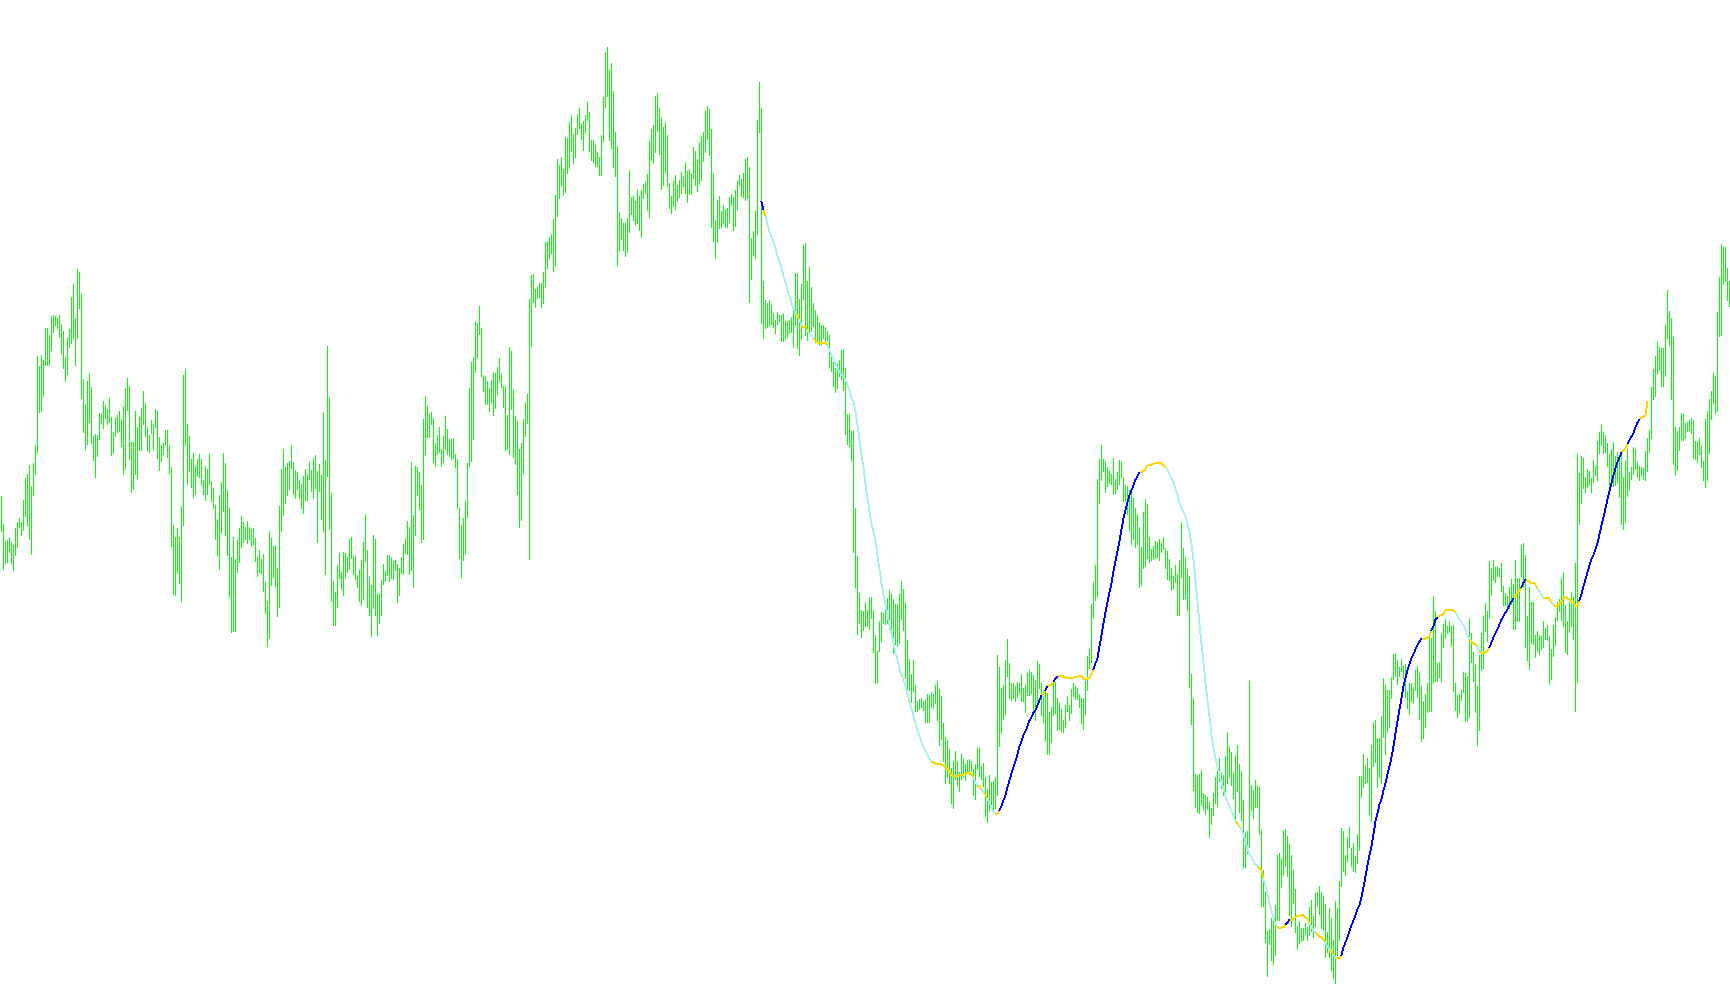
This indicator calculates a smoothed moving average to identify directional momentum shifts and triggers visual signals upon consecutive trend confirmations.

Indicator

LSMA_ind_03_v1

LSMA_ind_04
Indicator

LSMA_ind_04

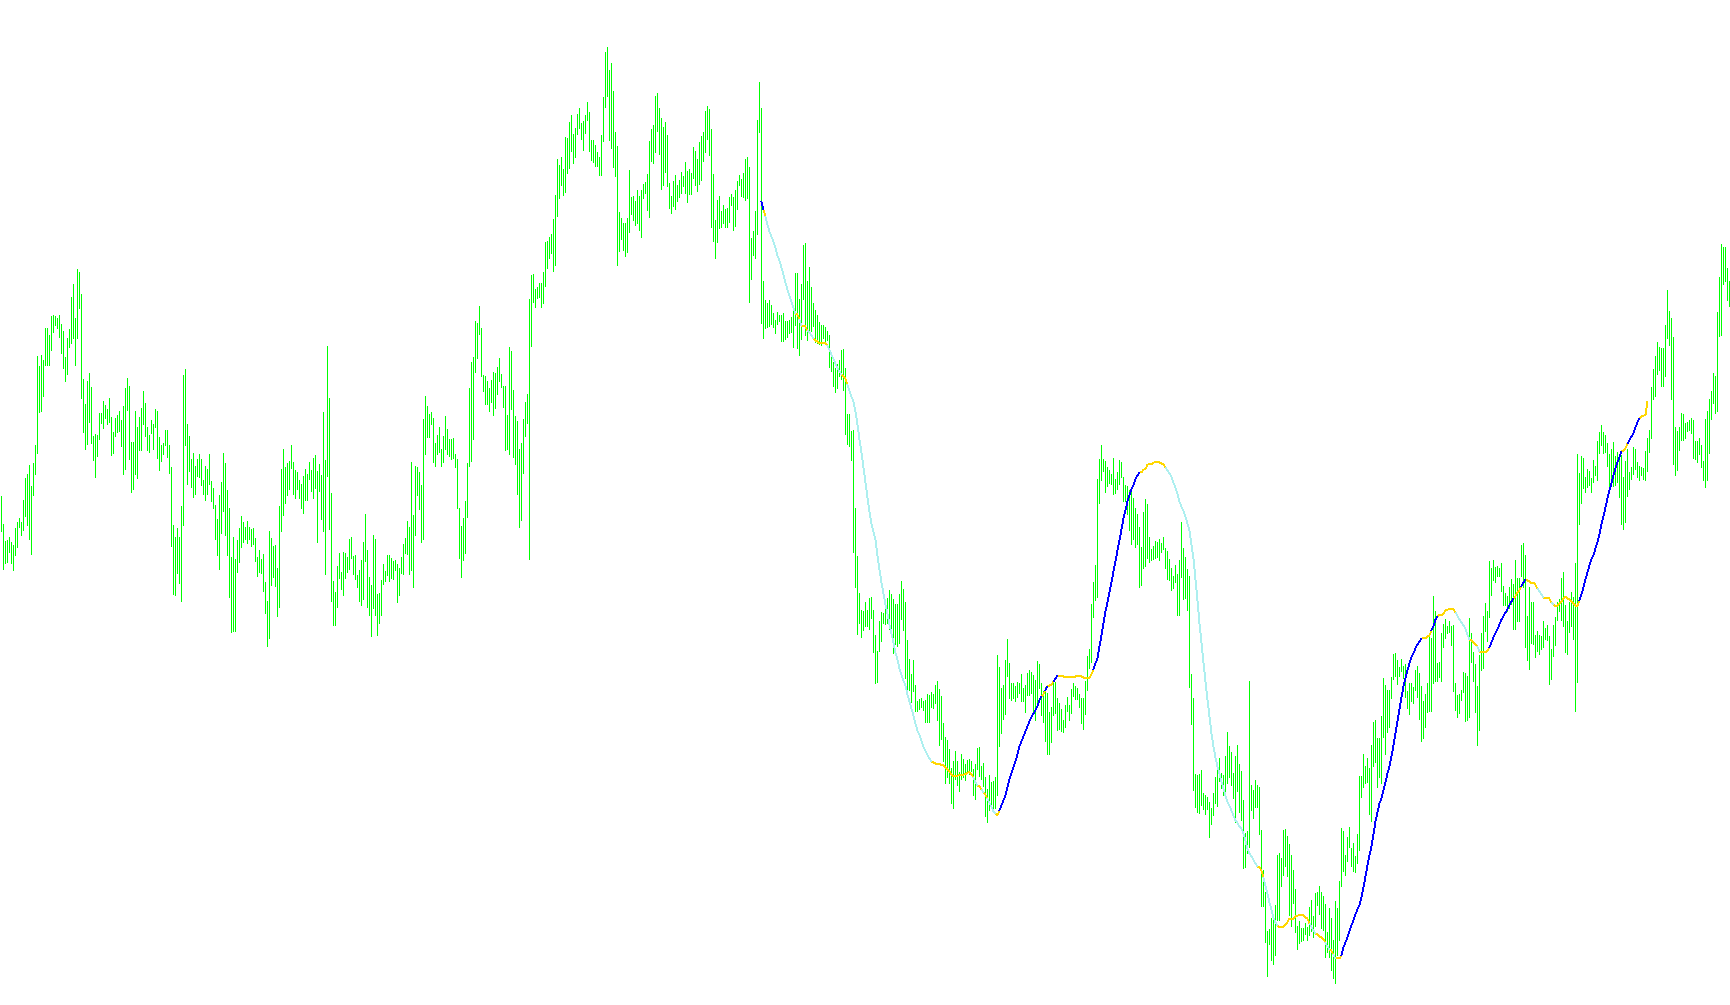
This indicator calculates a weighted linear summation of price action to identify momentum shifts and signal trend reversals through cumulative count thresholds.

LSMA_ind_04_v1
Indicator

LSMA_ind_04_v1

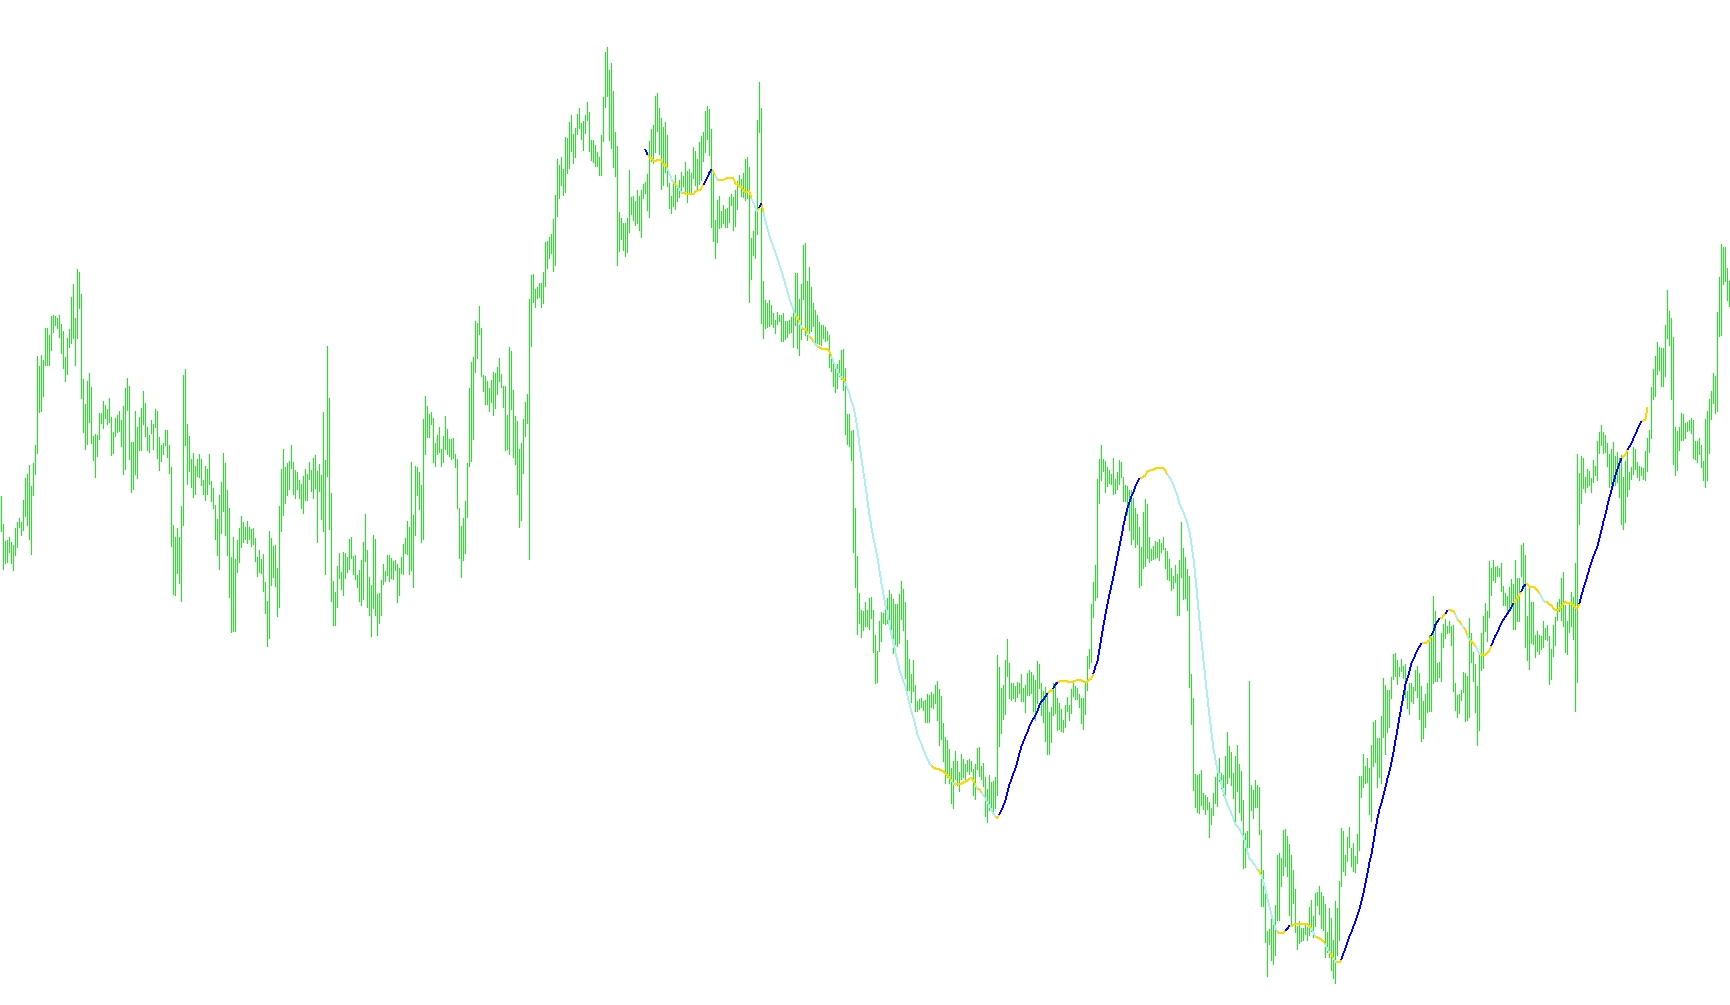
This indicator calculates a weighted sum of historical closing prices to determine trend momentum and generates signal markers based on sequential polarity shifts.

LSMA_ind_05
Indicator

LSMA_ind_05

This indicator calculates a weighted linear moving average and dynamically visualizes price momentum shifts by filtering out growth or decay signals based on a defined threshold.

LSMA_ind_06
Indicator

LSMA_ind_06

This indicator calculates a weighted moving average based on price progression and visualizes trend reversals by dynamically filtering color signals against a specific point-based volatility threshold.

LSMA_ind_12
Indicator

LSMA_ind_12

This indicator visualizes Linear Weighted Moving Average trends by dynamically shifting buffer colors based on momentum velocity and specific slope thresholds.

LSMA_ind_12xxx
Indicator

LSMA_ind_12xxx

This indicator visualizes Linear Weighted Moving Average dynamics by dynamically coloring the trajectory based on real-time slope inclination and velocity.

LSMA_in_Color
Indicator

LSMA_in_Color

This indicator calculates a weighted cumulative price average to identify momentum shifts and trend transitions through dynamic color-coded path fluctuations.

LSMA_in_Color3
Indicator

LSMA_in_Color3

This indicator calculates a weighted moving average of price action to identify and visualize shifts in directional momentum velocity.

LSMA_in_color_00a
Indicator

LSMA_in_color_00a

This indicator calculates a Linear Weighted Moving Average to identify trend reversals by tracking consecutive directional shifts and triggering signals once six continuous momentum movements occur.

LSMA_in_color_00a_v1
Indicator

LSMA_in_color_00a_v1

This indicator utilizes a Linear Stochastic Moving Average to identify trend reversals by tracking consecutive directional shifts in price momentum.

LSMA_in_Color_v1
Indicator

LSMA_in_Color_v1

The indicator calculates a weighted moving average based on price distance to generate dynamic momentum directional shifts.

LSMA_Line
Indicator

LSMA_Line

This indicator calculates a linear regression line based on historical price data to project trend trajectories and define volatility boundaries using standard deviation offsets.

LSMA_Line_v1
Indicator

LSMA_Line_v1

This indicator calculates a dynamic regression trendline and equidistant boundary channels based on the statistical deviation of price action over a specific lookback period.

LSMA_Line_v2
Indicator

LSMA_Line_v2

This indicator calculates a linear best-fit trendline using the least squares method to project a mean price path and dynamic standard deviation boundaries.

LSMA_NRP
Indicator

LSMA_NRP

iMA

This indicator identifies directional shifts by calculating the weighted difference between Linear Weighted and Simple Moving Averages to highlight momentum transitions.

LSMA_v1
Indicator

LSMA_v1

This indicator calculates a weighted linear moving average and visualizes directional momentum shifts through distinct color-coded buffer transitions.

LSMA_v2
Indicator

LSMA_v2

This indicator calculates a Linear Weighted Moving Average and visualizes momentum shifts through dynamic color-coded trend transitions.

lsma_v3
Indicator

lsma_v3

This indicator calculates a least squares moving average by applying a linear regression formula to price data to identify the underlying trend line.

lsma_VininLRMA
Indicator

lsma_VininLRMA

iMA

This indicator calculates a dynamic trend line by applying a weighted linear combination of Simple Moving Average and Linear Weighted Moving Average values.

Lswpr_Angle
Indicator

Lswpr_Angle

This indicator quantifies the directional velocity of an Exponential Moving Average by calculating the angular gradient between two historical points to identify trend strength and consolidation zones.

Lswpr_Angleexp
Indicator

Lswpr_Angleexp

Quantifies momentum by calculating the rate of change between two distinct historical points on an Exponential Moving Average to identify trend exhaustion or acceleration.

Lswpr_Angleexp2
Indicator

Lswpr_Angleexp2

This indicator quantifies the directional slope of an Exponential Moving Average to identify momentum strength and periods of price consolidation.

LSwpr_in+Color
Indicator

LSwpr_in+Color

iWPR

This indicator calculates a weighted sum of Williams Percent Range (WPR) values across a defined period to visualize momentum trends through color-coded price velocity.

LSwpr_in_Color
Indicator

LSwpr_in_Color

iWPR

The indicator calculates a weighted moving average of the Williams %R values to visualize directional momentum shifts through color-coded trend transitions.

LSwpr_in_Color_mtf
Indicator

LSwpr_in_Color_mtf

iWPR

This indicator calculates a Linear Smoothed Weighted oscillator based on the Williams Price Range to visualize momentum shifts across multiple timeframes with dynamic color coding.

lugree
Indicator

lugree

This indicator calculates a weighted momentum ratio using Laguerre polynomials to quantify price velocity and relative strength.

lukas1 Arrows & Curves
Indicator

lukas1 Arrows & Curves

This indicator identifies trend reversals by monitoring price breaches of dynamic volatility channels derived from high and low extrema.

lukas1
Indicator

lukas1

This indicator identifies trend reversal points by monitoring price breaches of volatility-adjusted upper and lower boundaries calculated from historical high-low ranges.

LW Fractals
Indicator

LW Fractals

Identifies structural price pivots by verifying if a candle's high or low stands as a local peak relative to a user-defined surrounding neighborhood of bars.

LWMA-Crossover_Signal
Indicator

LWMA-Crossover_Signal

iMA

Identifies precise bullish and bearish reversal points by detecting dynamic crossovers between two distinct linear weighted moving average periods.

LWMA-Crossover_Signal_v1
Indicator

LWMA-Crossover_Signal_v1

iMA

This indicator identifies precise trend reversal points by detecting the intersection of two Linear Weighted Moving Averages and projecting visual markers based on local price volatility.

LWMA-Crossover_Signal_v3
Indicator

LWMA-Crossover_Signal_v3

iMA

This indicator identifies precise bullish and bearish shift points by detecting the intersection of two linear weighted moving averages with a volatility-adjusted offset.

LWMA2
Indicator

LWMA2

iMA

This indicator calculates the numerical spread between twice the primary weighted moving average and the secondary weighted moving average to highlight momentum divergence.
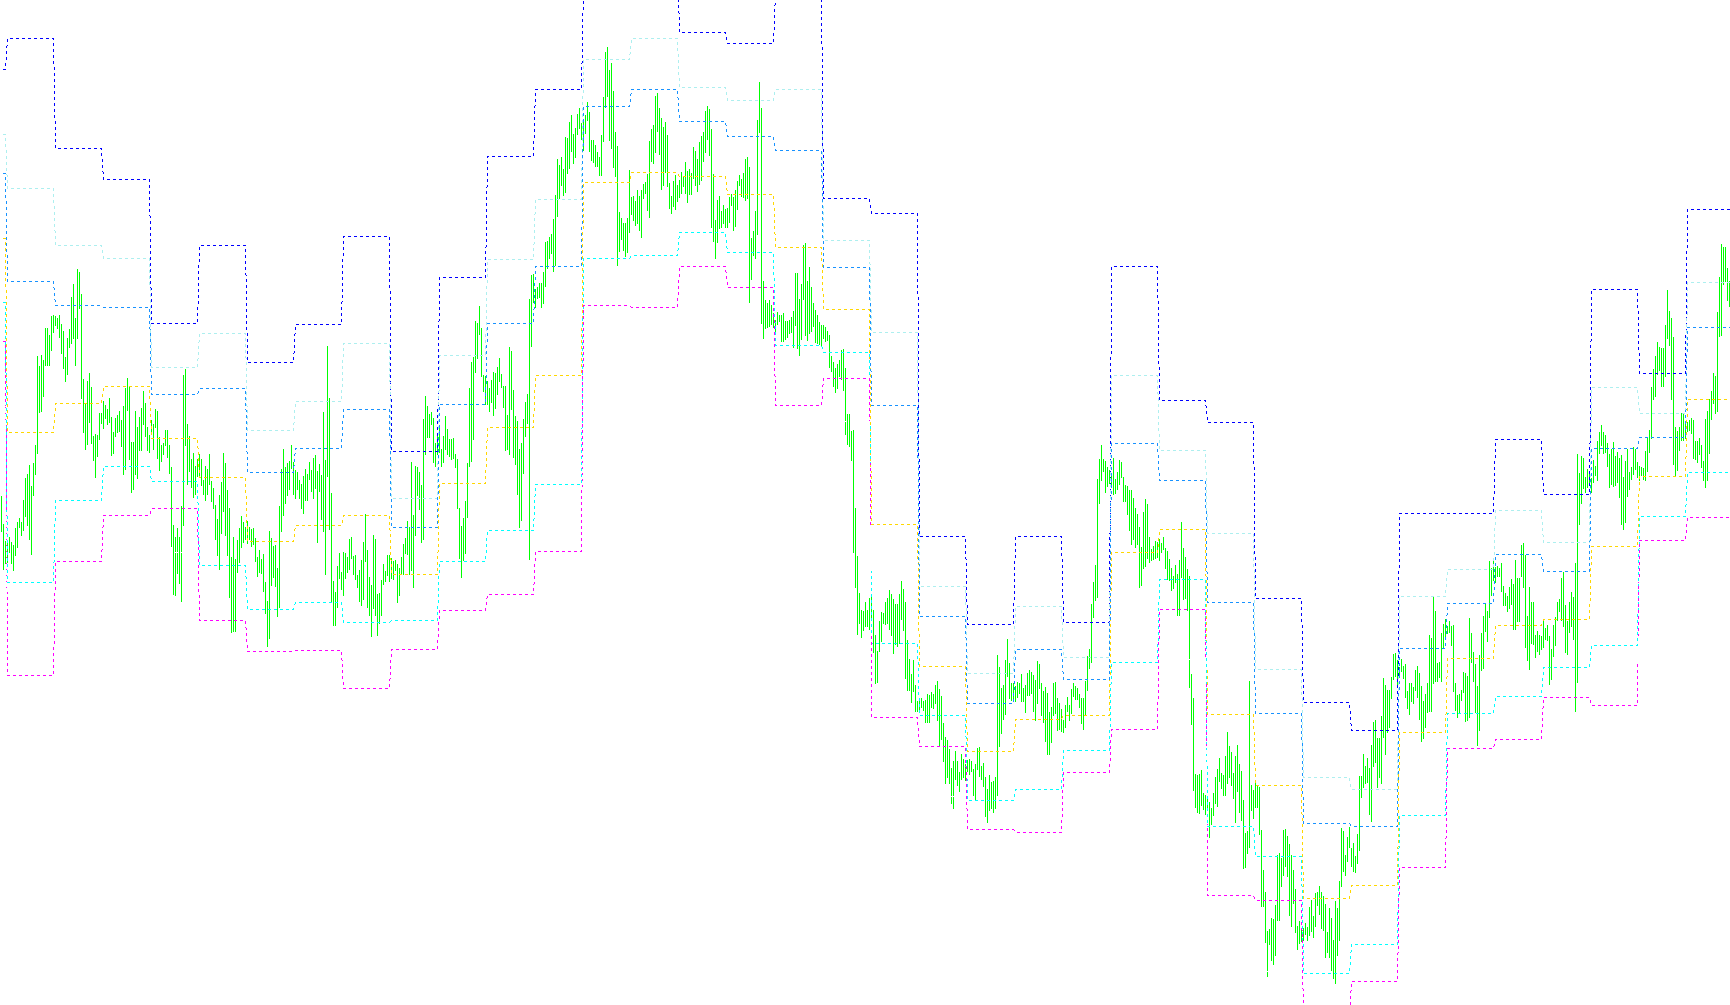
LWMA_ATR
Indicator

LWMA_ATR

iMAOnArray

This indicator calculates a linearly weighted moving average of the true range to quantify real-time market expansion and dynamic price variance.

LWMA_ATR_S
Indicator

LWMA_ATR_S

iMAOnArray

This indicator calculates a linearly weighted moving average of the Average True Range to quantify current market volatility and project a multi-factor price expansion zone.

m-Candles
Indicator

m-Candles

This indicator visualizes higher timeframe price action by plotting historical candle bodies and shadows onto the current chart.

m-Fibonacci
Indicator

m-Fibonacci

This indicator calculates standard pivot points and projects specific Fibonacci retracement levels based on the high, low, and close price of user-defined multi-timeframe bars.

M.A.C.H_X_alert
Indicator

M.A.C.H_X_alert

iMA

Identifies bullish and bearish trend reversals by detecting precise intersections between two shifted simple moving averages while incorporating a volatility-based range calculation for visual markers.

M.A.C.H_X_alert_v2
Indicator

M.A.C.H_X_alert_v2

iMA

Identifies bullish and bearish momentum shifts by detecting precise crossovers between shifted Simple Moving Averages relative to localized volatility ranges.

Indicator

m1v11(killerkhan)

Indicator

M5-GTi-M30

Indicator

M5-GTi-M30_001

MA Candles
Indicator

MA Candles

iMA

This indicator renders real-time price action aesthetics by painting candle bodies and wicks based on the relative bullish or bearish positioning of two distinct moving average crossovers.

MA Chanels FIBO
Indicator

MA Chanels FIBO

iMA

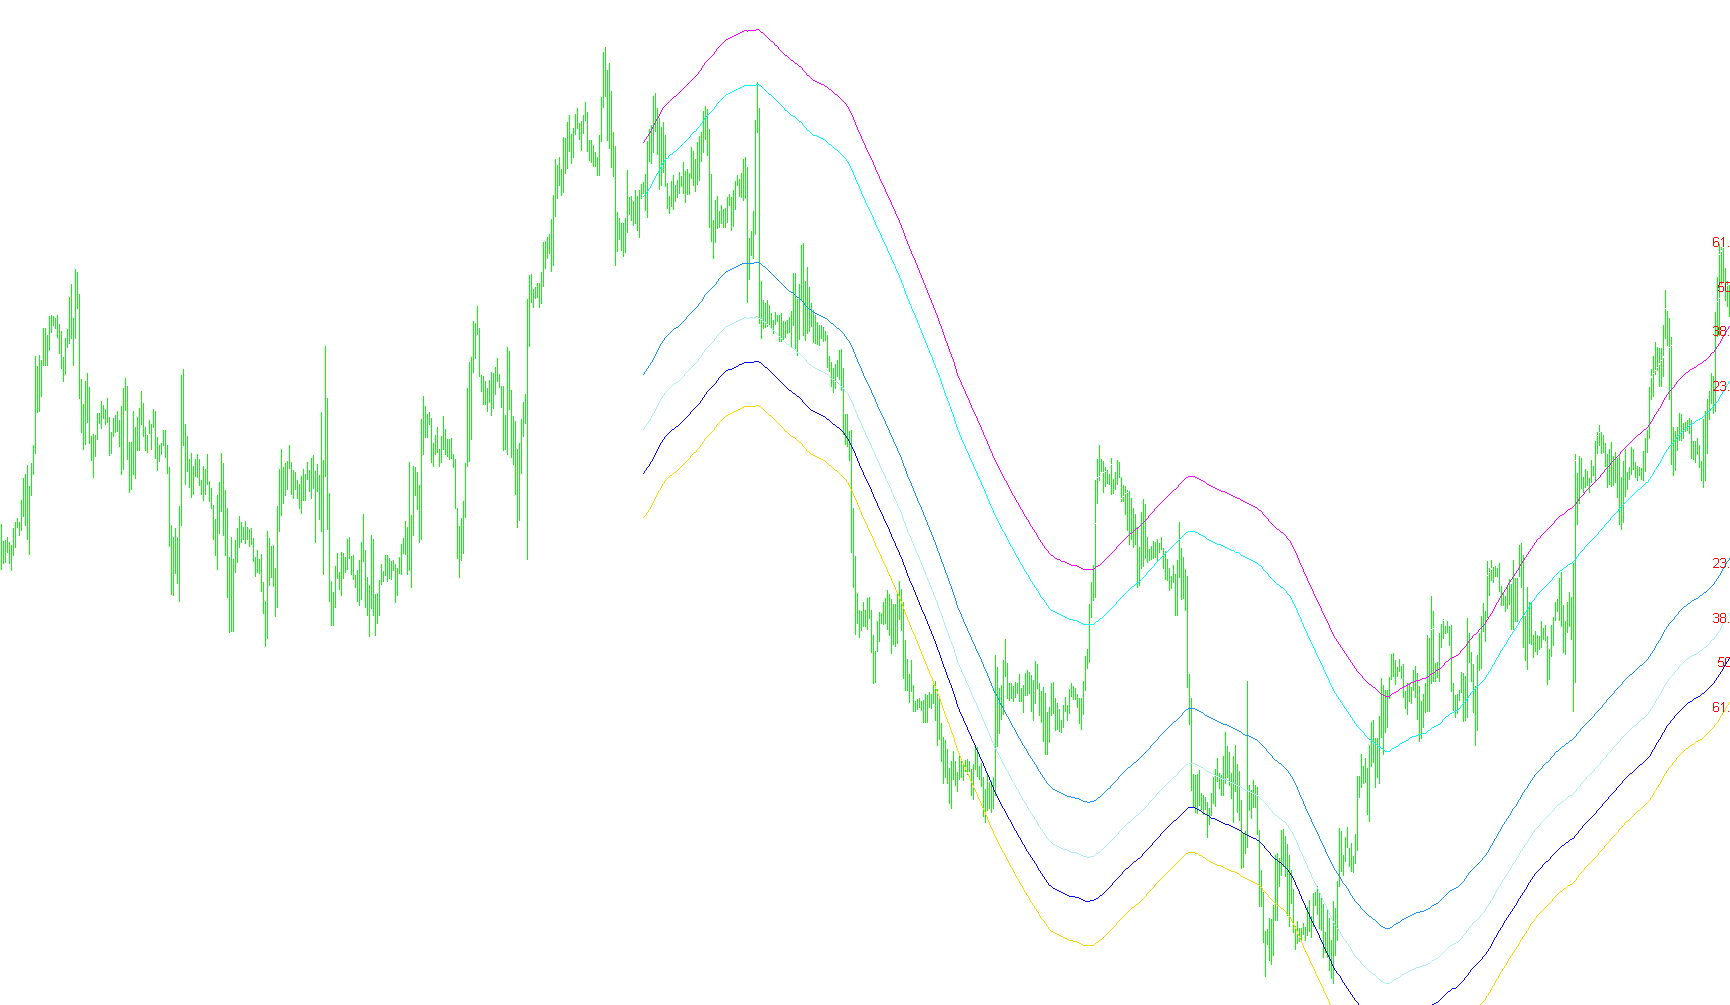
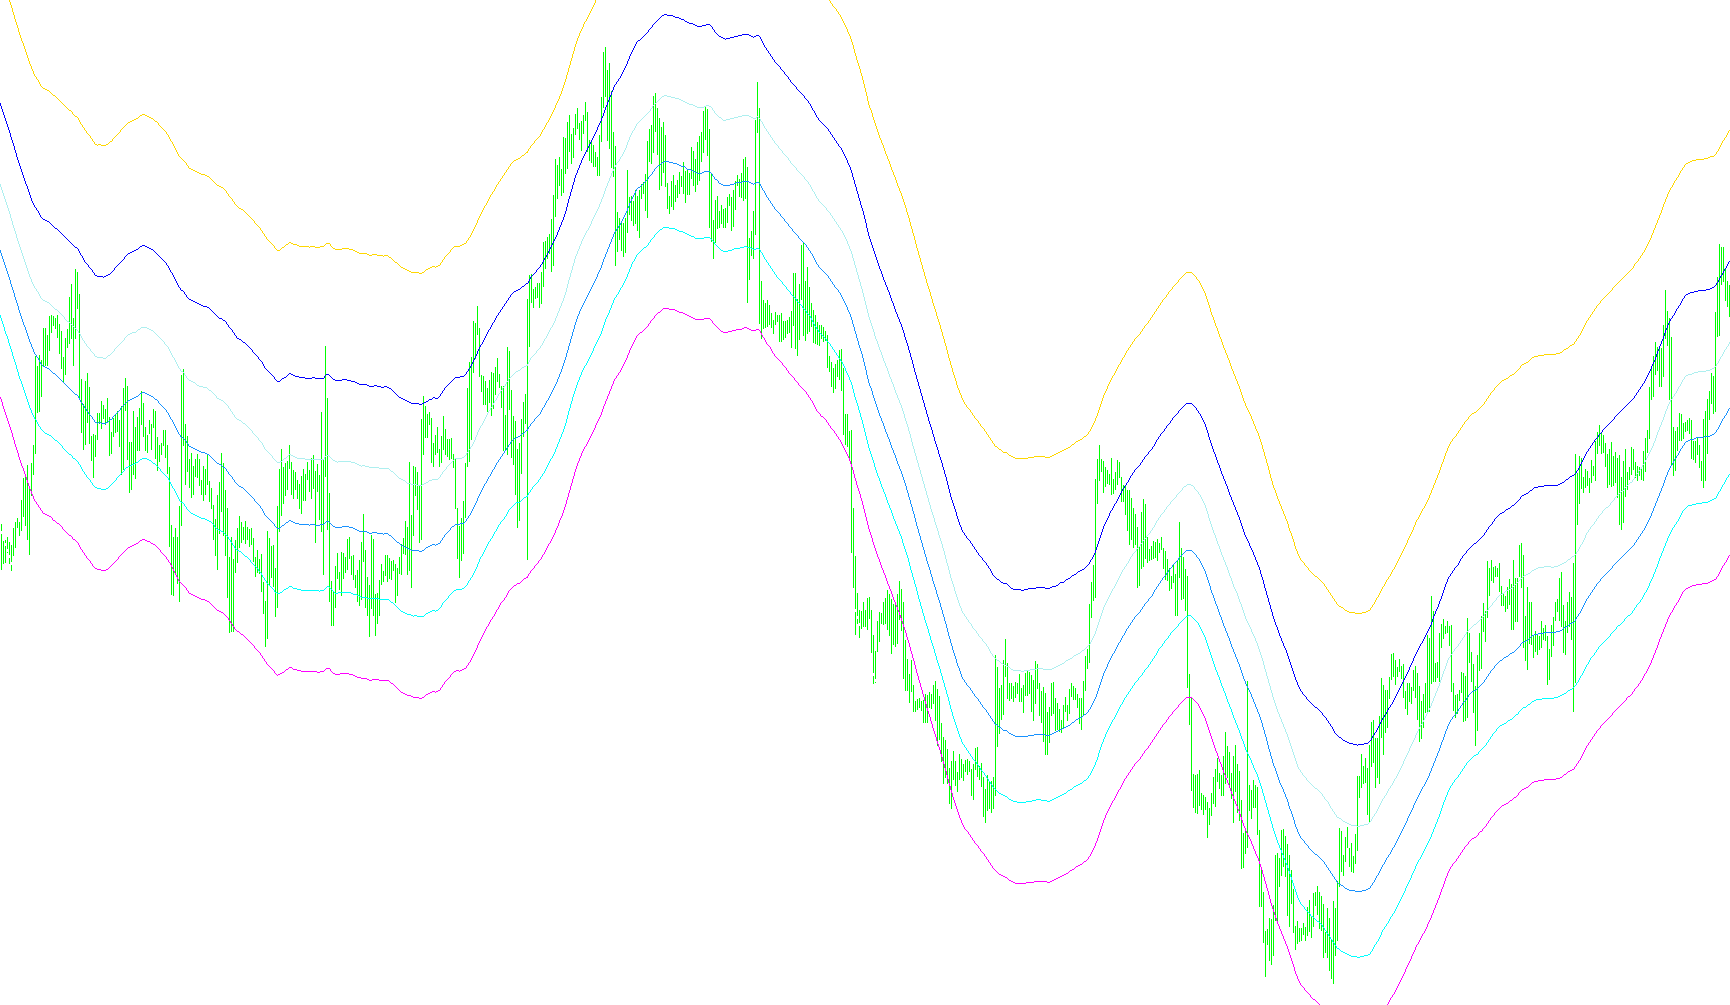
This indicator projects dynamic Fibonacci retracement levels relative to a moving average basis by calculating the historical price extremes within a user-defined lookback period.

MA Chanels FiboEnv Mid
Indicator

MA Chanels FiboEnv Mid

iMA

This indicator projects a multi-layered Fibonacci retracement zone around a moving average by calculating the historical volatility range of price deviations.

MA Chanels
Indicator

MA Chanels

iMA

This indicator projects dual-sided Fibonacci retracement levels based on the maximum historical price deviation from a Simple Moving Average.