Linear Regression Line_v2
Indicator

Linear Regression Line_v2

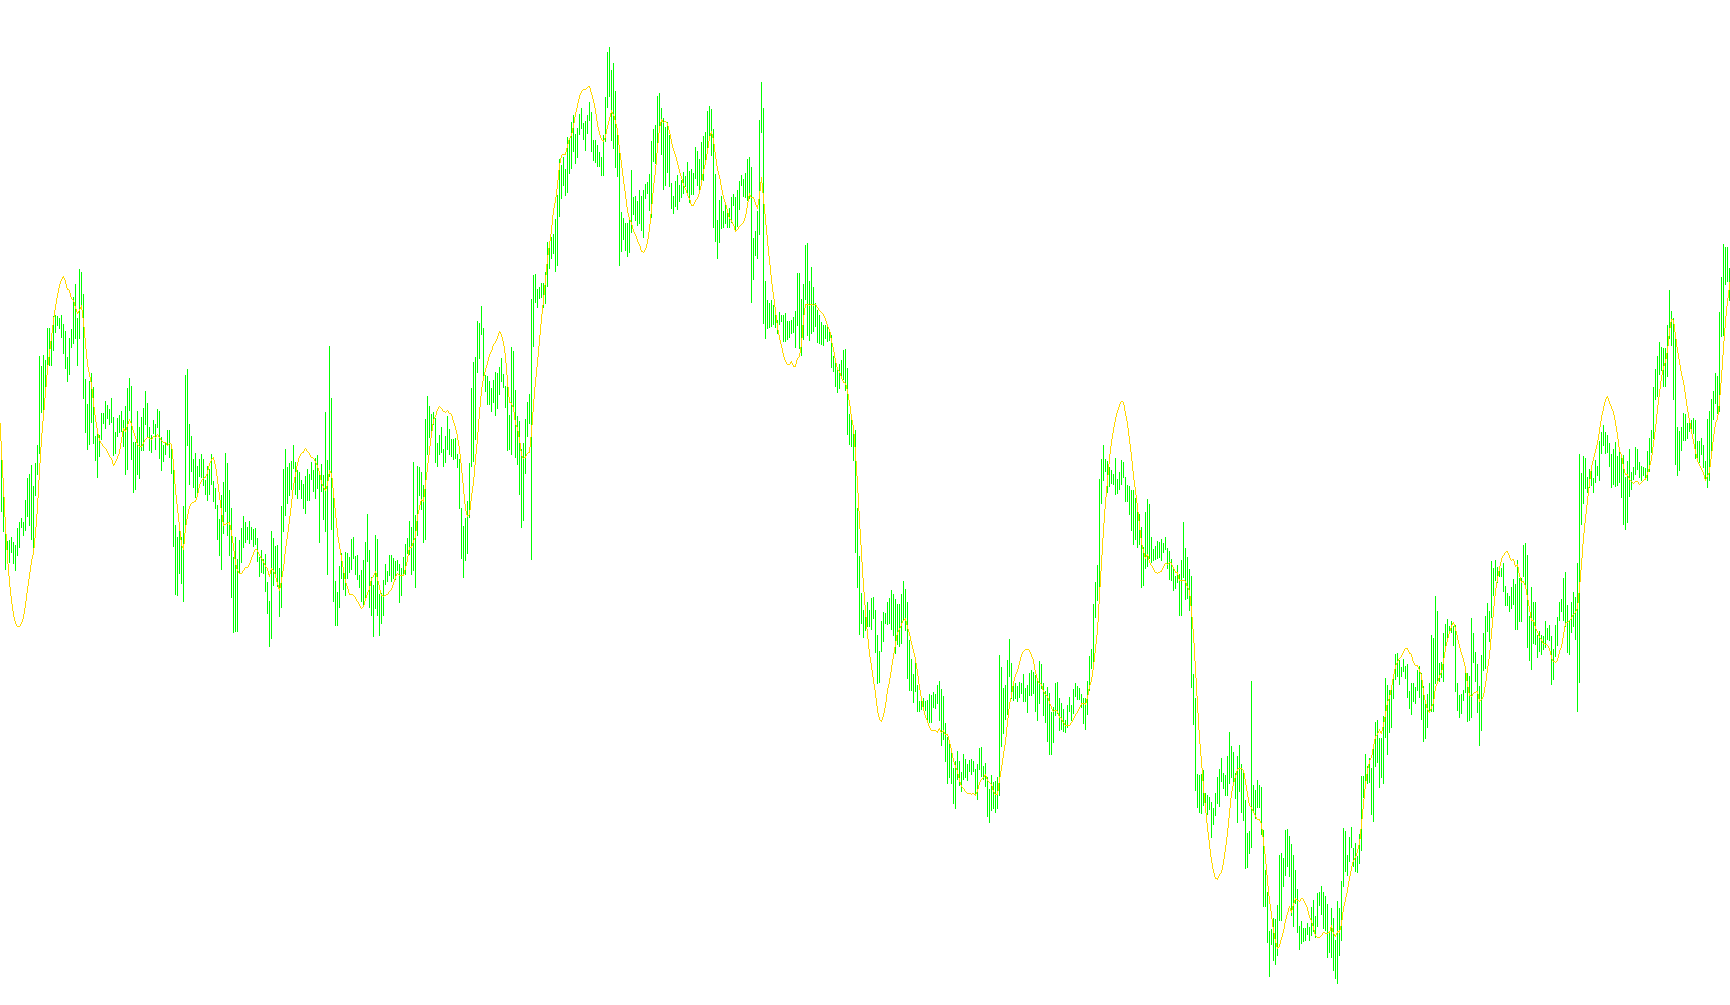
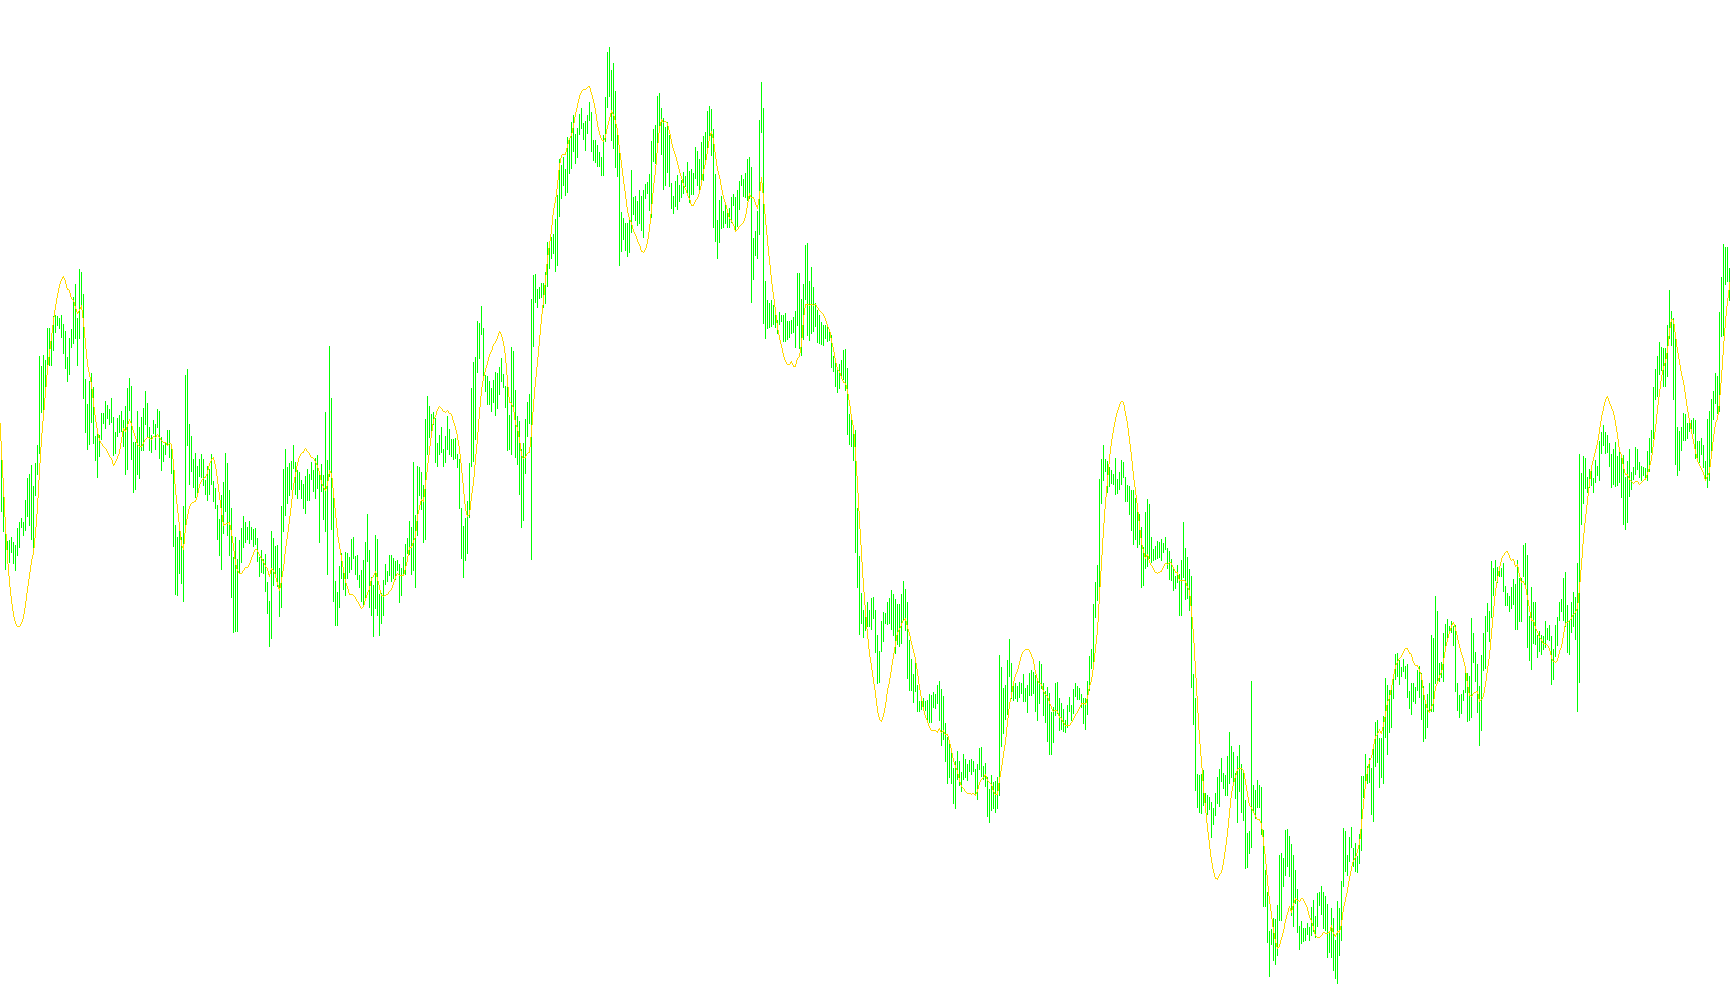
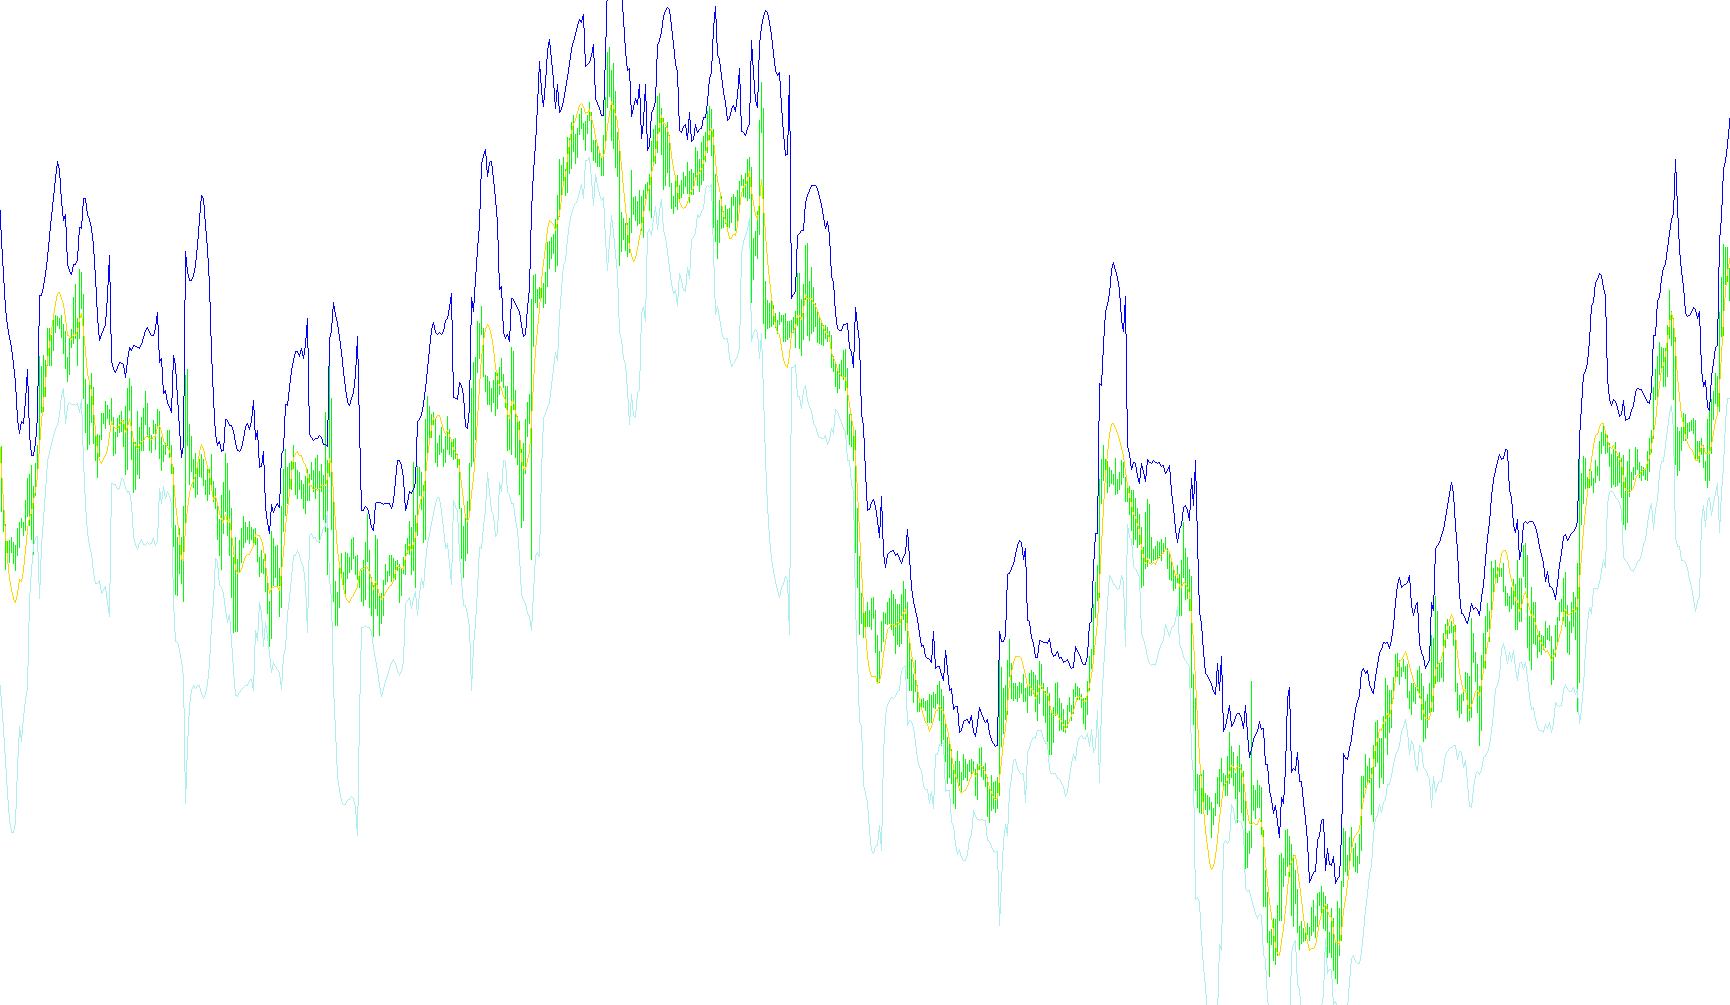
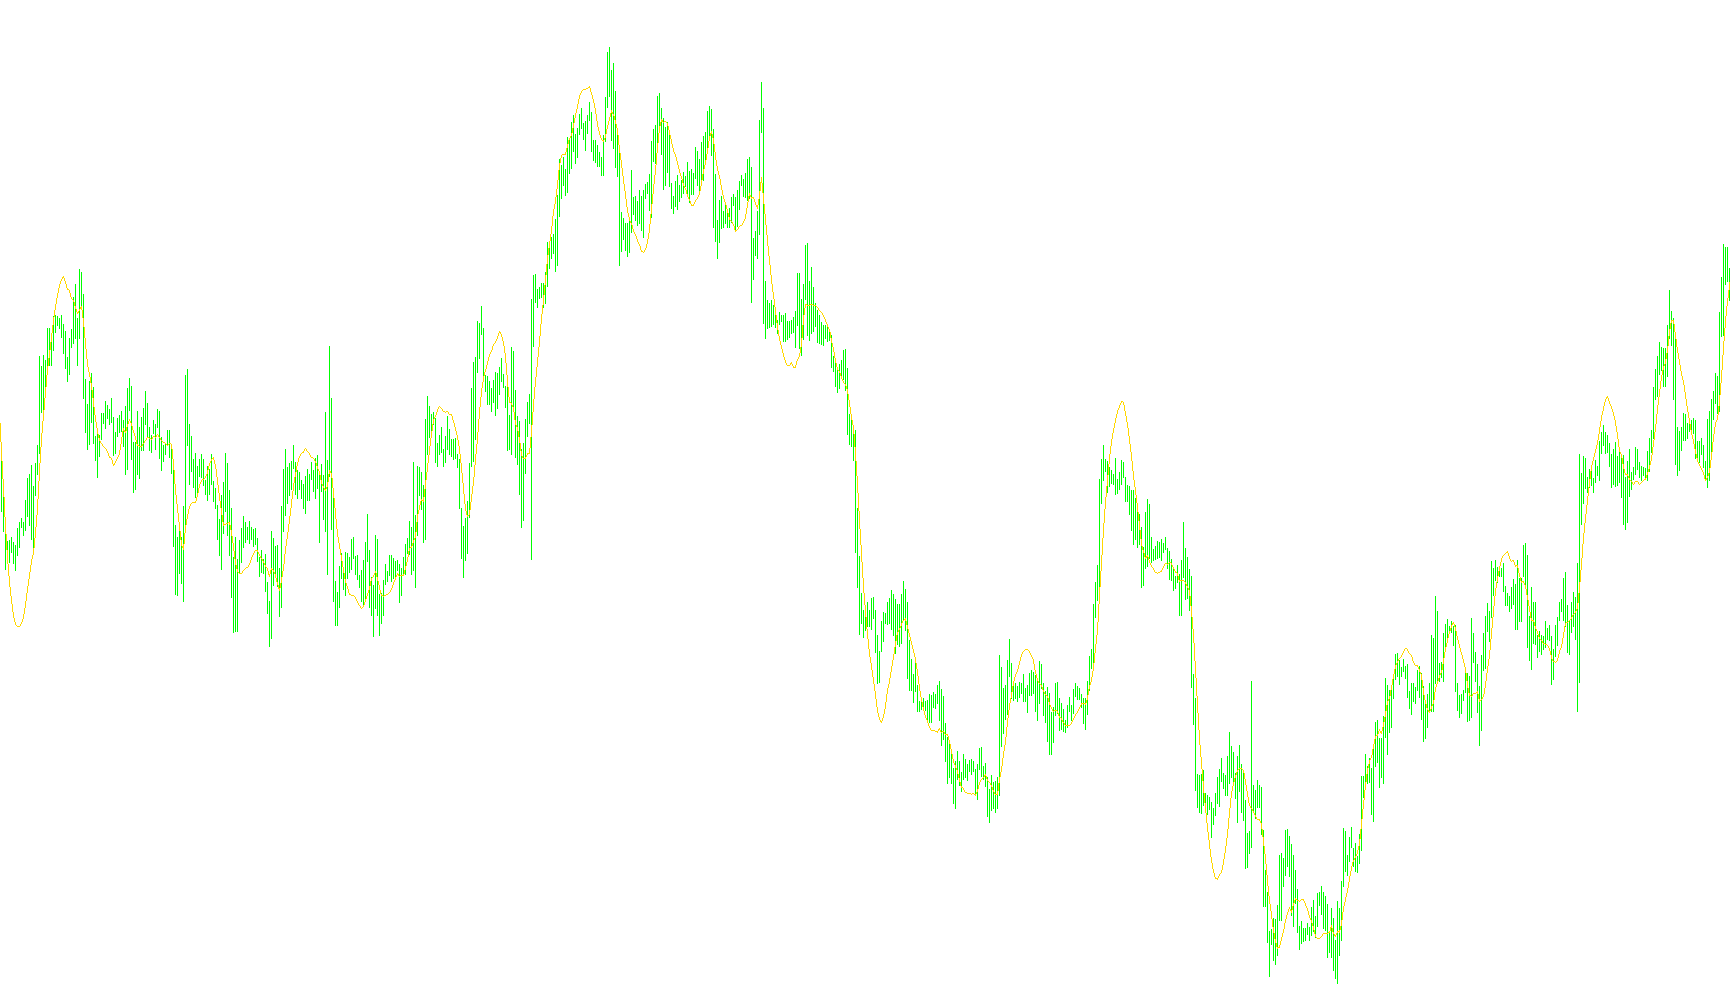
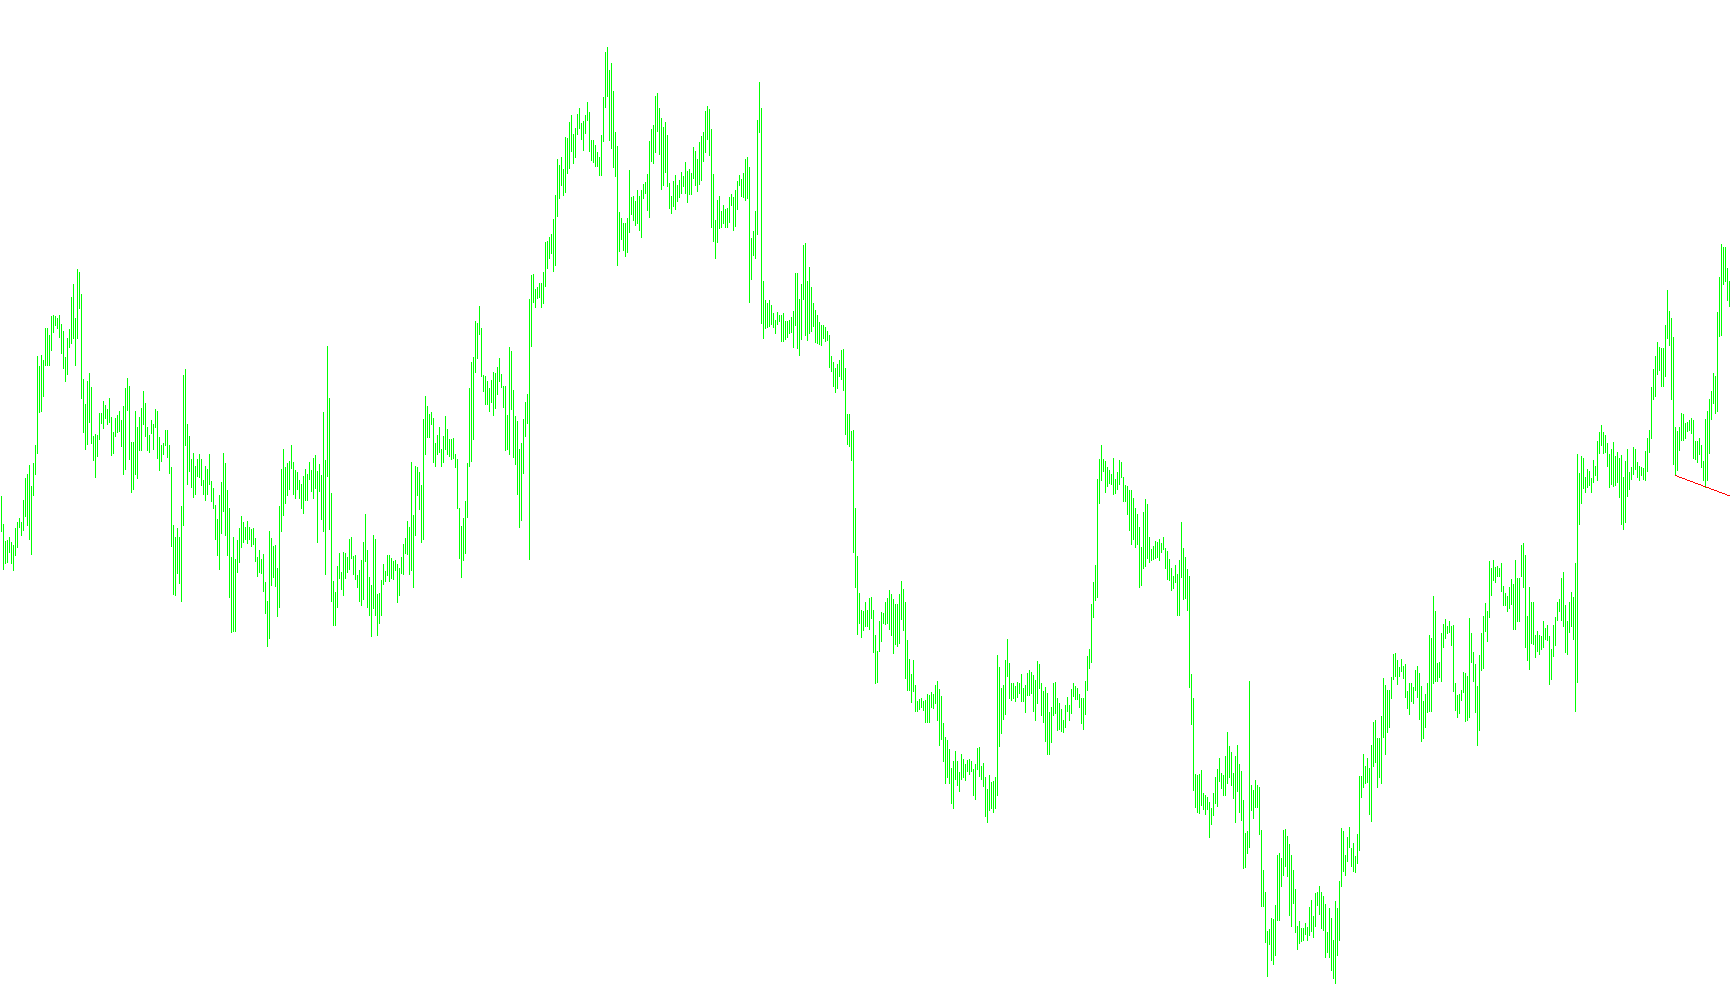
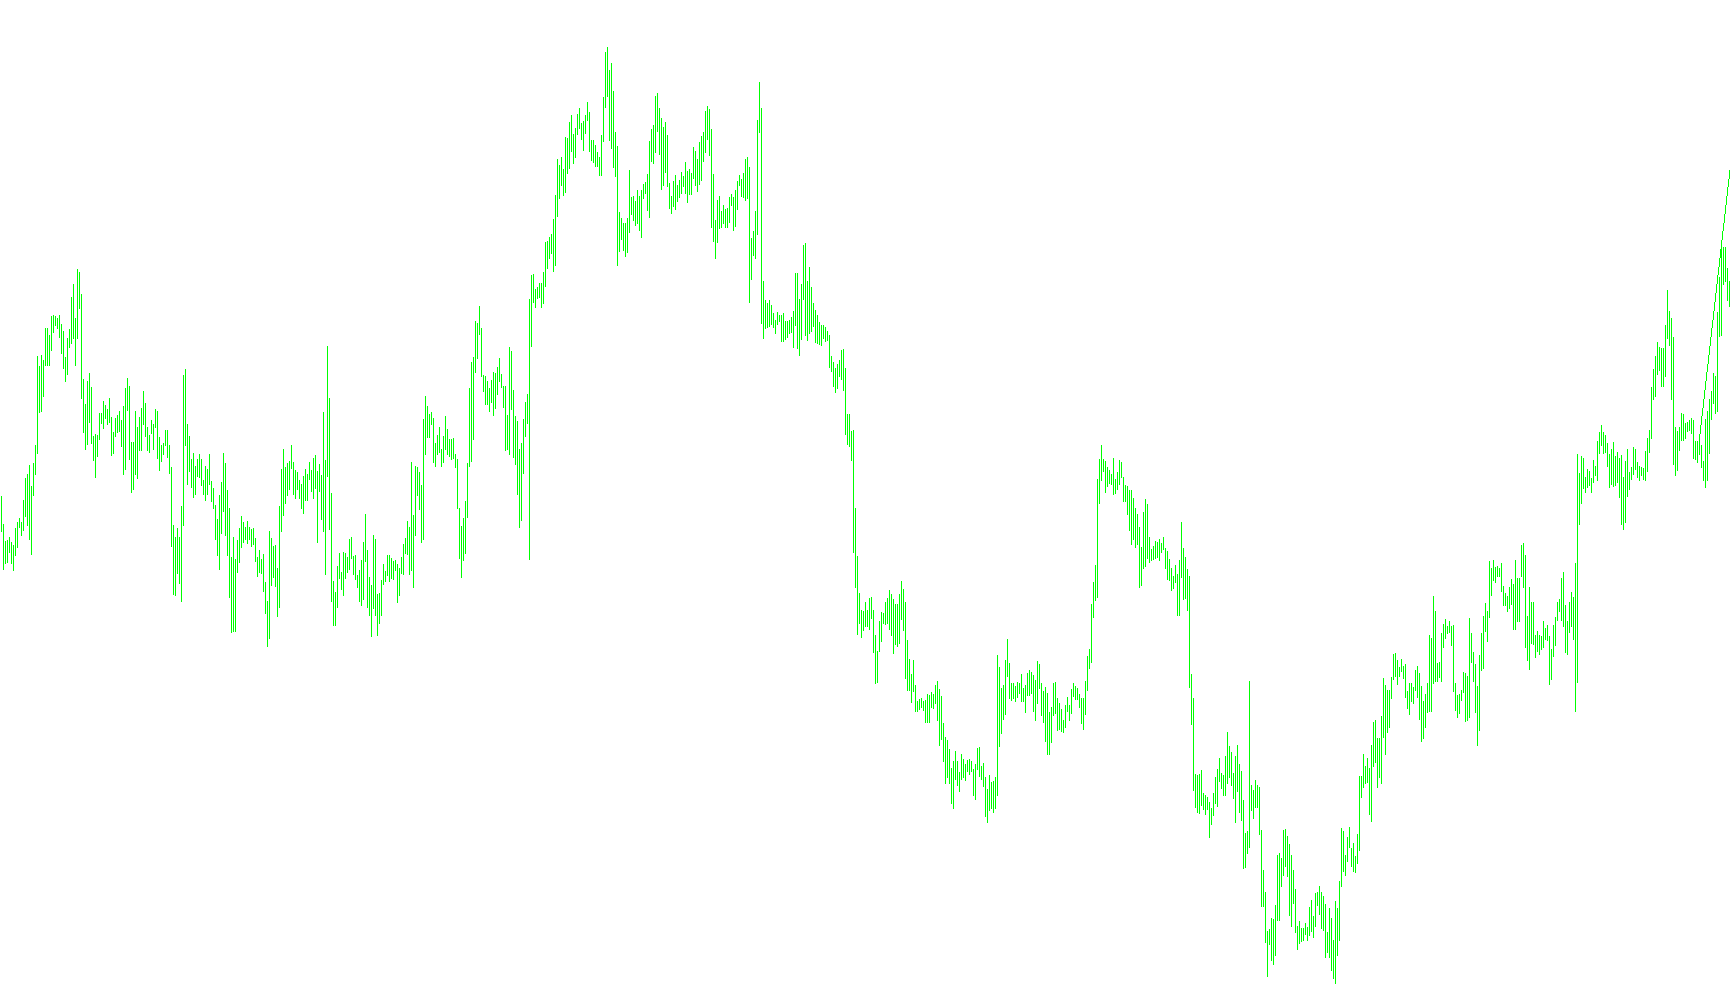
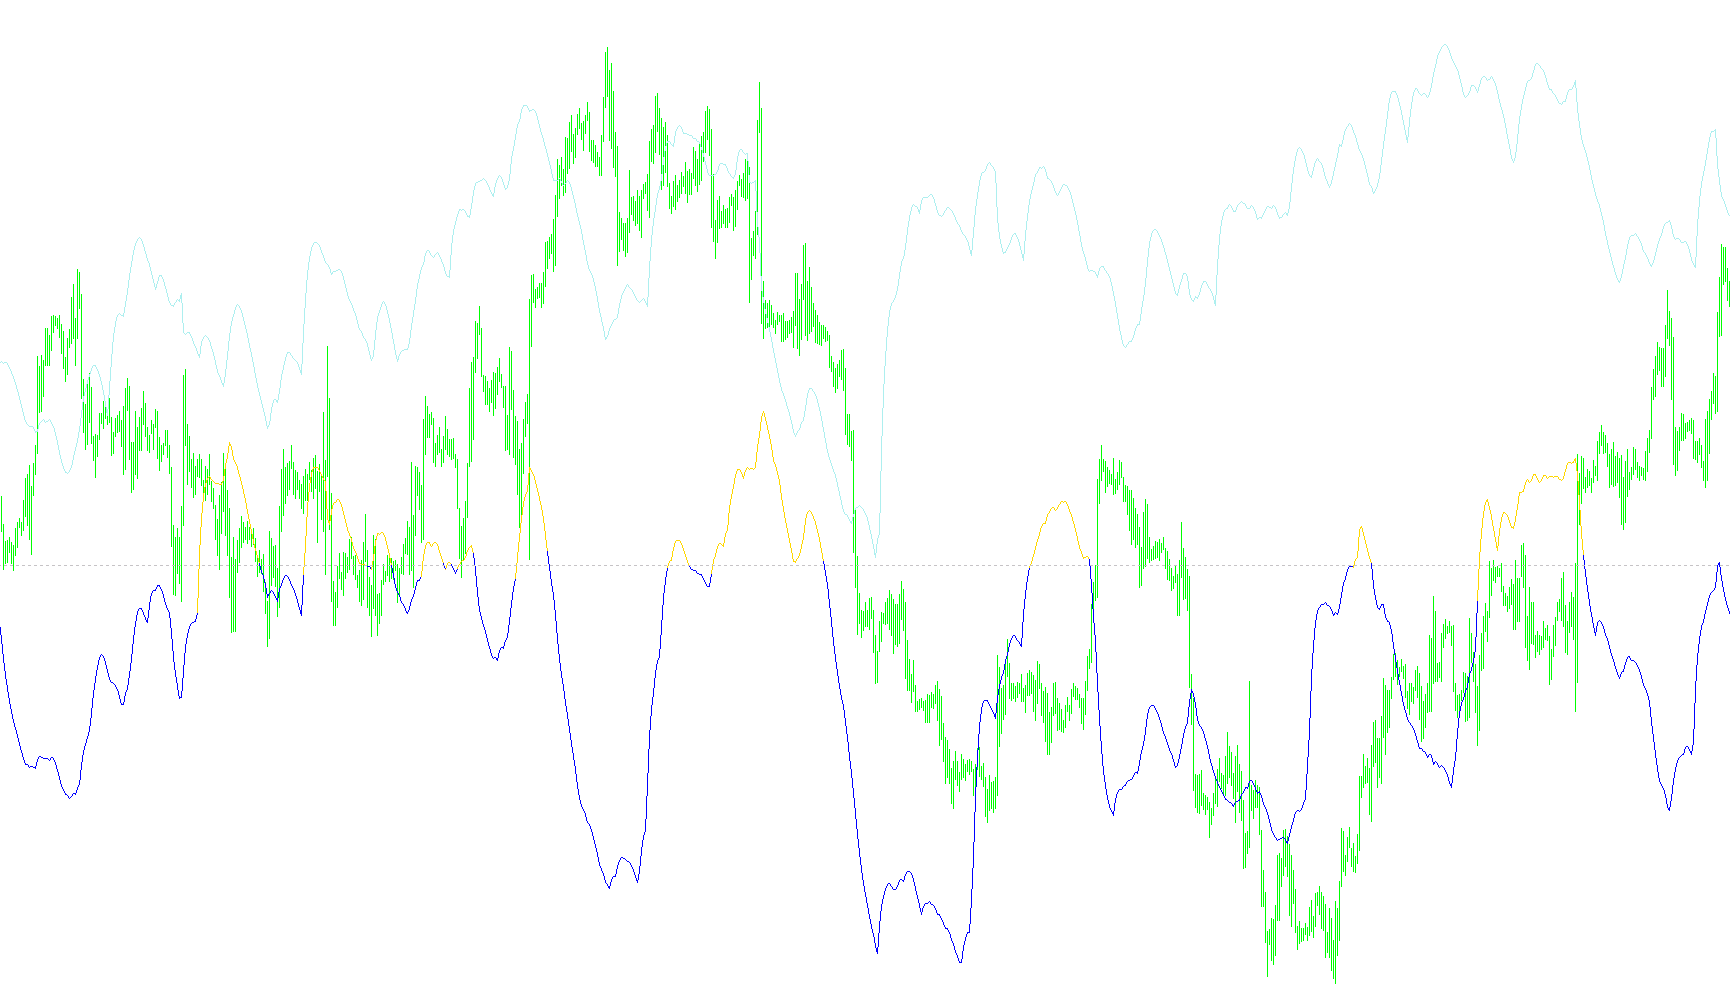
This indicator calculates a mathematical line of best fit by minimizing the vertical deviations between price action points and the regression trajectory.

Indicator

Linear Regression

Indicator

Linear RegressionAppliedPrice

Indicator

Linear RegressionMAAppliedPrice

iMA
Indicator

Linear Regression_v1

Indicator

Linear Regression_v2

Indicator

Linear Regression_v4

Linear%20Regression%20Line
Indicator

Linear%20Regression%20Line

This indicator calculates the best-fit linear trend by computing the mathematical mean of price deviations over a specified historical lookback period.

LinearRegression-REAL
Indicator

LinearRegression-REAL

This indicator calculates a trend line by applying the method of least squares to map the mathematical correlation between price action and time intervals.

LinearRegression-REAL_v1
Indicator

LinearRegression-REAL_v1

This indicator calculates a moving linear regression line by determining the best-fit slope and intercept over a specific lookback period to visualize underlying price trajectories.

LinearRegression
Indicator

LinearRegression

This indicator calculates a linear trendline by applying the least squares method to minimize the variance between closing prices and a regression path over a fixed historical window.

LinearRegressionBands[1]
Indicator

LinearRegressionBands[1]

This indicator identifies the primary price trend line using least squares regression and plots dynamic upper and lower boundaries based on the maximum historical deviation.

LinearRegSlope_v1
Indicator

LinearRegSlope_v1

iMA

Quantifies the rate of change in price momentum by calculating the mathematical derivative of a linear least-squares regression over a rolling period.

LinearRegSlope_v1_v1
Indicator

LinearRegSlope_v1_v1

iMA

This indicator calculates the mathematical rate of change by determining the slope of a least-squares linear regression line over a specified lookback period.

Linear_Price_BarM_mtf
Indicator

Linear_Price_BarM_mtf

This indicator quantifies relative price movement by calculating high, low, and close deviations from the open price across specified higher timeframes.

Linear_Price_Bar_mtf
Indicator

Linear_Price_Bar_mtf

This indicator calculates and visualizes the price expansion from the opening price across different timeframes to determine bullish and bearish momentum intensity.

Linear_Regression_Line_wAppliedPrice
Indicator

Linear_Regression_Line_wAppliedPrice

This indicator calculates the least squares regression line to project the central tendency of price action based on a user-defined historical window.

LineFractals_Alert
Indicator

LineFractals_Alert

iFractals
LineFractals_Alert_v1
Indicator

LineFractals_Alert_v1

iFractals
LineFrakDown
Indicator

LineFrakDown

iFractals
LineFrakDown_v1
Indicator

LineFrakDown_v1

iFractals
LineFrakUp
Indicator

LineFrakUp

iFractals
LineFrakUp_v1
Indicator

LineFrakUp_v1

iFractals
Lines HiLo_ Periodical
Indicator

Lines HiLo_ Periodical

This indicator dynamically maps and projects horizontal price levels for the highest and lowest extremes across daily, weekly, monthly, and yearly cycles.

Lines_buy(1)
Indicator

Lines_buy(1)

This indicator renders a sequence of horizontal price levels anchored to a primary coordinate, expanding incrementally based on user-defined pip offsets.

Lines_buy
Indicator

Lines_buy

This indicator projects a series of horizontal price levels based on cumulative point increments relative to an anchor price.

Indicator

Lines_Create

Indicator

Lines_Delete

Lines_HiLo_CashCow
Indicator

Lines_HiLo_CashCow

This indicator visualizes daily and historical price extremes by plotting dynamic support and resistance lines based on previous range volatility.

Lines_HiLo_Yesterday
Indicator

Lines_HiLo_Yesterday

This indicator visualizes historical price extremes by projecting previous session highs and lows onto the current chart to establish significant liquidity zones.

Indicator

Lines_RASST

Lines_sell
Indicator

Lines_sell

This indicator automatically plots a series of horizontal sell levels at equidistant intervals below a user-defined anchor price to visualize a tiered downside grid.

Line_Regresion_D
Indicator

Line_Regresion_D

Calculates a linear regression trend line based on the opening prices of consecutive trading days to project momentum shifts.

line_Volum
Indicator

line_Volum

This indicator calculates the average price deviation over a rolling window by aggregating relative spreads between historical highs, lows, and closing prices.

linreg
Indicator

linreg

This indicator calculates a linear regression line to project price trends and highlights momentum shifts through dynamic color coding of the slope trajectory.

linreg_v1
Indicator

linreg_v1

The indicator calculates the projected value of a linear trend by solving the ordinary least squares method over a specified lookback period to identify the current trajectory point.

linreg_v2
Indicator

linreg_v2

This indicator calculates the linear regression line over a dynamic period to identify and visualize momentum shifts through directional slope transitions.

Live Charts Fib Pivots
Indicator

Live Charts Fib Pivots

This indicator projects dynamic support and resistance zones by synthesizing standard pivots, Fibonacci-weighted levels, and Camarilla range boundaries onto a single visual interface.

Live Charts Fib Pivots1
Indicator

Live Charts Fib Pivots1

This indicator dynamically projects synchronized Fibonacci retracements, Camarilla break levels, and multi-layered midpoint pivots based on historical price range volatility.

Live Charts Fib Pivots1_v1
Indicator

Live Charts Fib Pivots1_v1

This indicator projects dynamic support and resistance levels by synthesizing Standard Pivots, Camarilla range breakouts, and Midpoint distribution based on historical price action.

Live Charts Fib Pivots_002
Indicator

Live Charts Fib Pivots_002

This indicator synthesizes standard pivots, Fibonacci-based ranges, and Camarilla levels to map complex support and resistance boundaries from historical price action.

LK_FDI_V2
Indicator

LK_FDI_V2

iMA

This indicator calculates the fractal dimension of price action to differentiate between trending market regimes and high-volatility noise using logarithmic complexity scaling.

Load History Data
Indicator

Load History Data

This script scans historical price action to identify and quantify missing bar sequences, categorizing them by duration, price jumps (gaps), and structural integrity metrics.

Loco
Indicator

Loco

The indicator identifies structural shifts by propagating a cumulative price state that adjusts dynamically based on directional momentum and incremental percentage deviations.

Logical
Indicator

Logical

This library provides high-level wrappers for ternary operations and an execution pause mechanism to streamline multi-type conditional logic within MQL4.

LotSize
Indicator

LotSize

This script dynamically calibrates trade volume by mapping account balance thresholds to incremental lot sizes for precision risk management.
LowPassFilter_v1
Indicator

LowPassFilter_v1

iMAiMAOnArray

The indicator applies multi-order digital filtering and standard deviation variance checks to isolate underlying price momentum from market noise.
Indicator

LR trend histo

iMA
LRMA_BB
Indicator

LRMA_BB

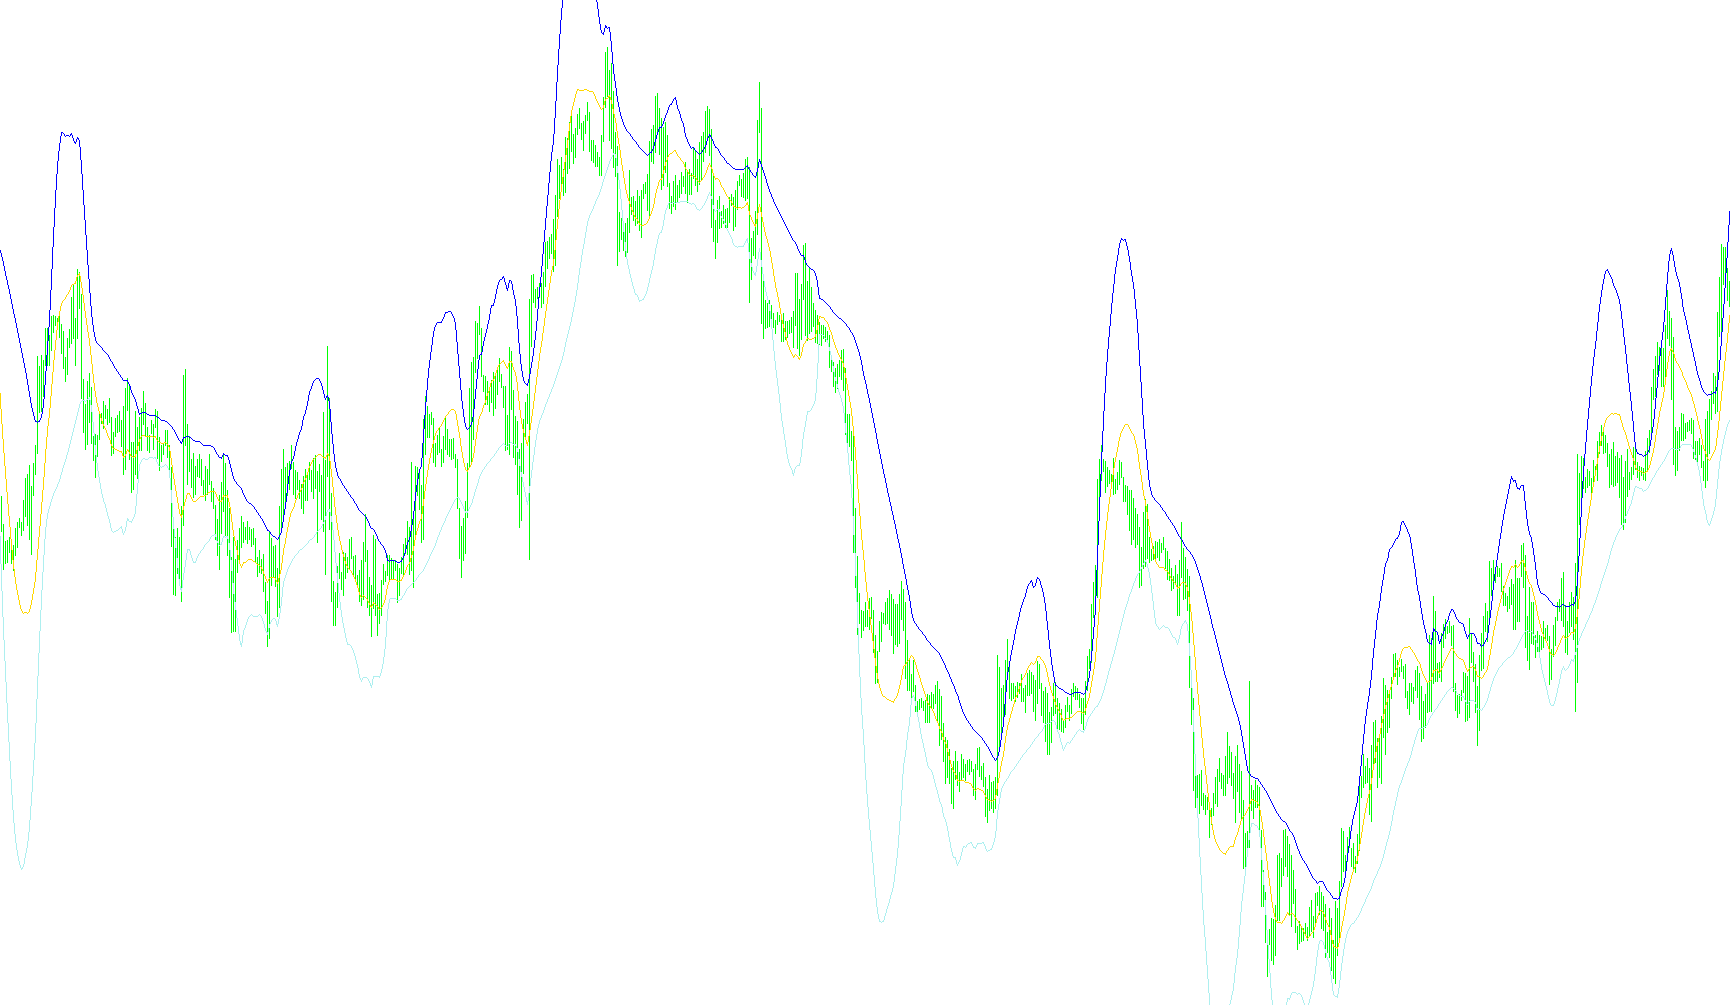
This indicator calculates a linear regression line to project price trends and overlays dynamic volatility bands derived from standard deviation.

Indicator

LRS_line_mtf

iMA