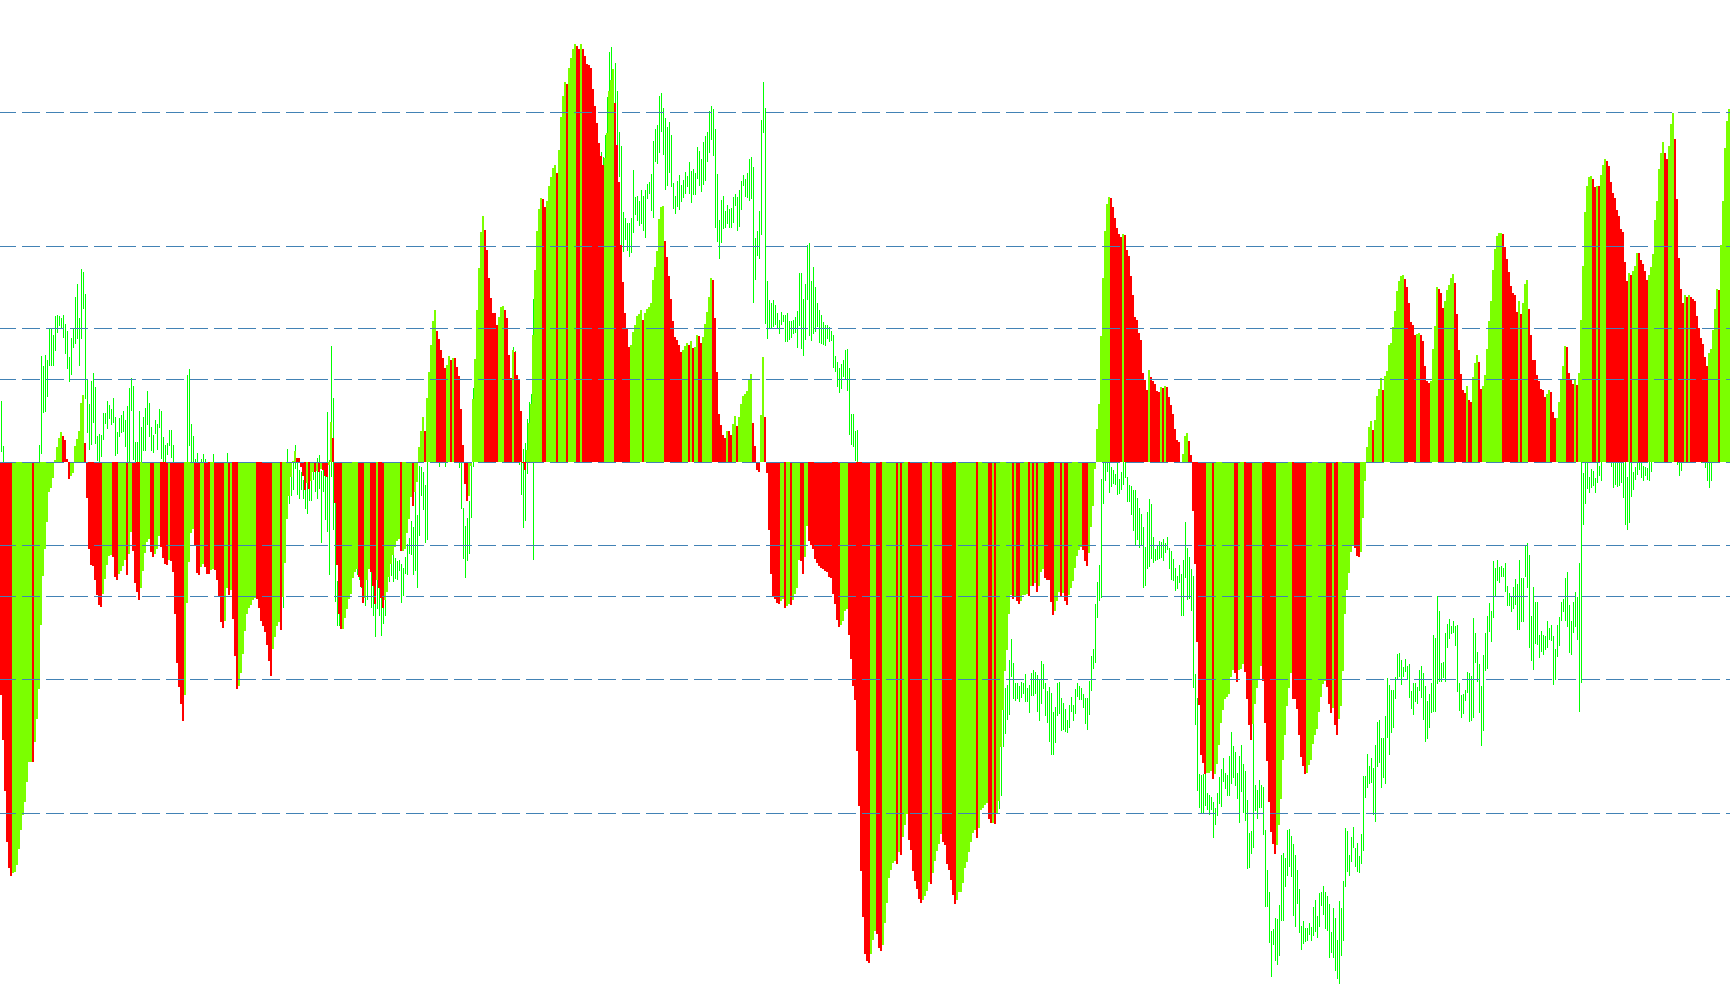
Keltner Channels1
Indicator

Keltner Channels1

iATRiMA

This indicator projects a multi-layered channel by calculating a moving average baseline and expanding it based on either ATR values or the mean price range to visualize market expansion.

Keltner Channels_v1
Indicator

Keltner Channels_v1

iMA

This indicator plots three lines based on a simple moving average of typical prices, bounded by an added deviation derived from the mean high-low range.

Keltner Channels_v2
Indicator

Keltner Channels_v2

iMA

This indicator projects a three-line boundary system by offsetting a Simple Moving Average with the arithmetic mean of historical price ranges to map market variance.

Keltner Channels_v3
Indicator

Keltner Channels_v3

iMA

This indicator plots a dynamic trading range by calculating the deviation of typical price averages from their historical high-low spreads.

Keltner_ATR_Band mt4
Indicator

Keltner_ATR_Band mt4

iATRiMA

This indicator calculates dynamic price boundaries by projecting a multiple of the Average True Range onto a Simple Moving Average to identify extreme volatility deviations.

Keltner_ATR_Band mt4_v1
Indicator

Keltner_ATR_Band mt4_v1

iATRiMA

The indicator plots upper and lower bounds by applying a configurable multiplier of the Average True Range to a Simple Moving Average baseline.

Keltner_ATR_Band
Indicator

Keltner_ATR_Band

iATRiMA

This indicator maps price boundaries by calculating the sum of a Simple Moving Average and the product of a multiplier against the Average True Range.

Keltner_ATR_Bands
Indicator

Keltner_ATR_Bands

iATRiMA

This indicator plots dynamic upper and lower boundaries by offsetting a Simple Moving Average with a multiplier of the Average True Range to identify extreme price excursions.

Keltner_ATR_Band_v1
Indicator

Keltner_ATR_Band_v1

iATRiMA

This indicator projects dynamic upper and lower boundaries by offsetting a Simple Moving Average with a multiplier of the Average True Range to identify extreme price deviations.

Keltner_Chanel
Indicator

Keltner_Chanel

iATRiMA

This indicator generates a dynamic trading channel by projecting an Exponential Moving Average boundary outward based on a multiple of the Average True Range.

Keltner_Channel
Indicator

Keltner_Channel

iMA

This indicator constructs a three-line corridor by calculating a simple moving average of typical prices and expanding it using the mean true range of historical price action.

Keltner_Channels
Indicator

Keltner_Channels

iMA

This indicator identifies price boundaries by projecting a dynamic range derived from the average high-low spread around a simple moving average.

Keltner_ChannelsAlert
Indicator

Keltner_ChannelsAlert

iMA

This indicator identifies momentum shifts by monitoring price excursions beyond a mean-adjusted volatility band derived from the range of high and low extremes.

Keltner_Channels_v1
Indicator

Keltner_Channels_v1

iMA

This indicator projects dynamic price boundaries by calculating a standard moving average and overlaying it with the historical range of high-low price fluctuations.

KG FI V.1.0
Indicator

KG FI V.1.0

iMAiMAOnArray

This indicator quantifies price velocity by multiplying volume by the percentage change of a moving average, then applying a low-weight smoothing filter to identify trend transitions.

KG FLAT DETECTOR
Indicator

KG FLAT DETECTOR

iBandsiMA

This indicator analyzes price velocity by comparing a short-term moving average against weighted Bollinger Band extremities to identify non-trending, stagnant market phases.

KG MA 1.3b
Indicator

KG MA 1.3b

iMA

This indicator visualizes simultaneous moving average trends across multiple timeframes—ranging from 15 minutes to monthly intervals—to provide a comprehensive overview of market momentum and directional bias.

KG Momentum V.1.1a Current
Indicator

KG Momentum V.1.1a Current

iMAiMAOnArray

This indicator calculates the percentage rate of change of a long-term linear weighted moving average and generates signals based on the crossover of two smoothed momentum lines.

KG RS GROUP V1.2a
Indicator

KG RS GROUP V1.2a

iRSI

This indicator synthesizes weighted Relative Strength Index values across major global currencies to visualize synchronized momentum shifts and currency strength dynamics in a single consolidated display.

KGSP
Indicator

KGSP

This indicator employs a high-order digital high-pass filter to extract price trends and visualize the underlying price trajectory as a smooth curve.

KhaosAssault
Indicator

KhaosAssault

iMA

This indicator captures directional momentum by calculating the delta between dual moving averages and visualizing trend shifts through color-coded histogram dynamics.

KhaosAssault2
Indicator

KhaosAssault2

iMA

This indicator visualizes the divergence between a fast and a slow moving average using a histogram, highlighting periods where the faster MA is above (green) or below (red) the slower MA, and adjusts level lines based on whether the currency pair involves JPY.

KhaosAssault2_v1
Indicator

KhaosAssault2_v1

iMA

This indicator displays a histogram visualizing the divergence between a fast and slow moving average, highlighting periods of increasing or decreasing separation between the two.

KI-Alert
Indicator

KI-Alert

iMAiMAOnArray

This indicator calculates the dynamic spread between short and medium-term exponential moving averages, applying a third smoothing layer to identify directional trend crossovers.

KI
Indicator

KI

iMAiMAOnArray

This indicator identifies momentum shifts by calculating the moving average of the spread between two exponential averages and triggering signals upon zero-line crossovers.

Kijun-sen+
Indicator

Kijun-sen+

Calculates a smoothed trend baseline by determining the median price point between the highest highs and lowest lows over a specific historical period.

Kijun-sen+_v1
Indicator

Kijun-sen+_v1

Calculates the median price point by identifying the midpoint of the highest highs and lowest lows over a specific lookback period.

Kijun-sen+_v2
Indicator

Kijun-sen+_v2

This indicator calculates the midpoint of the highest high and lowest low over a specific lookback period to identify significant price equilibrium zones.

Kijun-Sen
Indicator

Kijun-Sen

This script calculates the mid-point between the highest highs and lowest lows over a rolling period to identify dynamic support and resistance levels.

Kijun-SenSoundAlert
Indicator

Kijun-SenSoundAlert

The logic calculates the median price point over a specific period to identify trend reversals and trigger alerts based on price crossing the baseline.

Kijun-Sen_v1
Indicator

Kijun-Sen_v1

This indicator calculates the midpoint of the highest highs and lowest lows over a specific lookback period to identify the fundamental baseline of price equilibrium.

KijunTenkan+
Indicator

KijunTenkan+

This indicator calculates the midpoints of price extremes over variable periods to identify shifting momentum and structural support levels.

KijunTenkan+_v1
Indicator

KijunTenkan+_v1

This indicator calculates and plots two distinct midline averages based on historical high and low extremes to identify shifting momentum and structural support levels.

KijunTenkan+_v2
Indicator

KijunTenkan+_v2

This indicator calculates the Tenkan-sen and Kijun-sen components by determining the midpoint of price extremes over specific rolling periods to identify trend direction and potential reversal zones.

KillLoss
Indicator

KillLoss

This script dynamically adjusts the stop-loss level in opposition to market movement by applying a configurable acceleration coefficient to counter approaching price volatility.

kino_2ATRaboveLimit
Indicator

kino_2ATRaboveLimit

iATR

The indicator classifies market volatility by comparing two distinct Average True Range periods against a predefined numerical limit to identify synchronized high, low, or divergent volatility states.

kino_2CCI_Cross_Alert
Indicator

kino_2CCI_Cross_Alert

iCCI

This indicator triggers alerts when two distinct Commodity Channel Index oscillators simultaneously breach specific user-defined price levels.

kino_3MA_Ribbon
Indicator

kino_3MA_Ribbon

iMA

This indicator visualizes trend dynamics by plotting a multi-period moving average ribbon that contrasts high-frequency EMA signals against a long-term SMA baseline.

KiS_Avg(1)
Indicator

KiS_Avg(1)

This indicator dynamically maps the intraday highest high, lowest low, and the calculated midpoint average to visualize price volatility boundaries within each trading session.

KiS_Avg
Indicator

KiS_Avg

This indicator identifies the session high, low, and the geometric midpoint of the daily price range to visualize volatility boundaries and mean reversion levels.

KiS_Avg_v1
Indicator

KiS_Avg_v1

This indicator dynamically plots the daily high, low, and median price levels to visualize real-time price expansion and volatility relative to the session open.

KiS_Avg_v2
Indicator

KiS_Avg_v2

This indicator dynamically projects and plots the high, low, and midpoint equilibrium levels of the current trading day's price action.

KiS_max_min_Avg_Monday Fixed
Indicator

KiS_max_min_Avg_Monday Fixed

This indicator dynamically calculates and plots the daily high, low, and median price levels to visualize intraday volatility boundaries.

KI_signals1_H1+low_3-10-18_optimized
Indicator

KI_signals1_H1+low_3-10-18_optimized

iMAiMAOnArray

This indicator detects trend shifts by calculating the EMA differential between multiple periods and identifying zero-cross signals across higher timeframe data.

KI_signals1_H1+low_3-10-18_optimized_v1
Indicator

KI_signals1_H1+low_3-10-18_optimized_v1

iMAiMAOnArray

The indicator identifies trend reversals by detecting zero-crossings of a smoothed momentum histogram while filtering signals through higher-timeframe price levels.

KI_signals_v1
Indicator

KI_signals_v1

iMAiMAOnArray

Identifies directional shifts by analyzing EMA spread velocity through a smoothed histogram differential crossover.

KI_signals_v1a
Indicator

KI_signals_v1a

iMAiMAOnArray

This indicator identifies trend reversals by detecting zero-line crossovers of a smoothed difference between multiple exponential moving averages.

KI_signals_v2
Indicator

KI_signals_v2

iMAiMAOnArray

This indicator identifies directional shifts by calculating the differential between dual EMAs and detecting zero-line crossovers of their smoothed average histogram.

KI_signals_v2_v1
Indicator

KI_signals_v2_v1

iMAiMAOnArray

This indicator identifies bullish and bearish momentum shifts by detecting zero-line crossovers of a smoothed histogram derived from the differential between dual Exponential Moving Averages.

Klasternaya Mashka
Indicator

Klasternaya Mashka

iMA

This indicator synthesizes weighted relative price movements across multiple currency pairs to calculate a composite volatility and momentum coefficient.