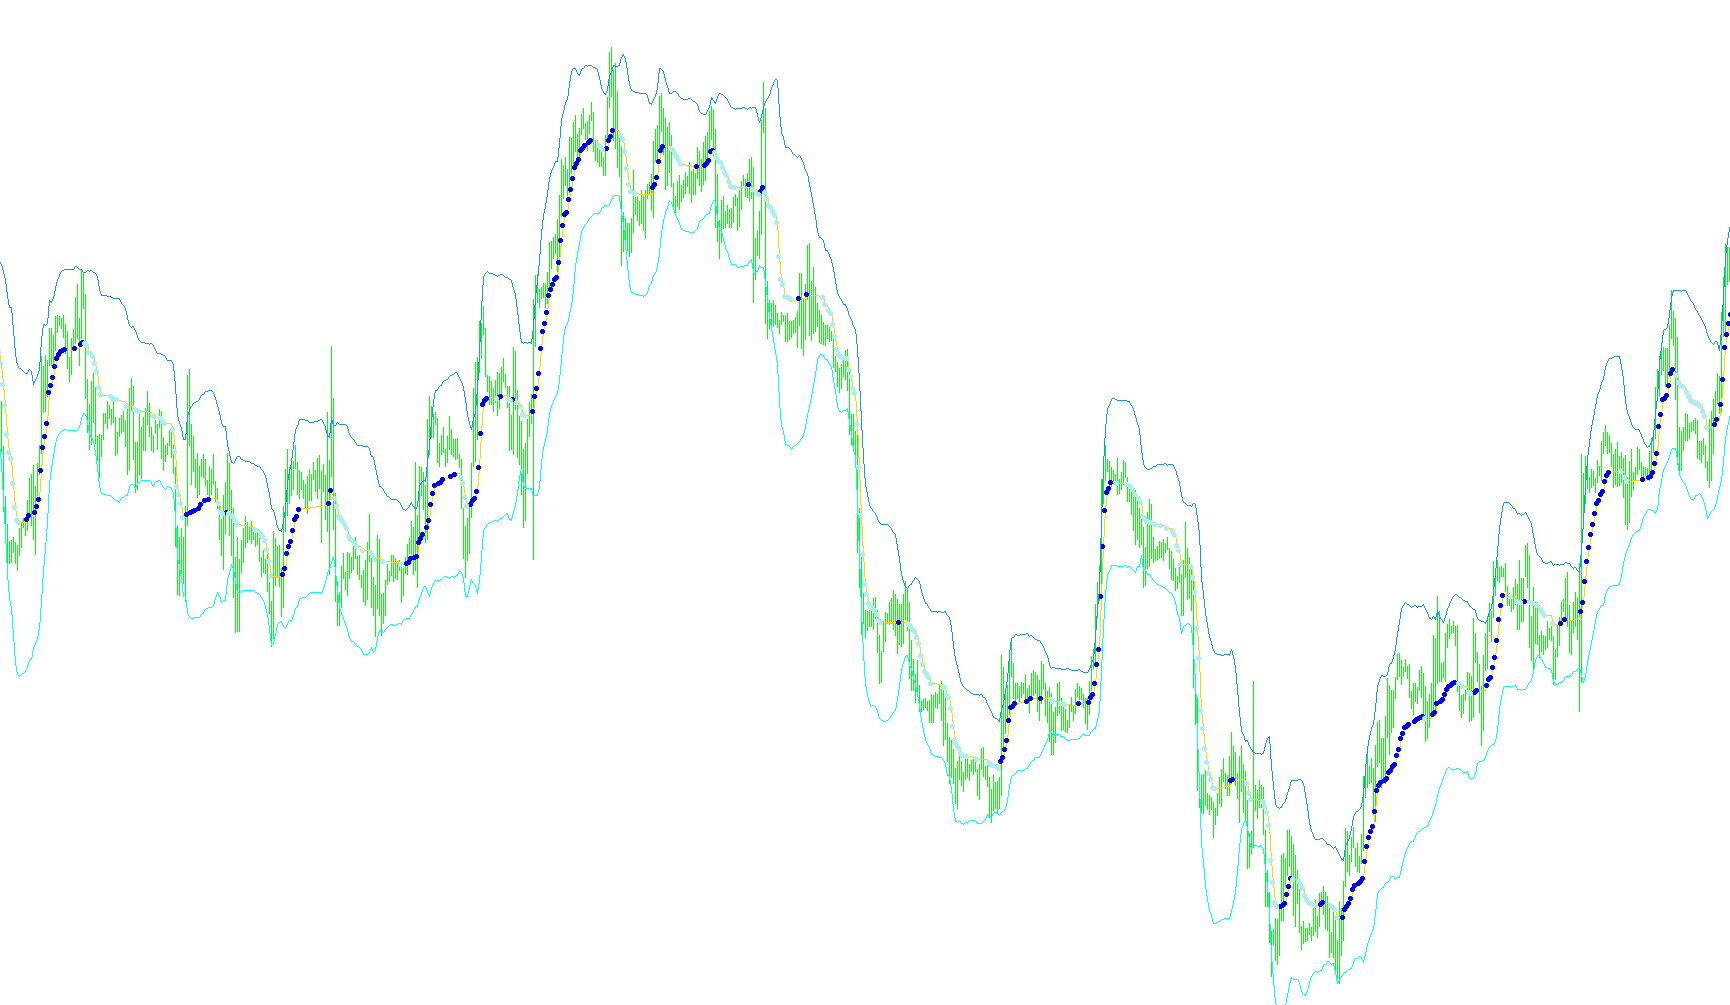
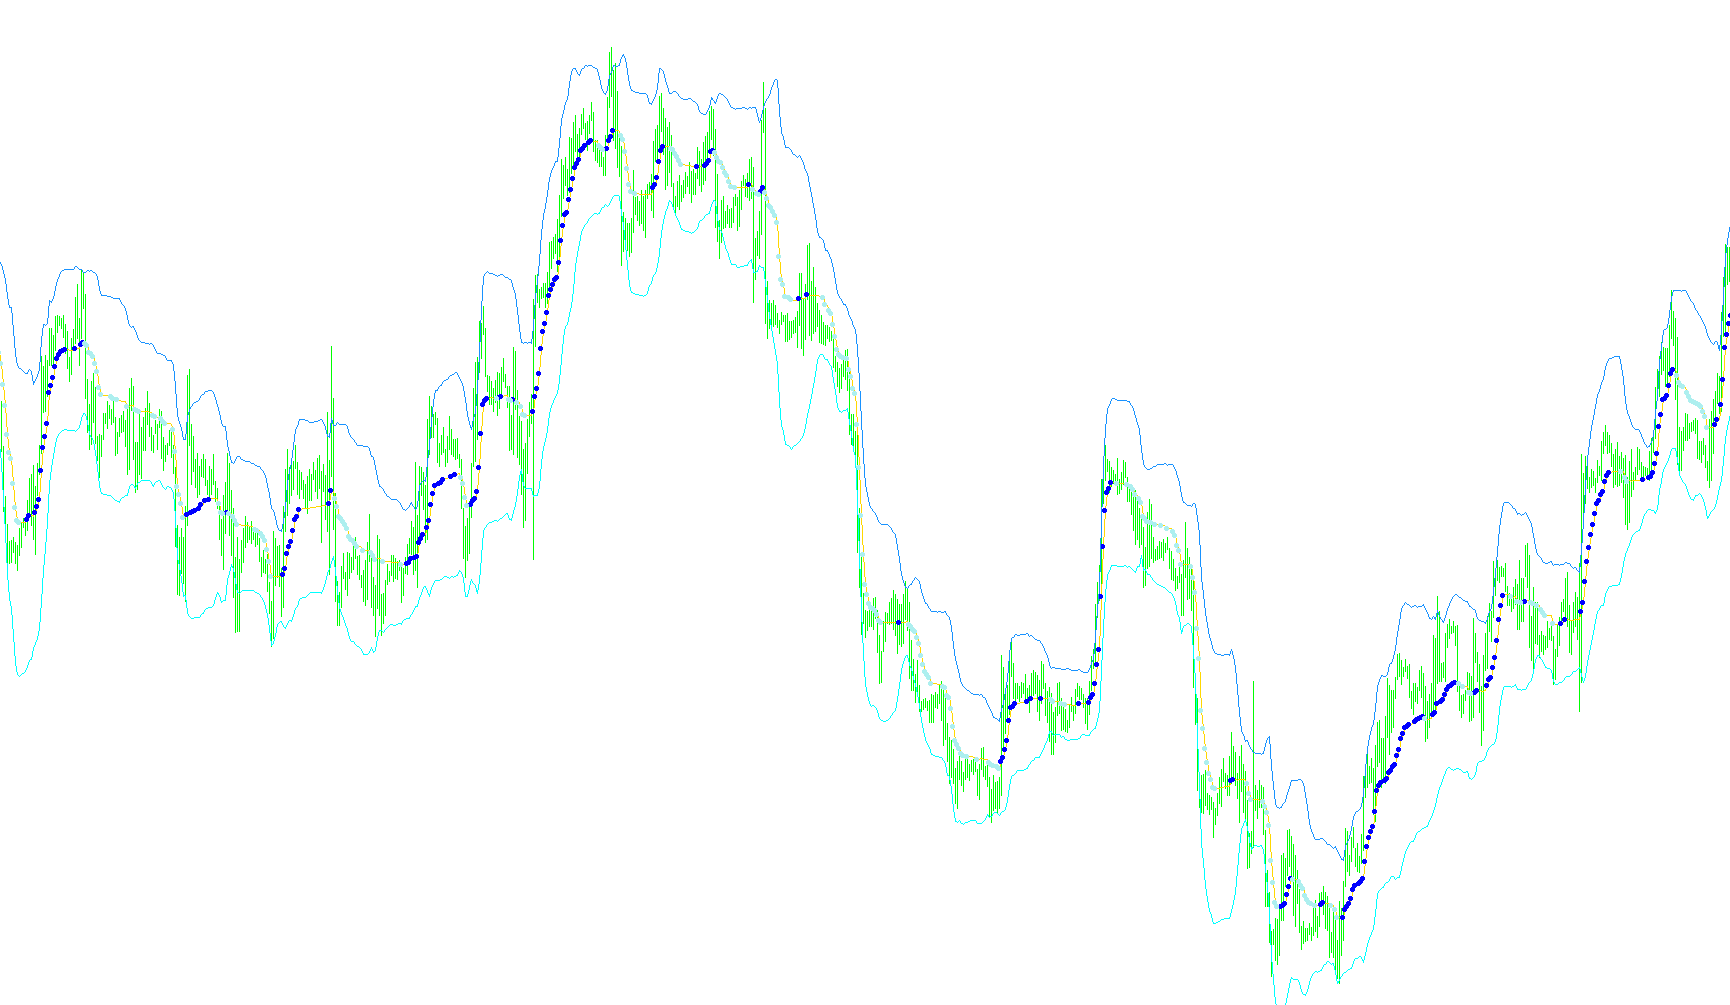
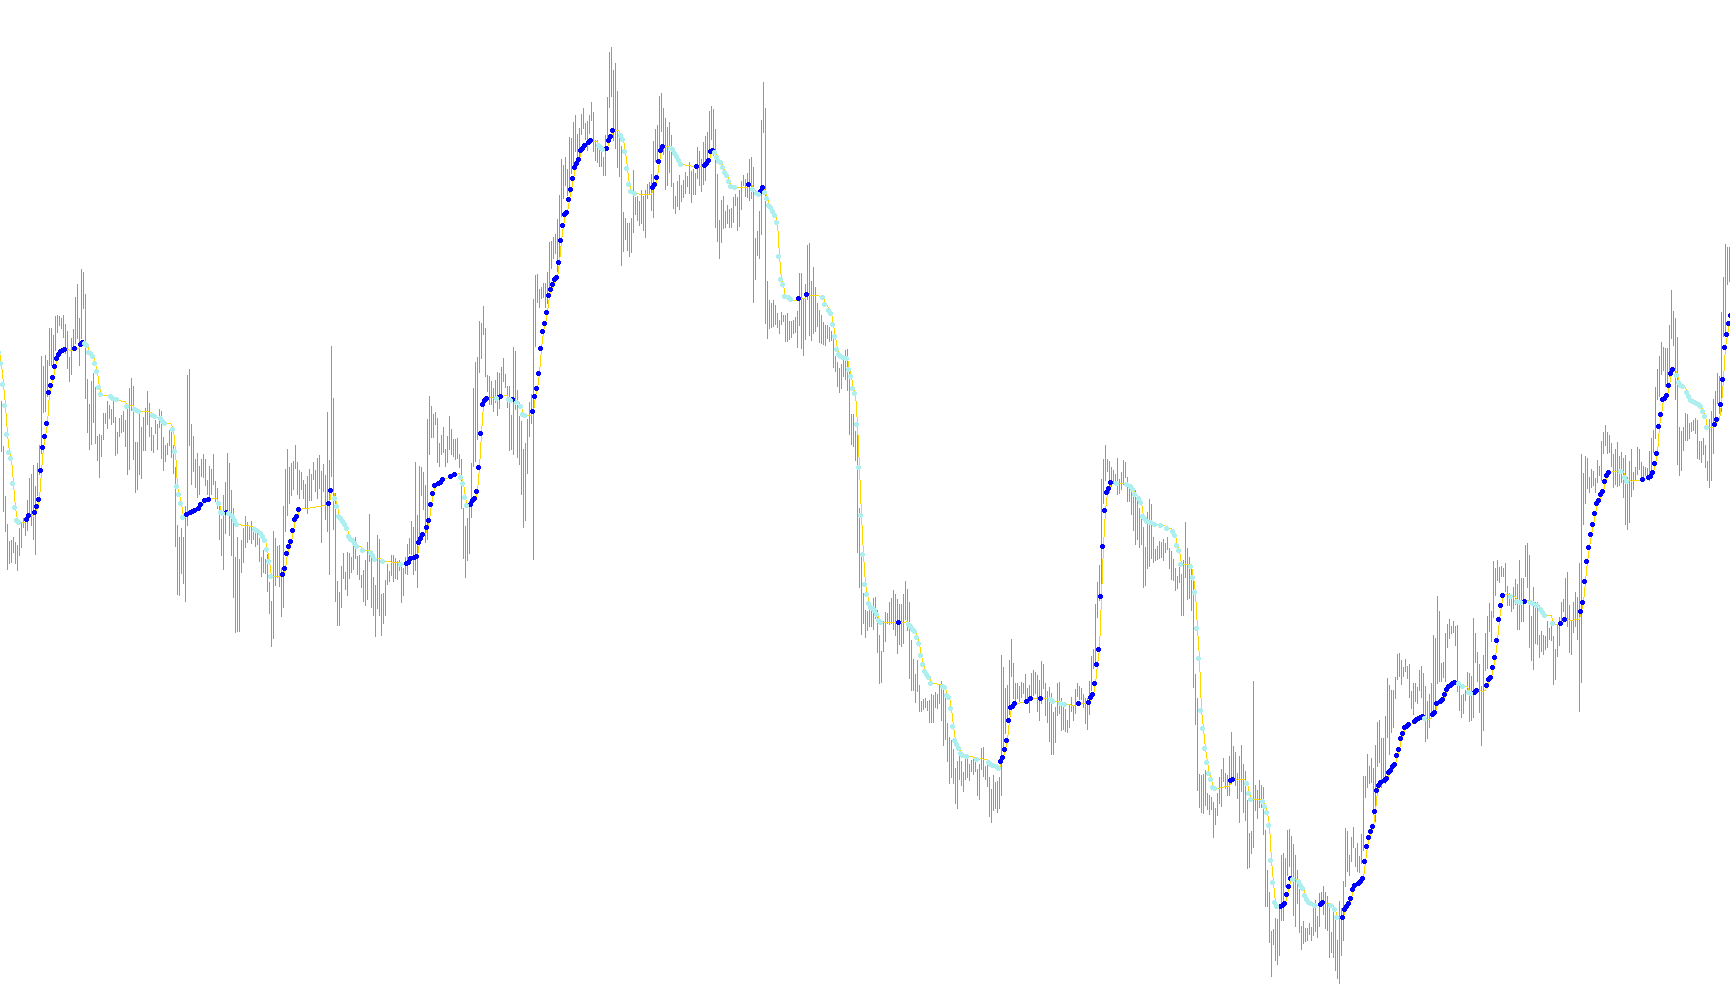
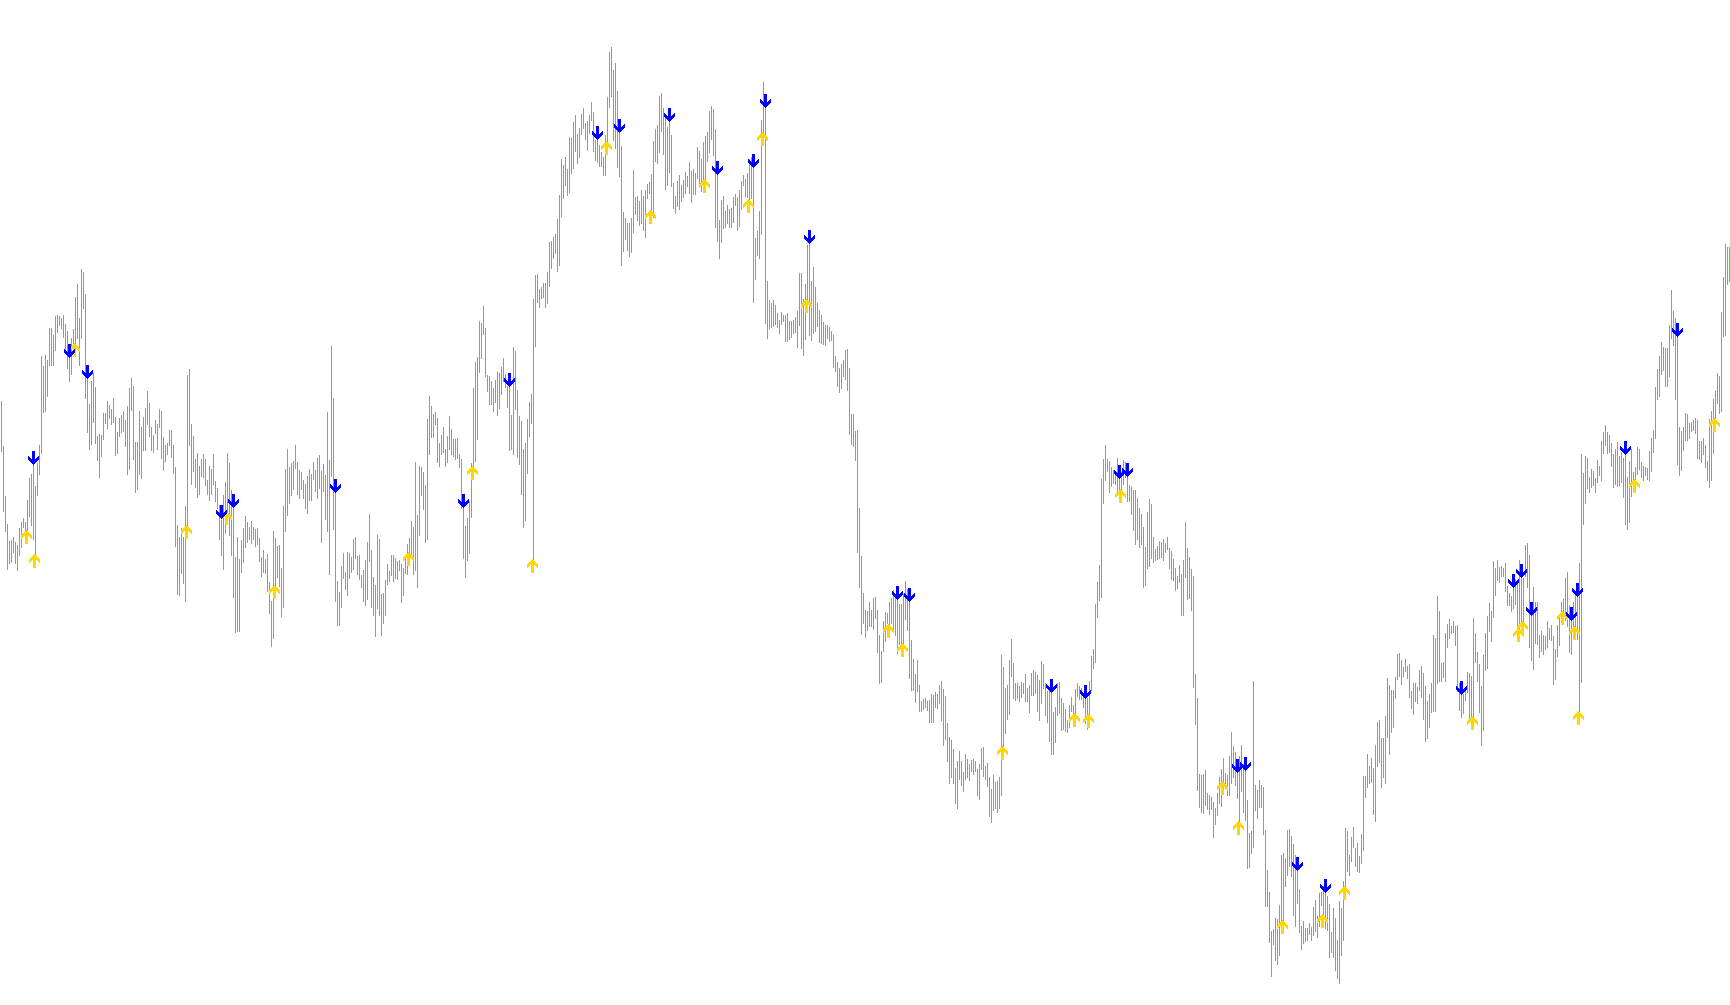
K-ang_AutoCh_HL-v1
Indicator

K-ang_AutoCh_HL-v1

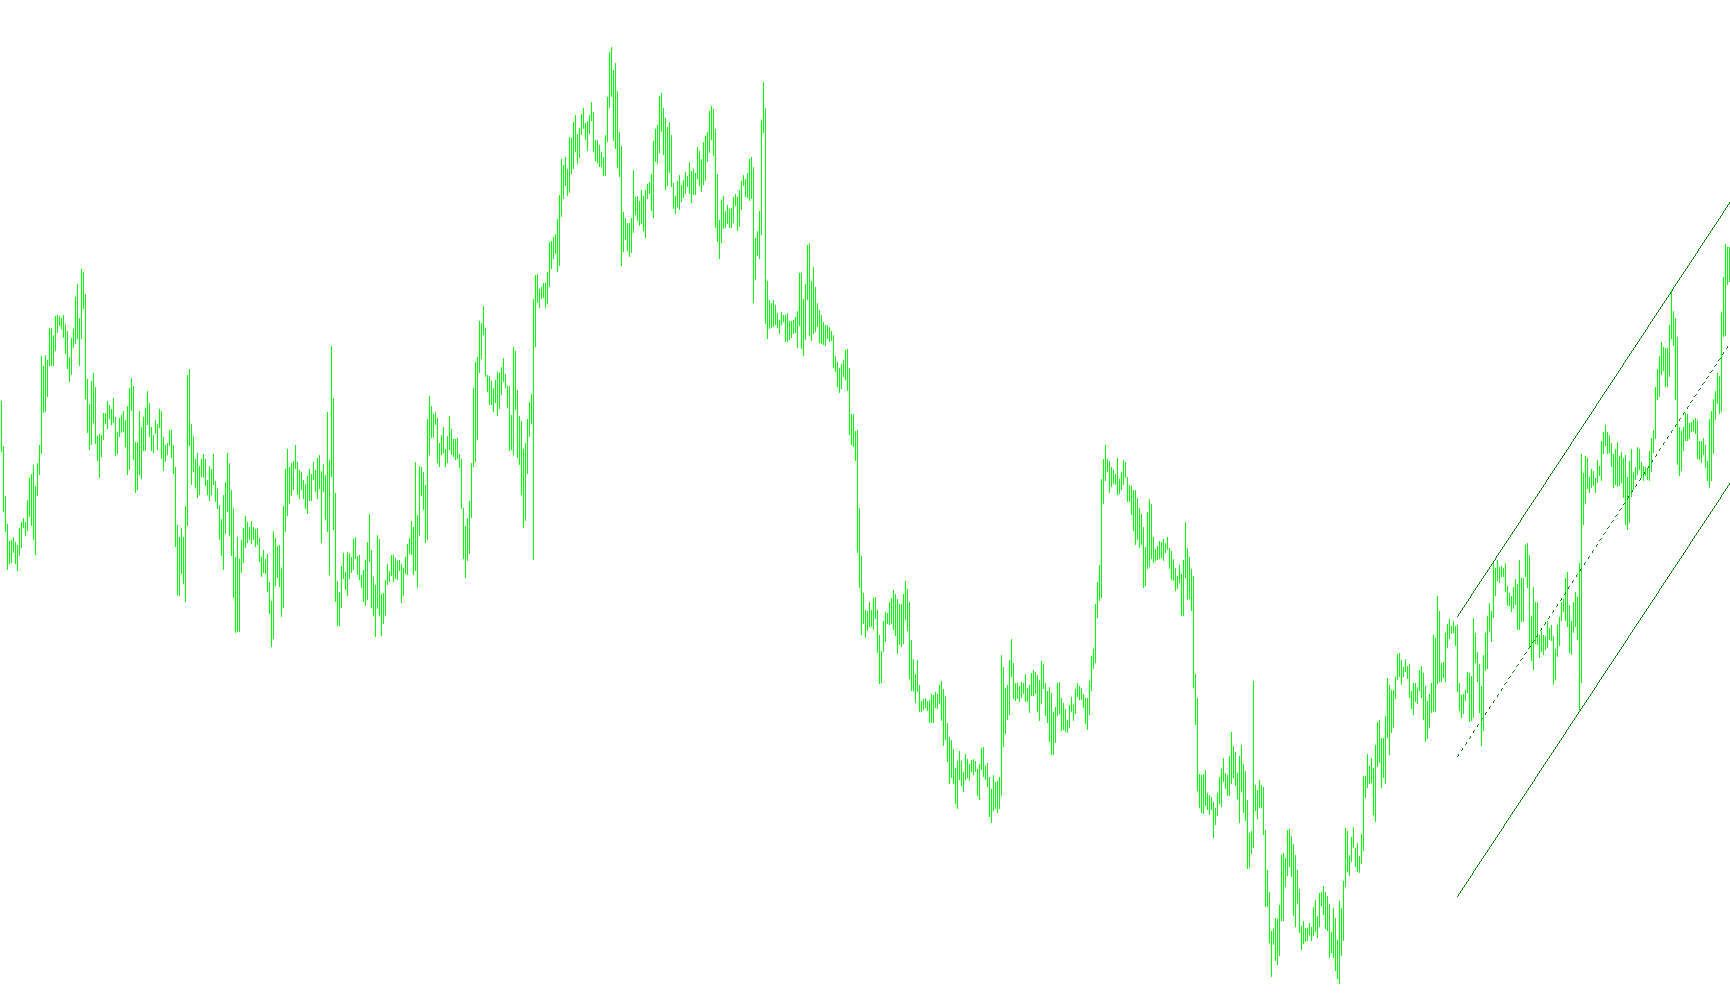
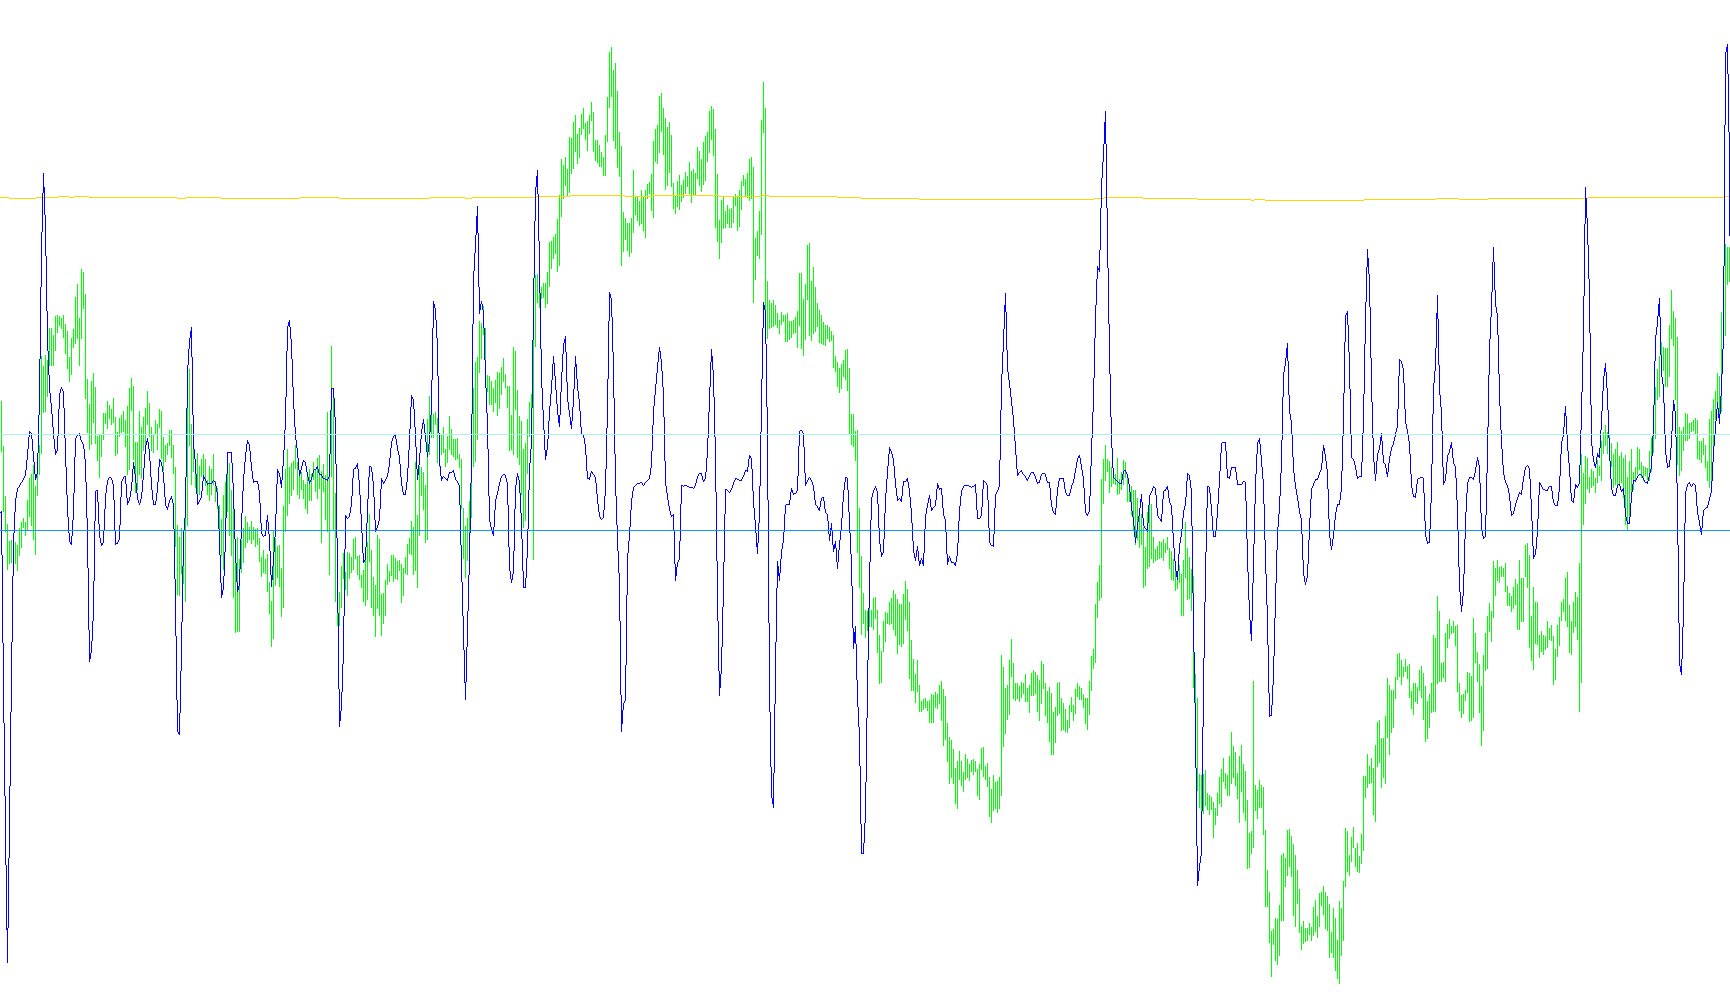
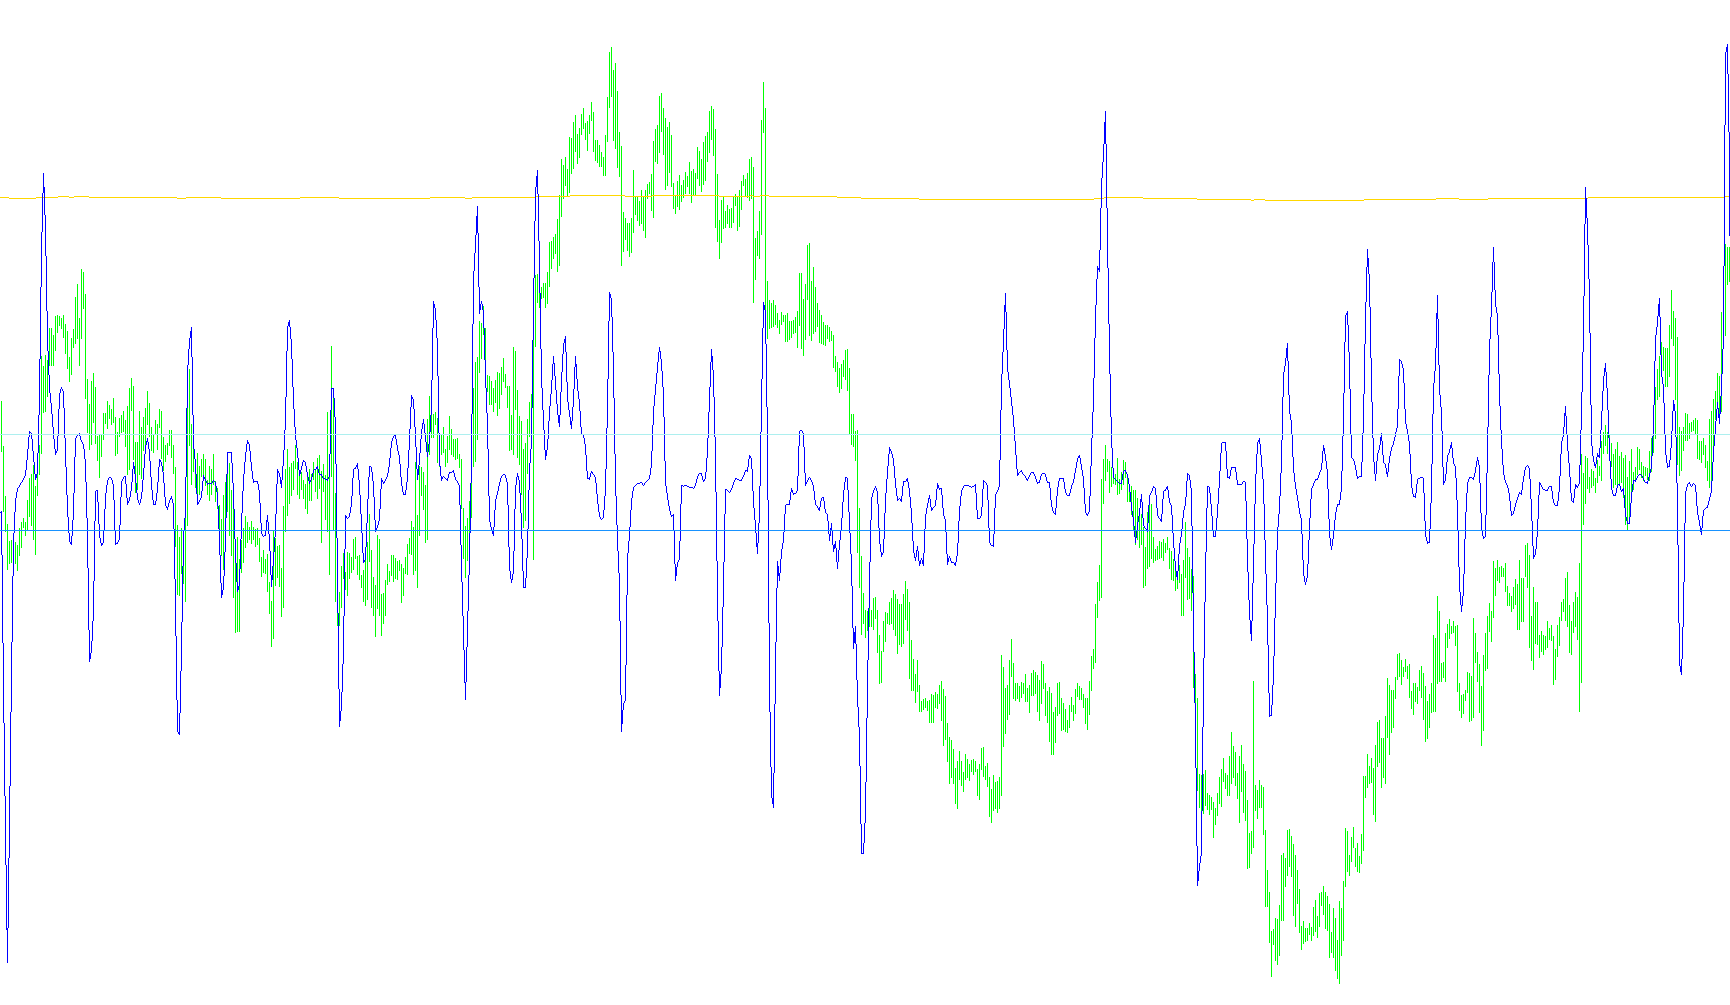
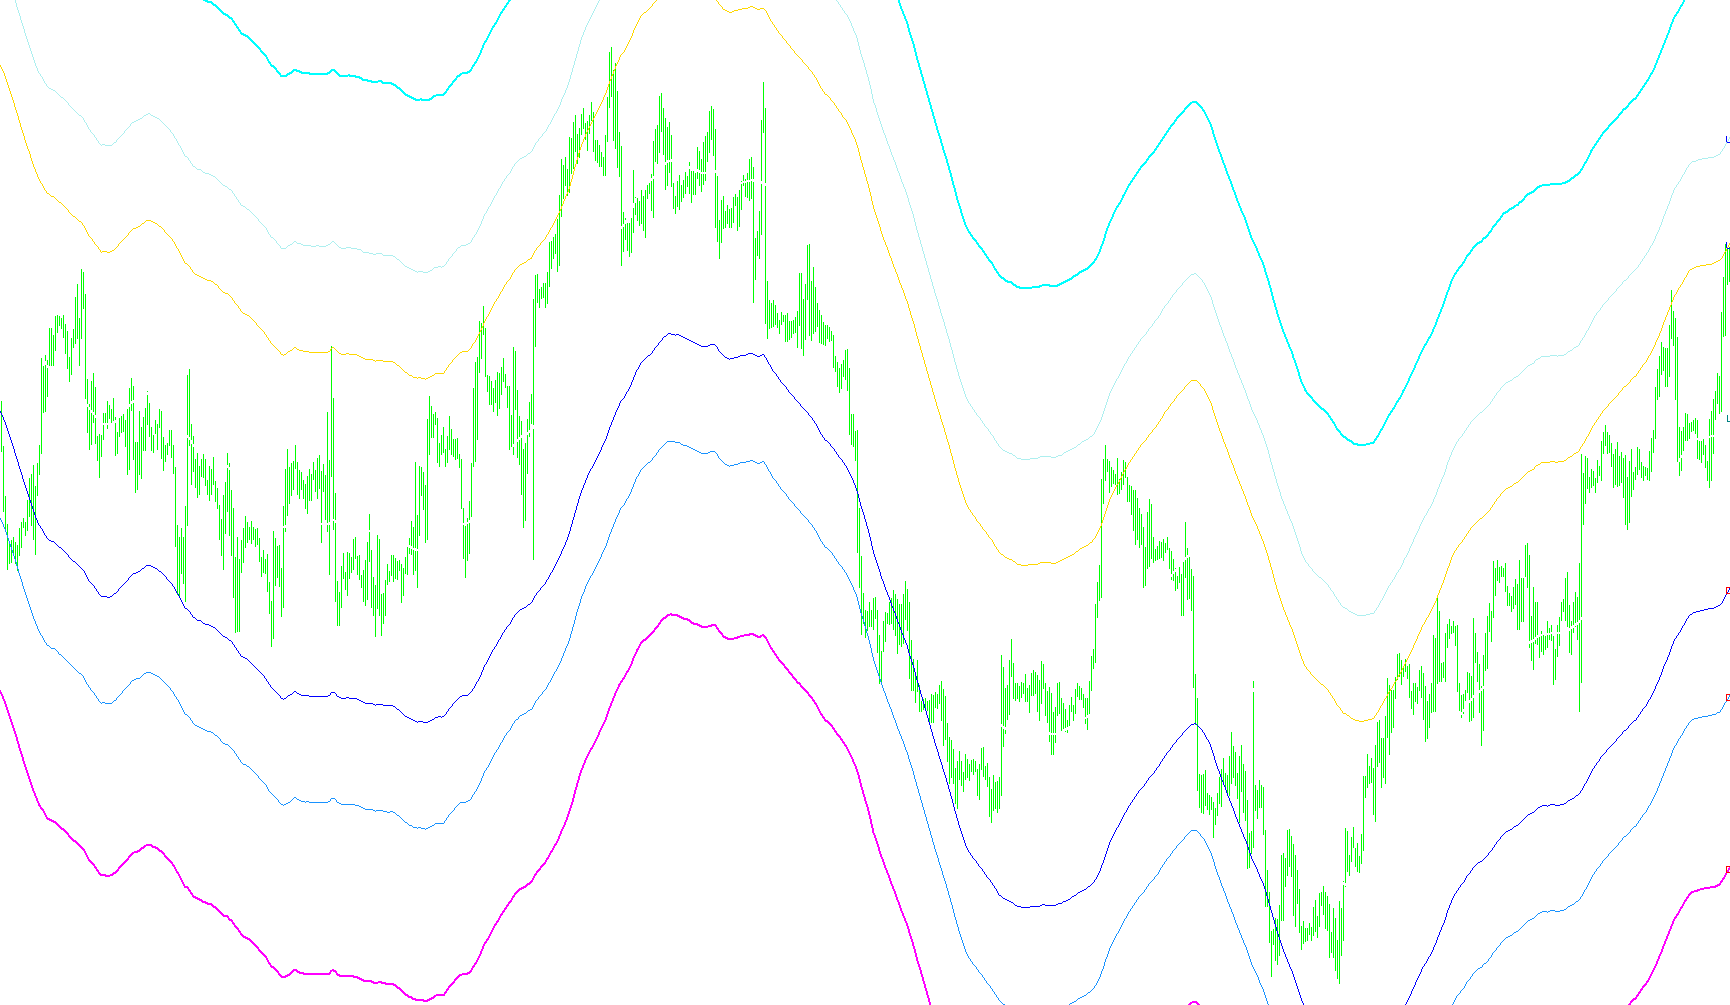
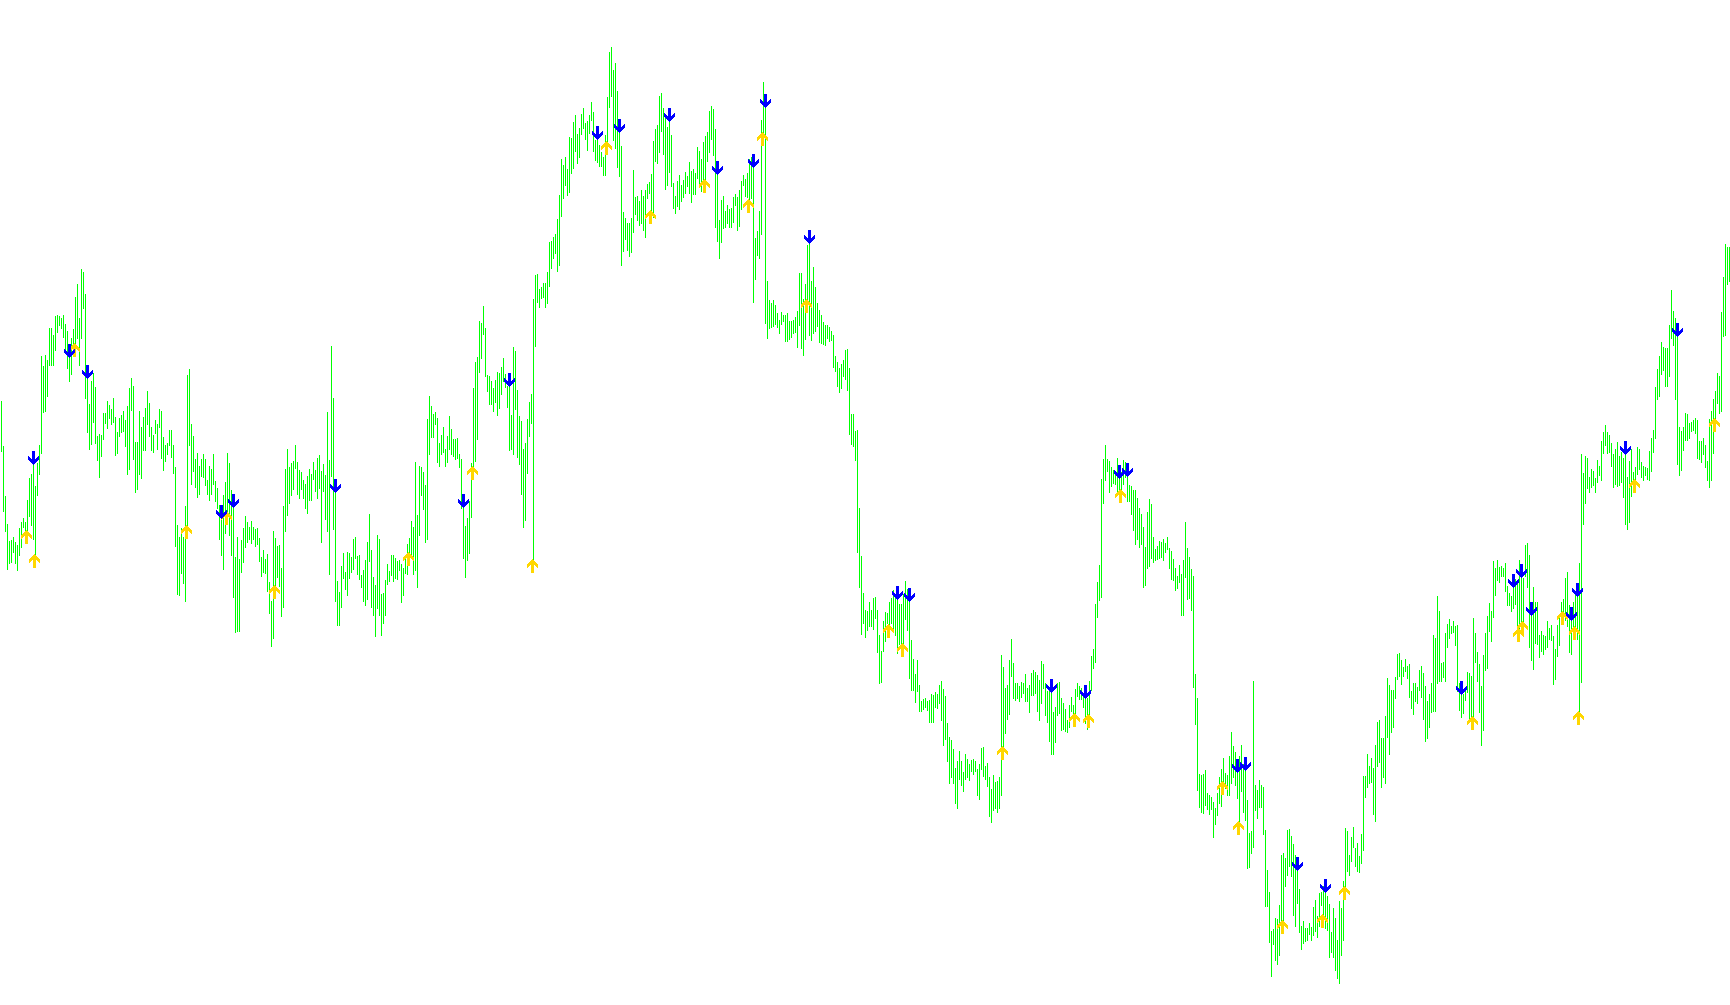
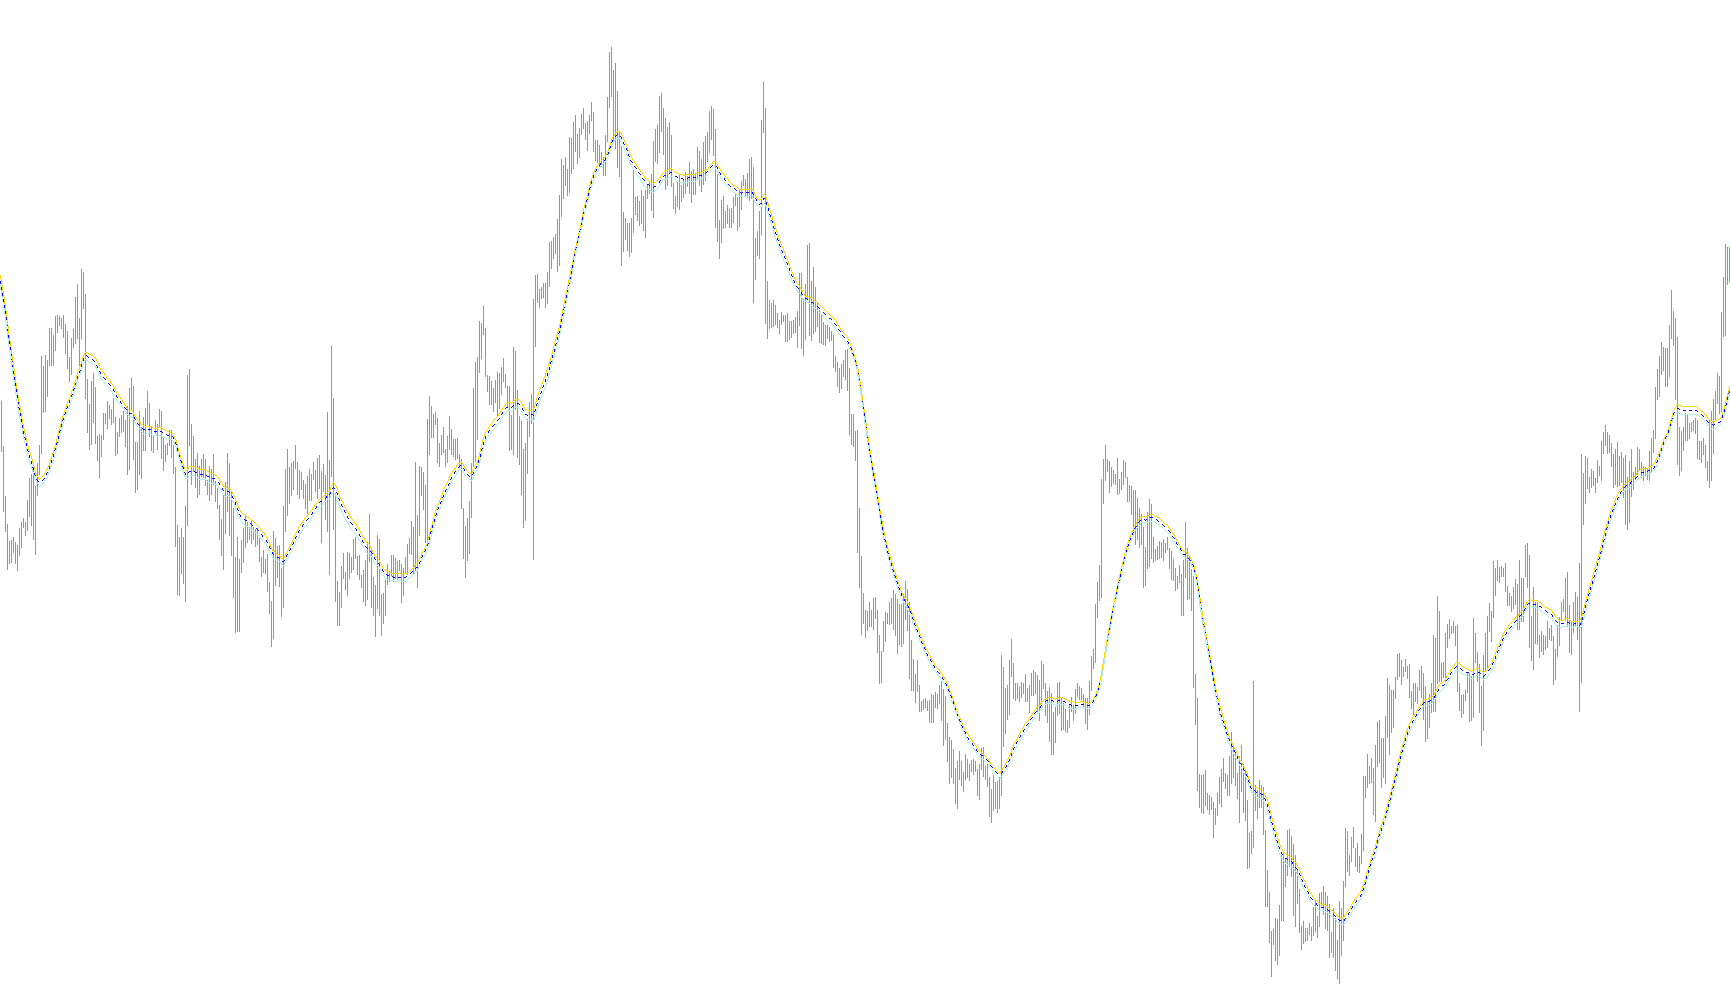
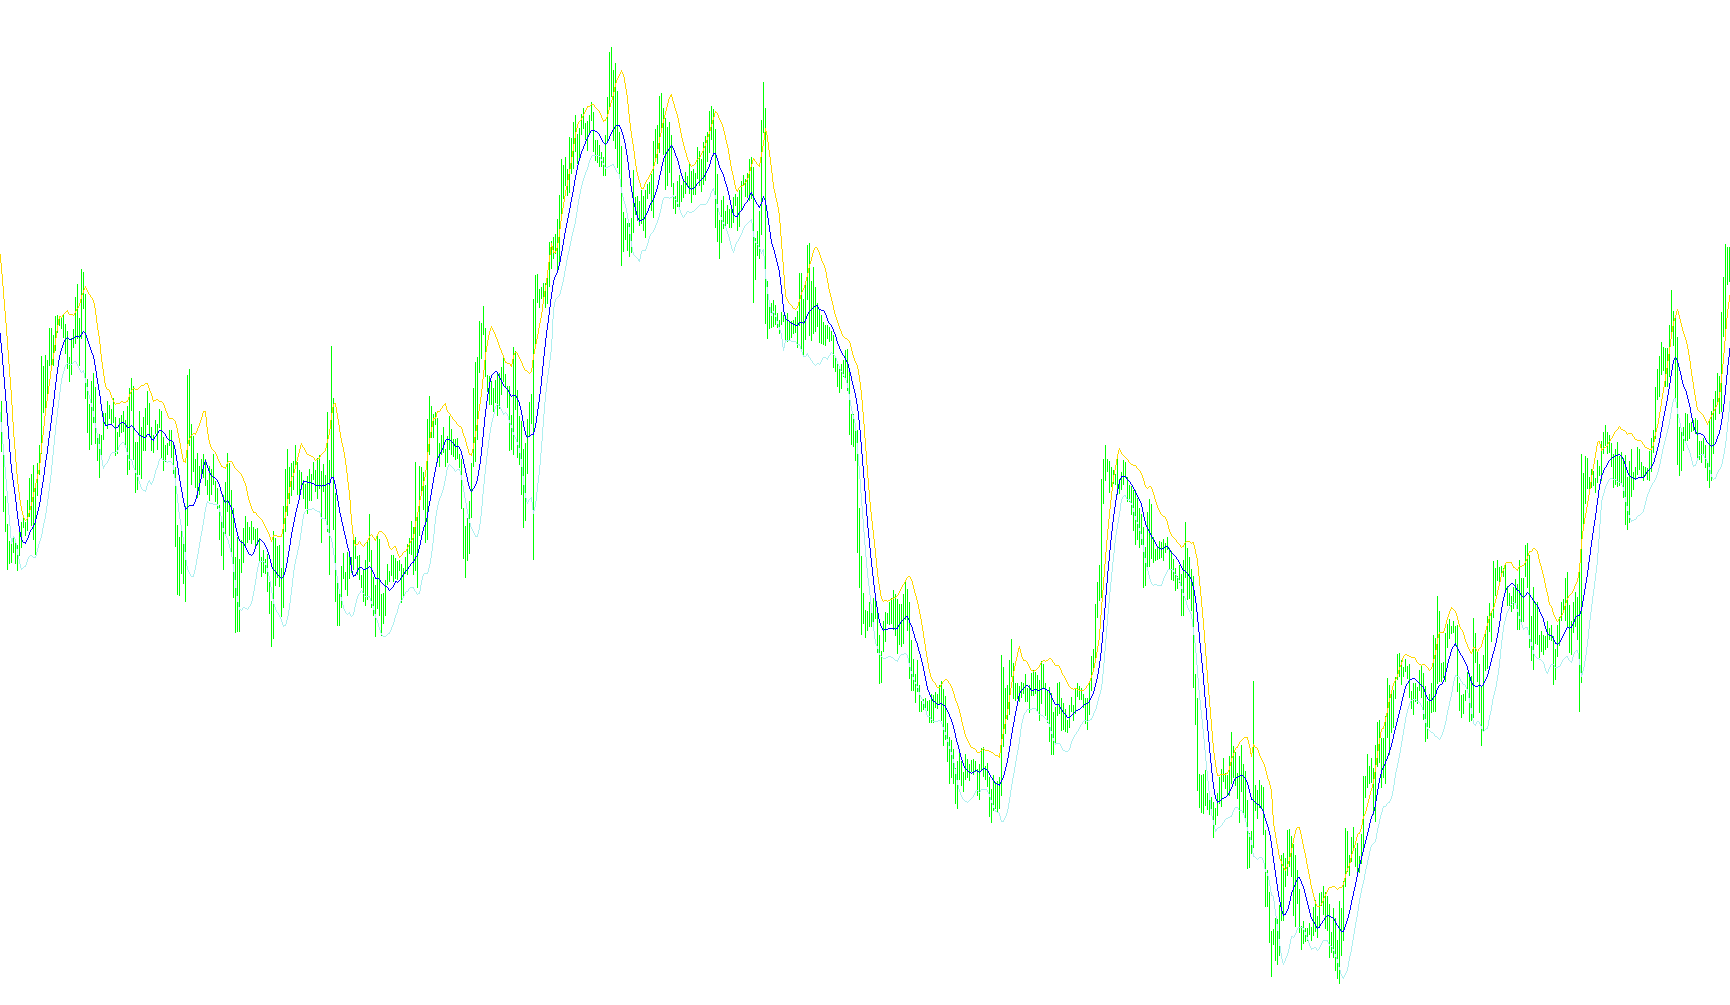
This indicator calculates a linear regression trend and identifies extreme price deviations to project multi-layered support and resistance zones.
K-ang_AutoCh_HL-v4
Indicator

K-ang_AutoCh_HL-v4

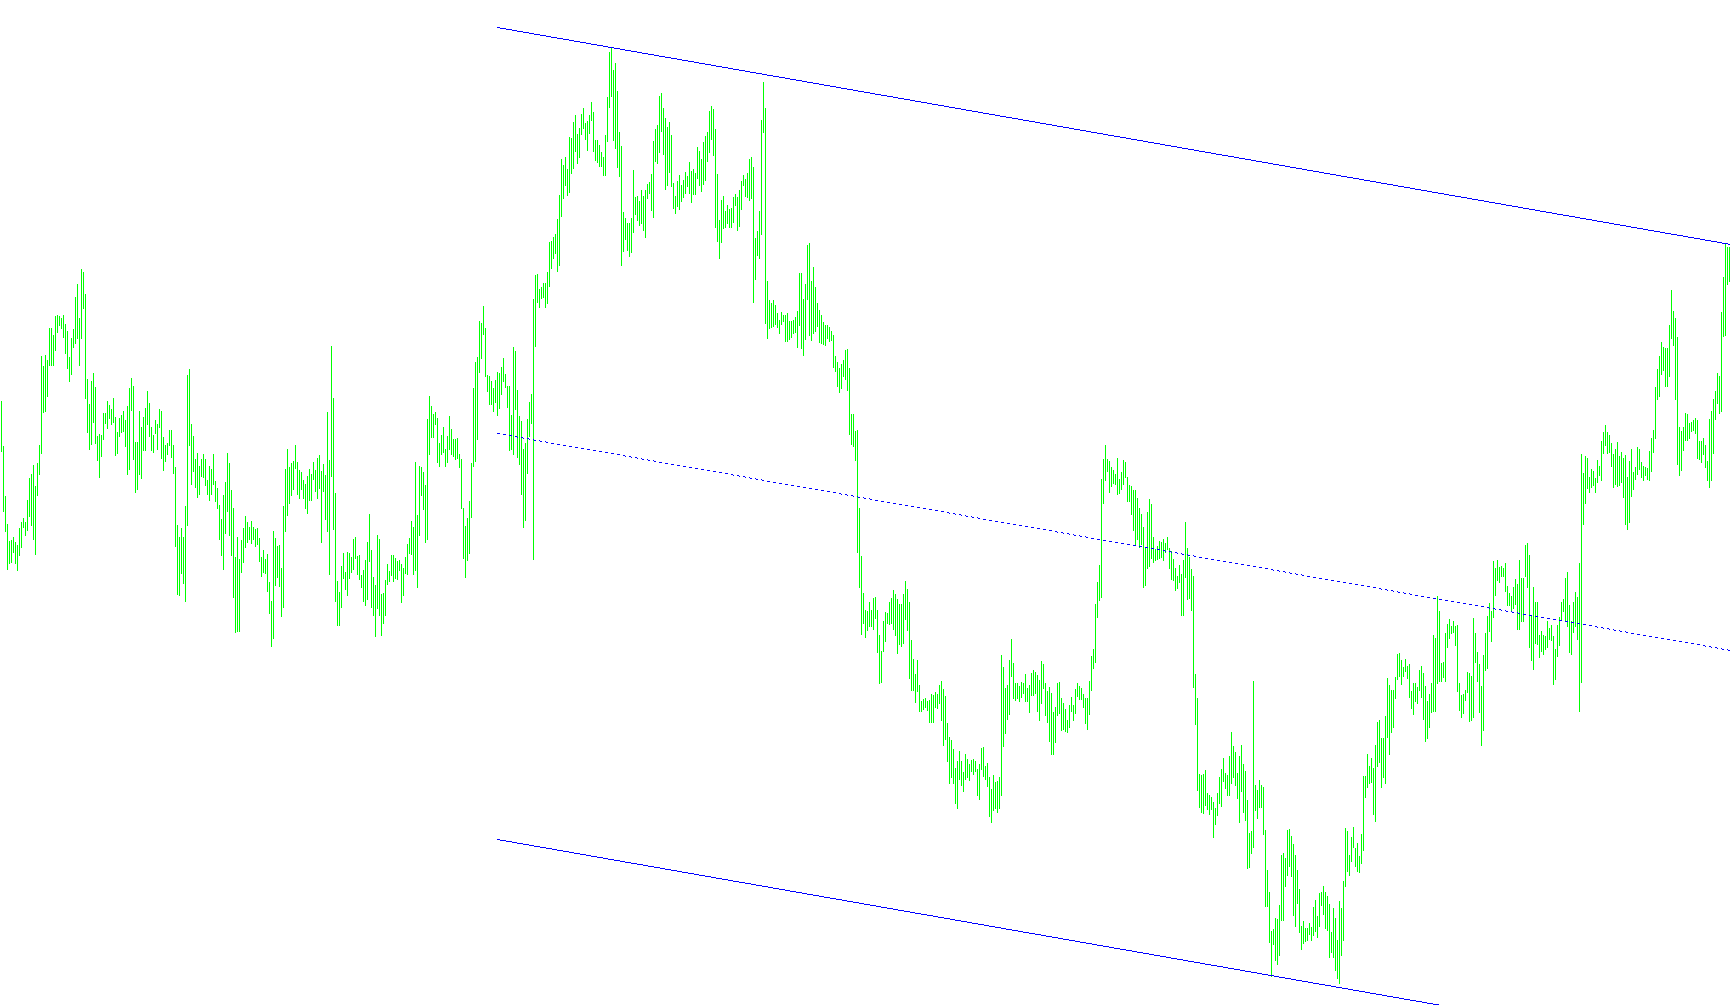
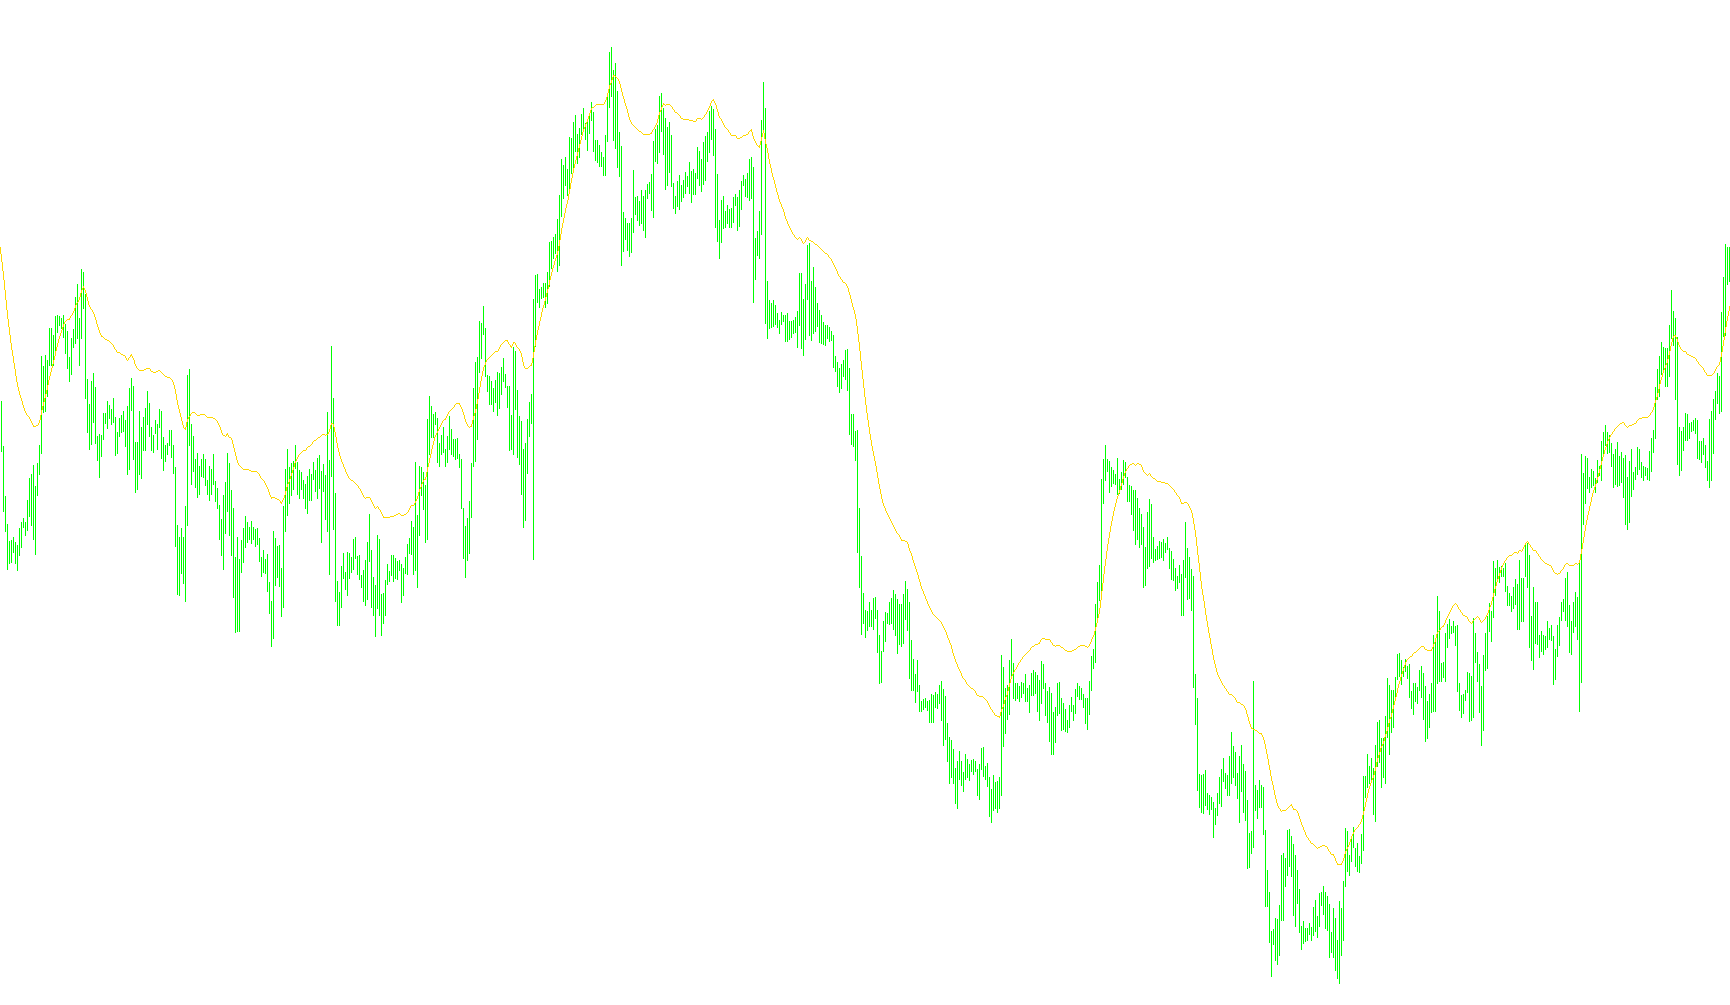
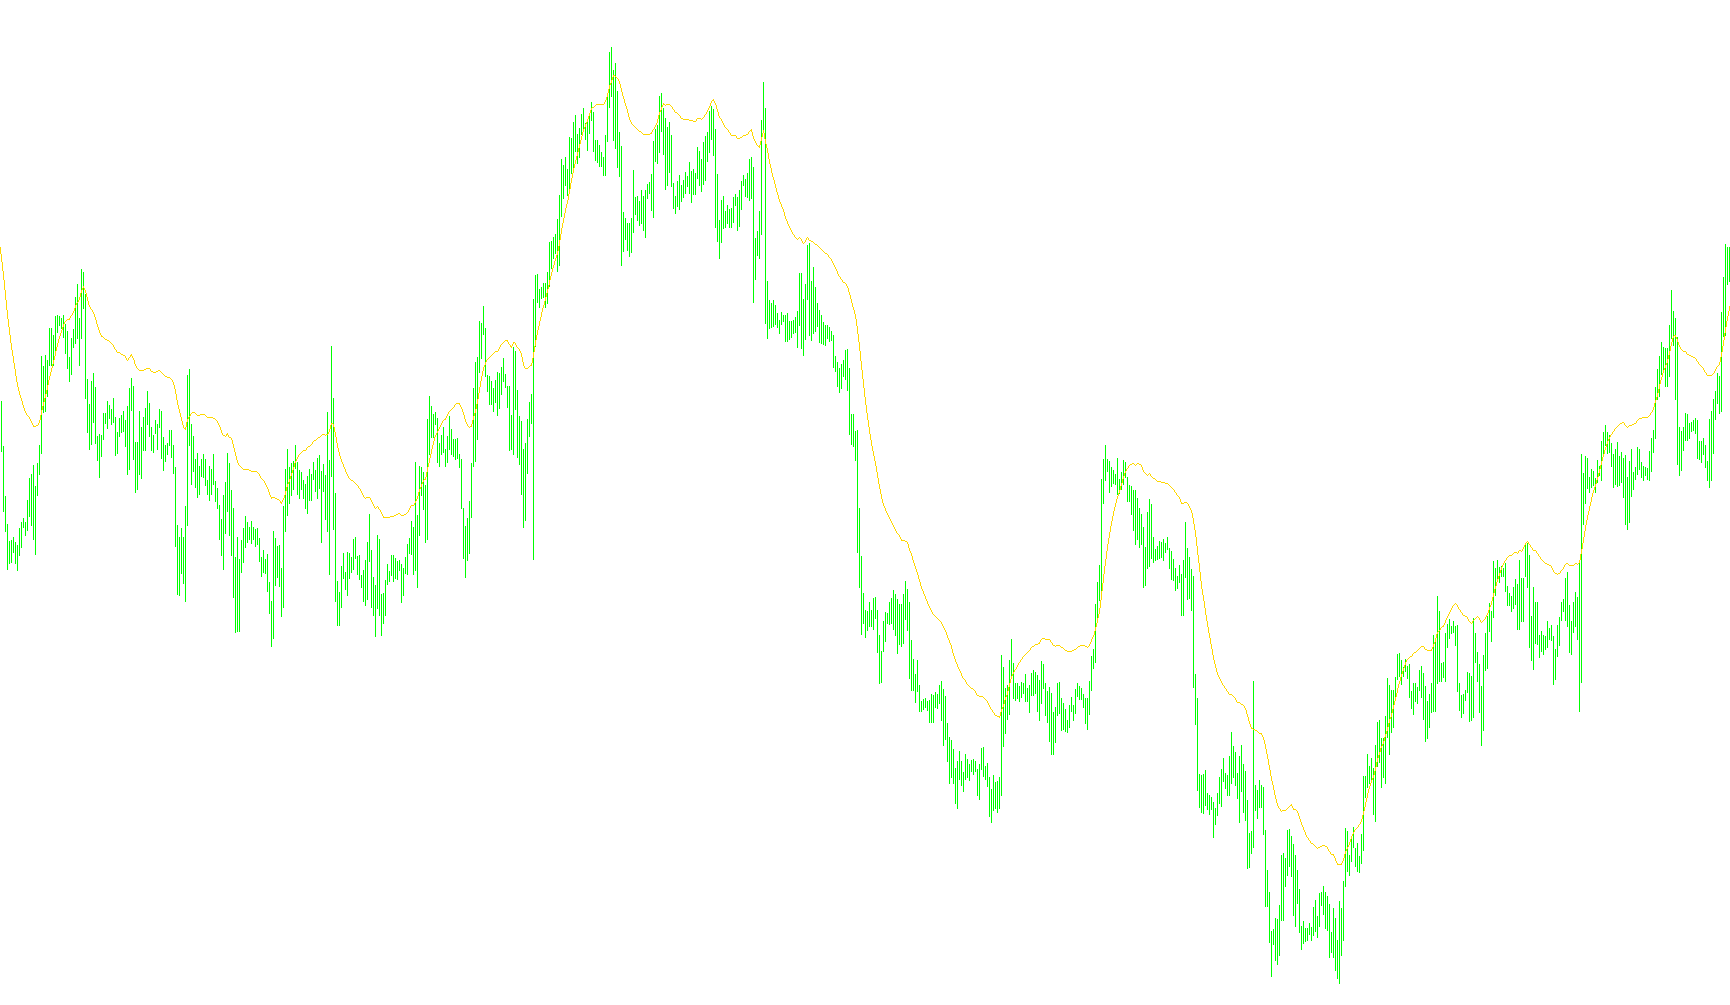
This indicator calculates a linear regression line to identify dominant trend extremes and projects three distinct geometric channels based on historical peak-to-trough variance.

K-ang_AutoCh_HL-vD
Indicator

K-ang_AutoCh_HL-vD

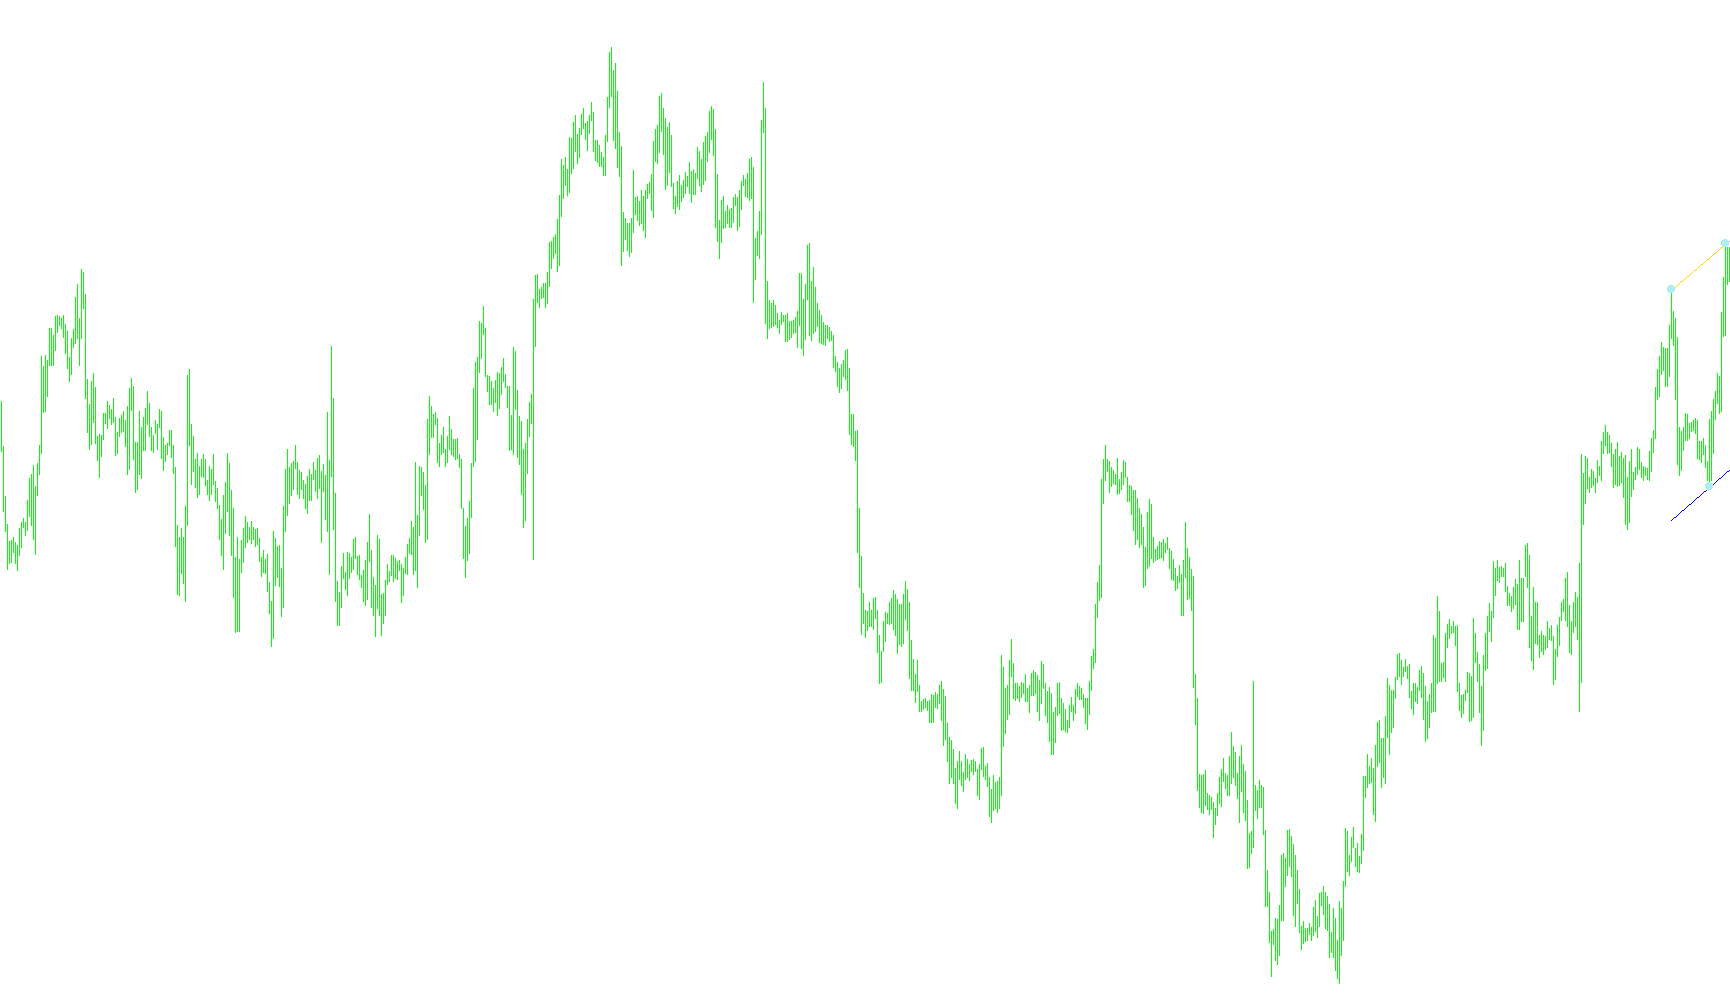
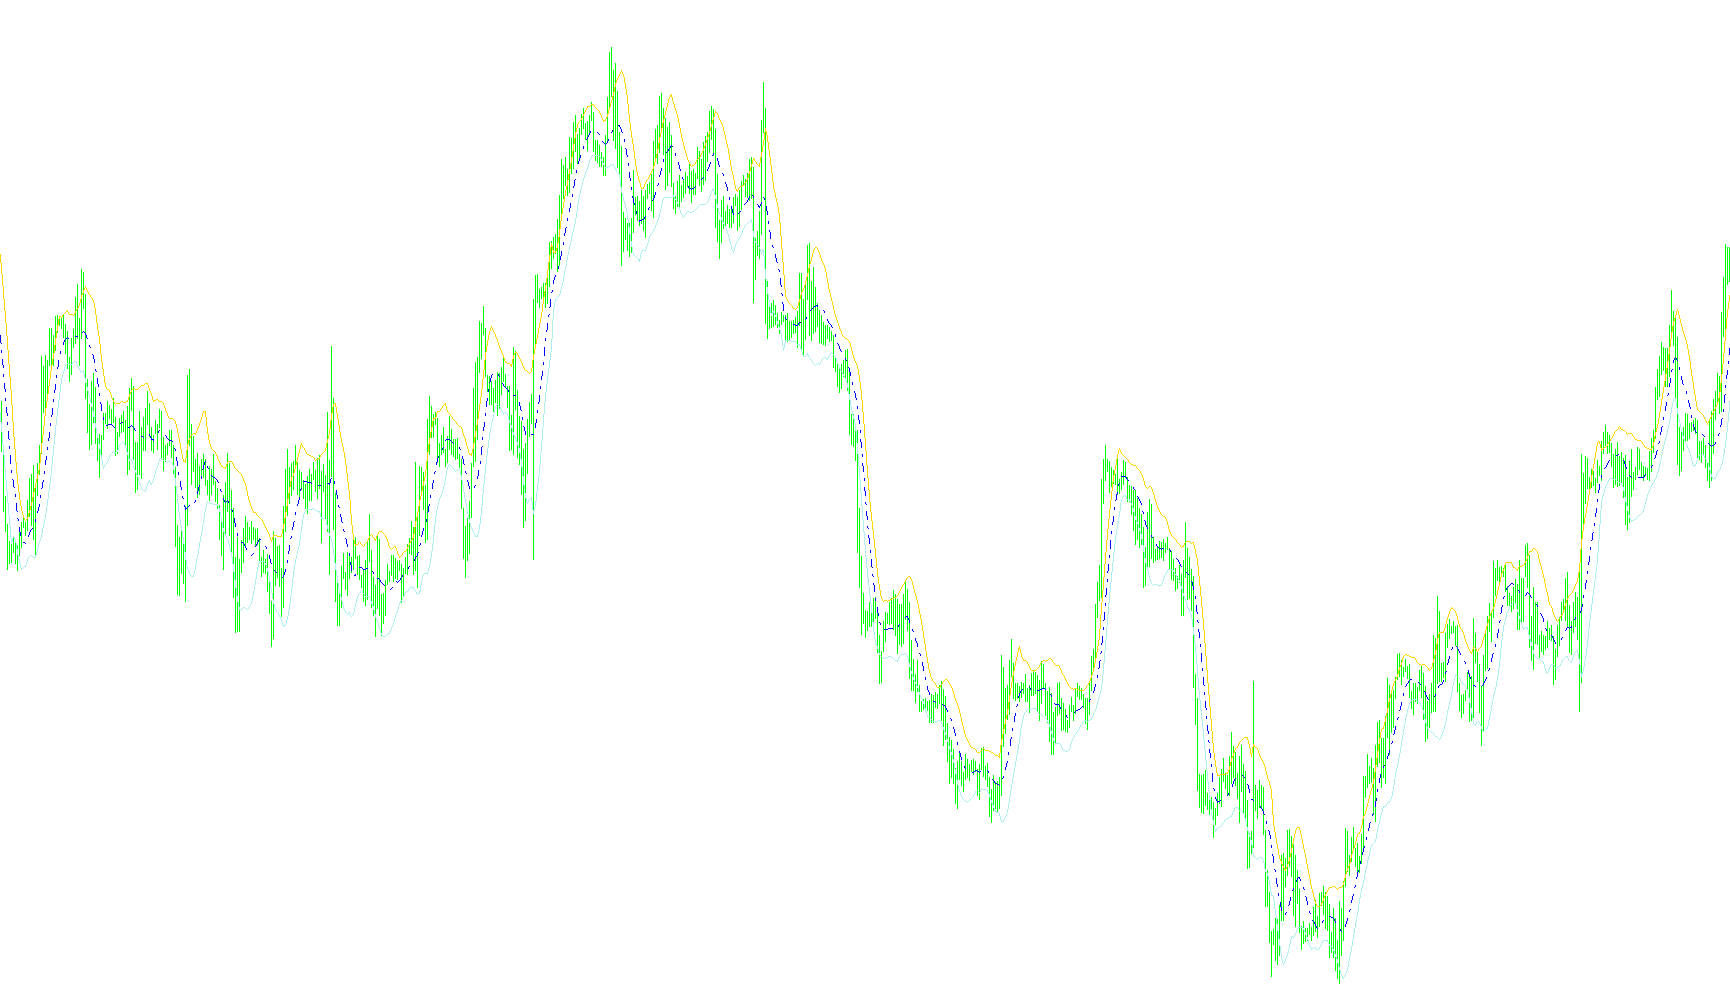
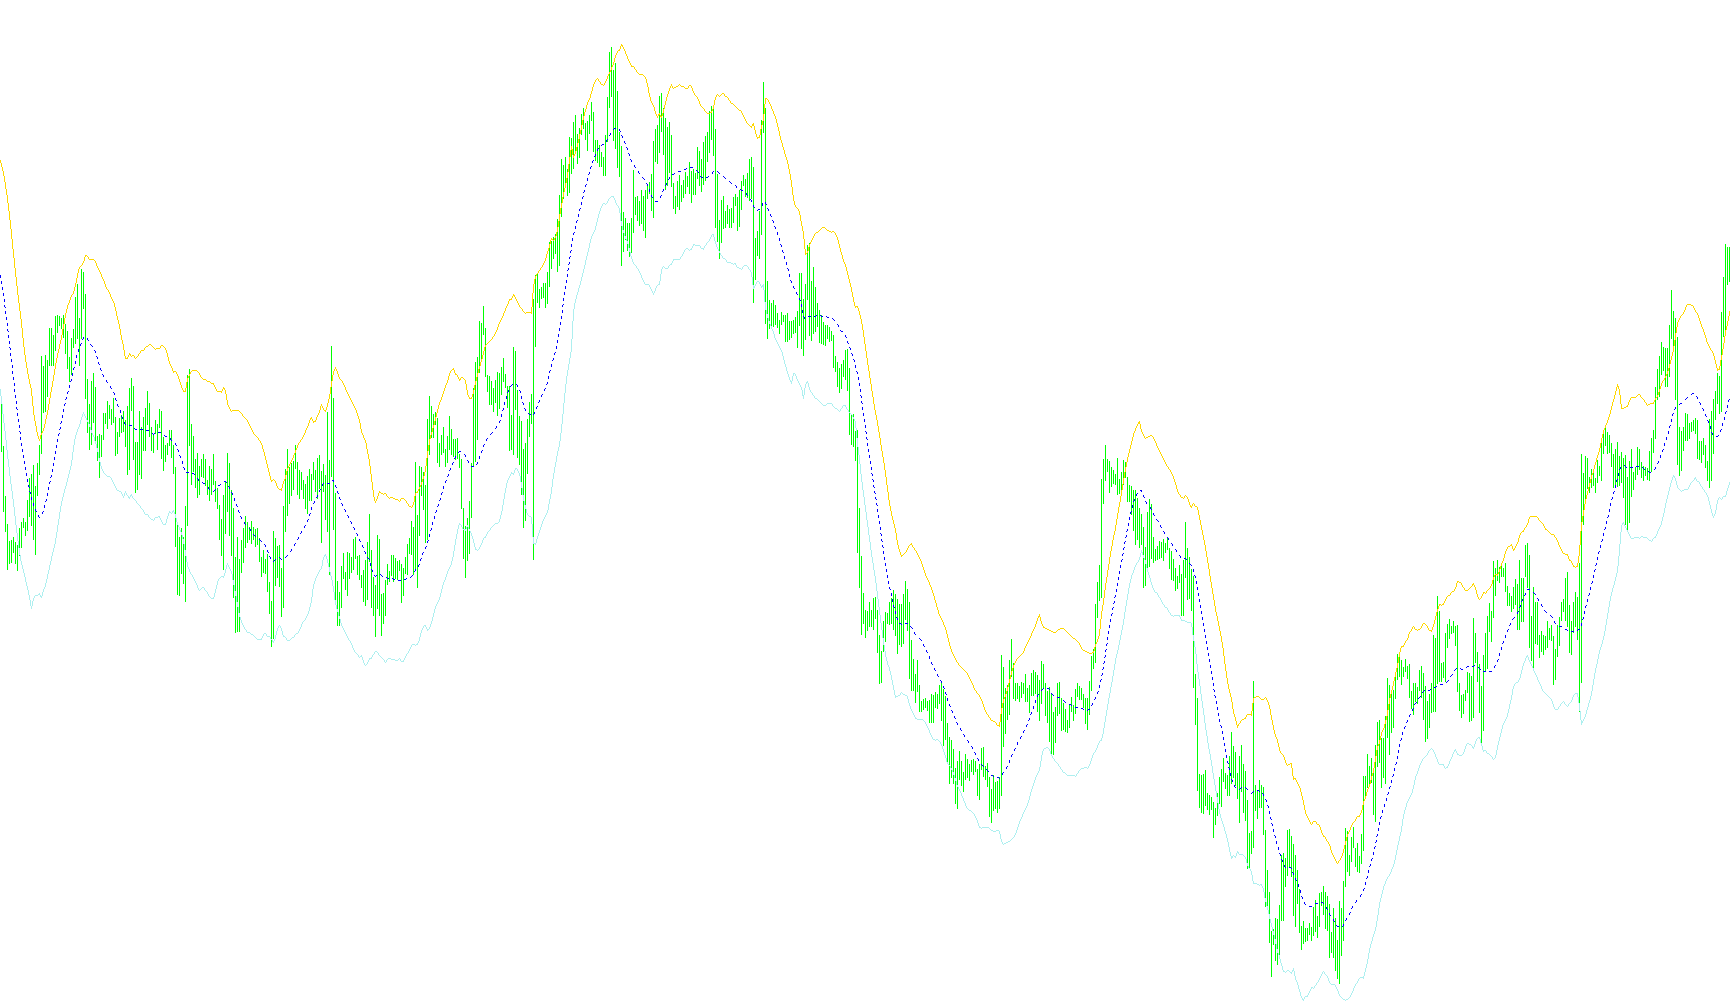
This indicator calculates linear regression paths to identify price extremes and project three distinct price zones based on the historical volatility of high and low deviations.

K-Barishpoltz Channel Fractals
Indicator

K-Barishpoltz Channel Fractals

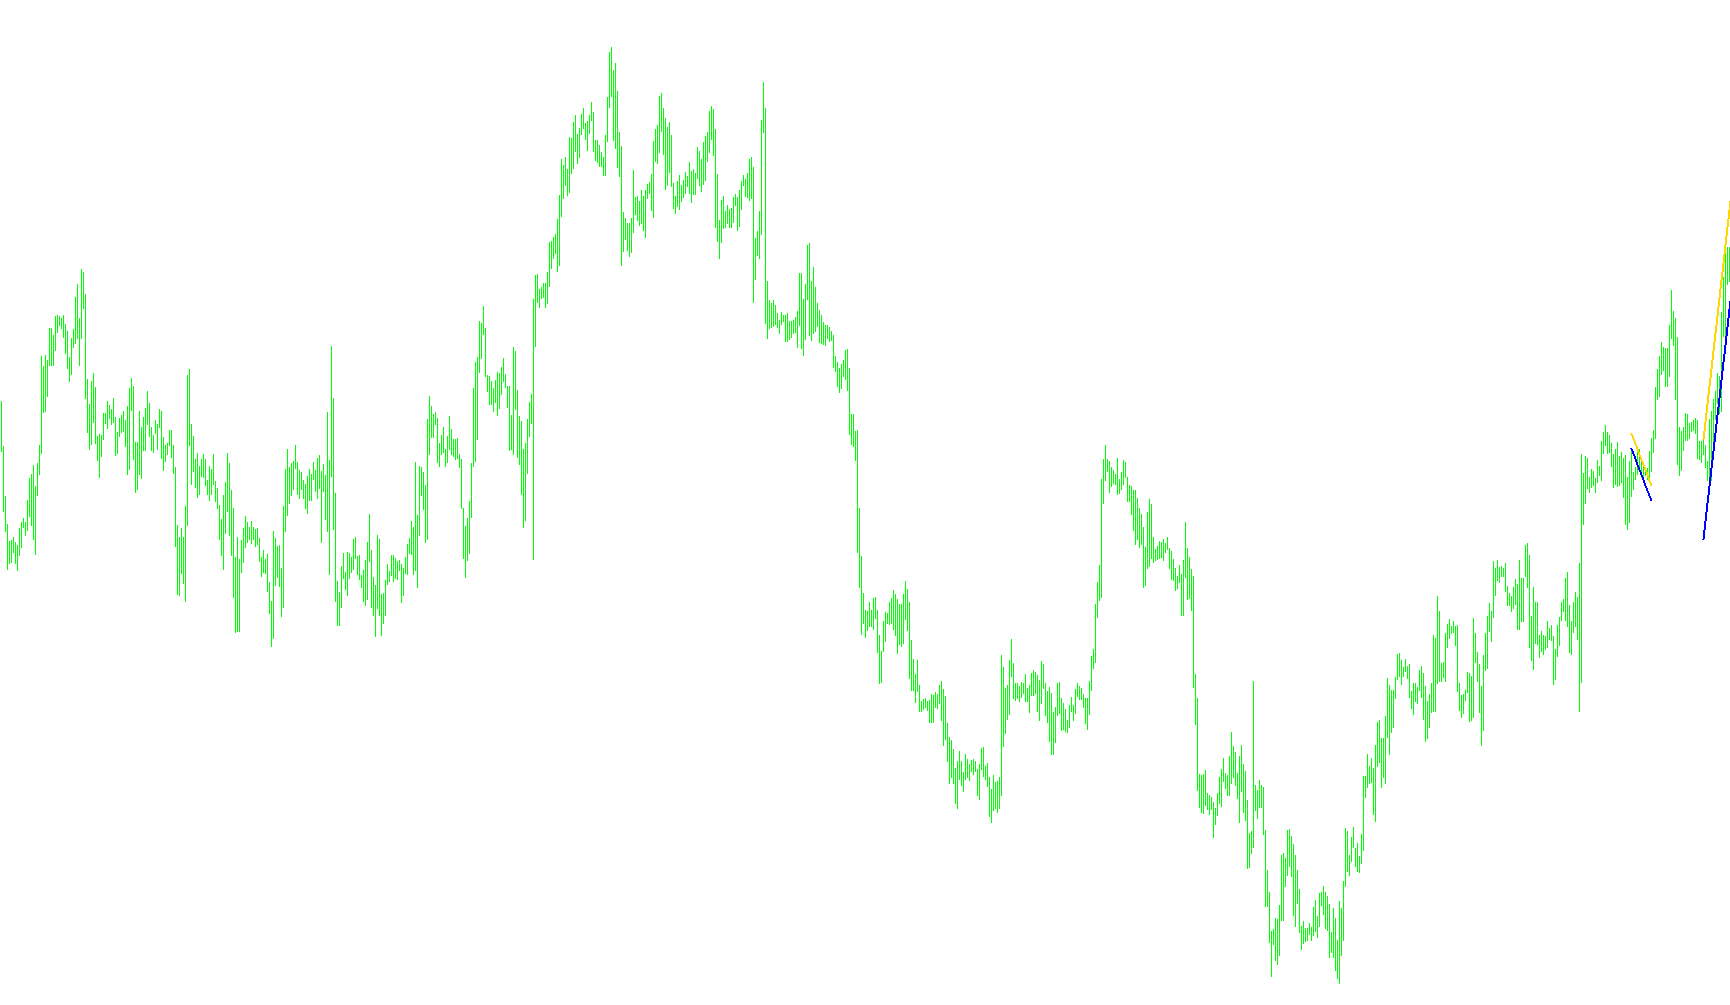
This indicator automatically identifies price structural extremes to construct dynamic linear channels that define market boundaries and potential correction zones.

K-Barishpoltz Channel
Indicator

K-Barishpoltz Channel

This indicator dynamically identifies significant price extremes to construct and render trend-following channels that automatically validate structural integrity by verifying that no price bars breach the established boundaries.

K-HandChannel_2
Indicator

K-HandChannel_2

This indicator dynamically constructs multi-line price channels by calculating linear trajectories from three user-defined historical anchor points—two base points and one central vertex.

K-i-SKB-F
Indicator

K-i-SKB-F

iFractals
k3-ZZ
Indicator

k3-ZZ

This indicator identifies structural swing points to project dynamic Fibonacci expansion levels and automated risk-reward price targets.

KAGI_1
Indicator

KAGI_1

This indicator filters price action by identifying discrete directional movements that exceed a user-defined percentage or point threshold, effectively smoothing volatility into structural trends.

KAGI_1[1]
Indicator

KAGI_1[1]

This indicator reconstructs Japanese Candlestick Kagi price action by filtering price fluctuations through a customizable percentage or point-based volatility threshold to identify structural trend shifts.

Kairi
Indicator

Kairi

iMA

This indicator quantifies the percentage variance between the current closing price and a simple moving average to highlight momentum extremes.

Kalman filter
Indicator

Kalman filter

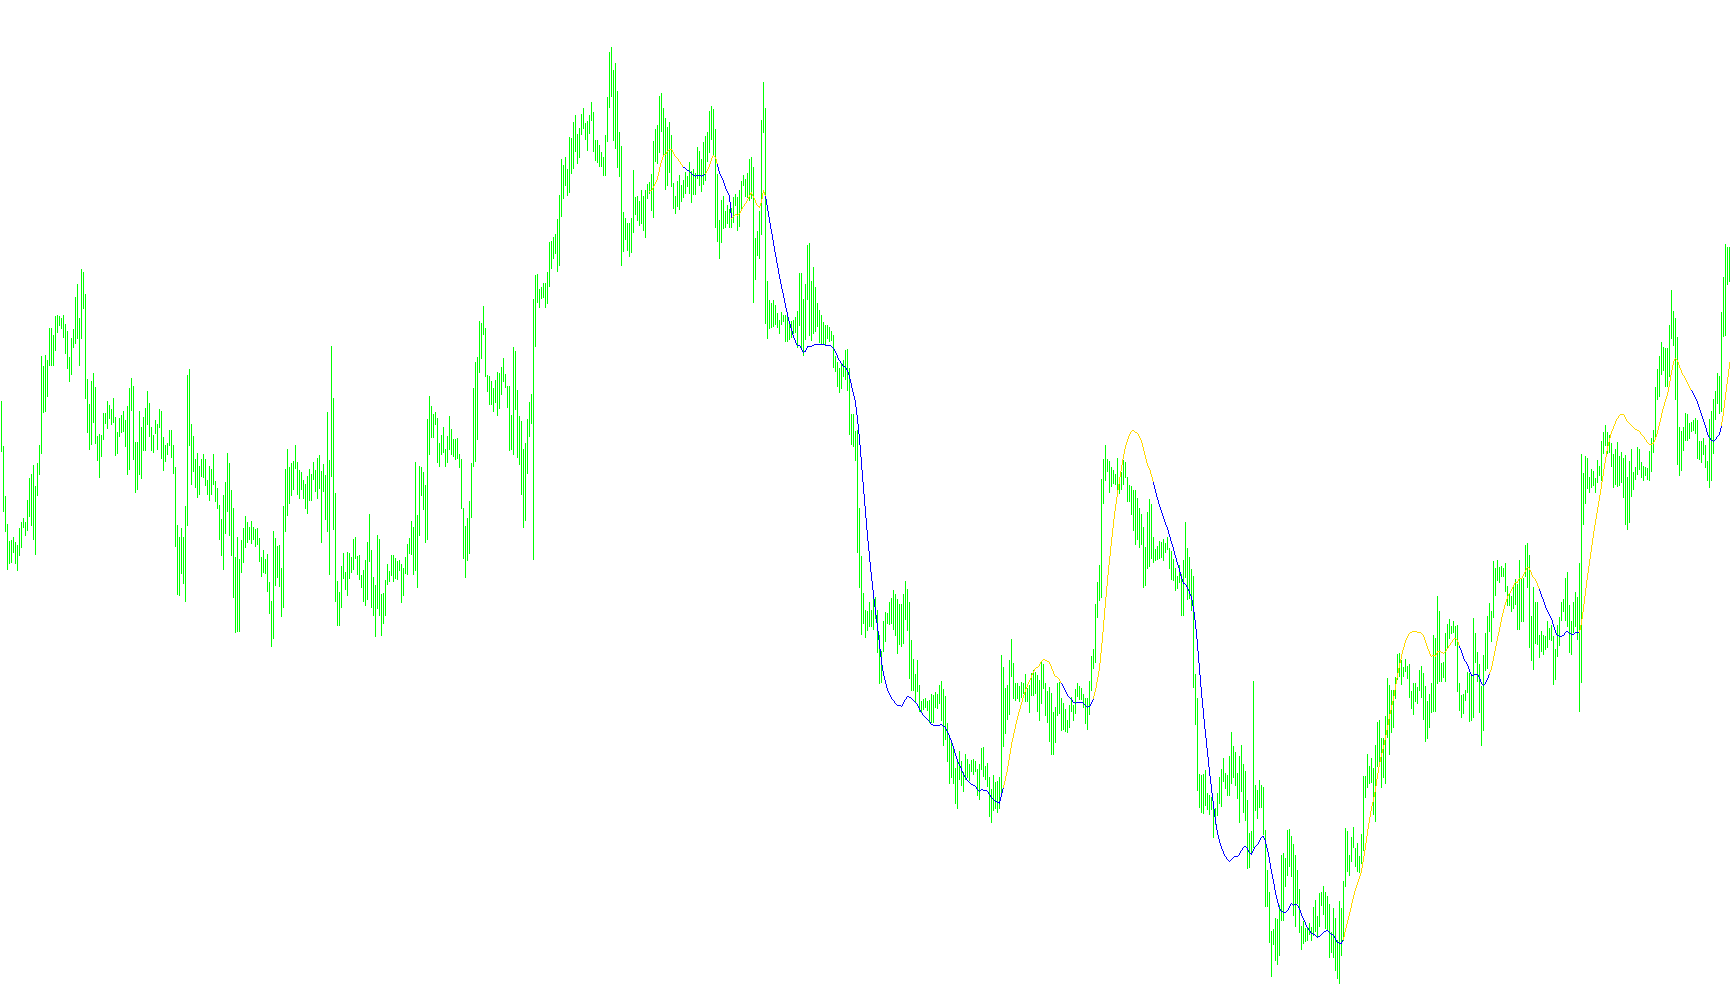
This indicator employs a recursive feedback loop to estimate price trajectory by calculating the weighted velocity and error correction of selected price data points.

Kalman filter_v1
Indicator

Kalman filter_v1

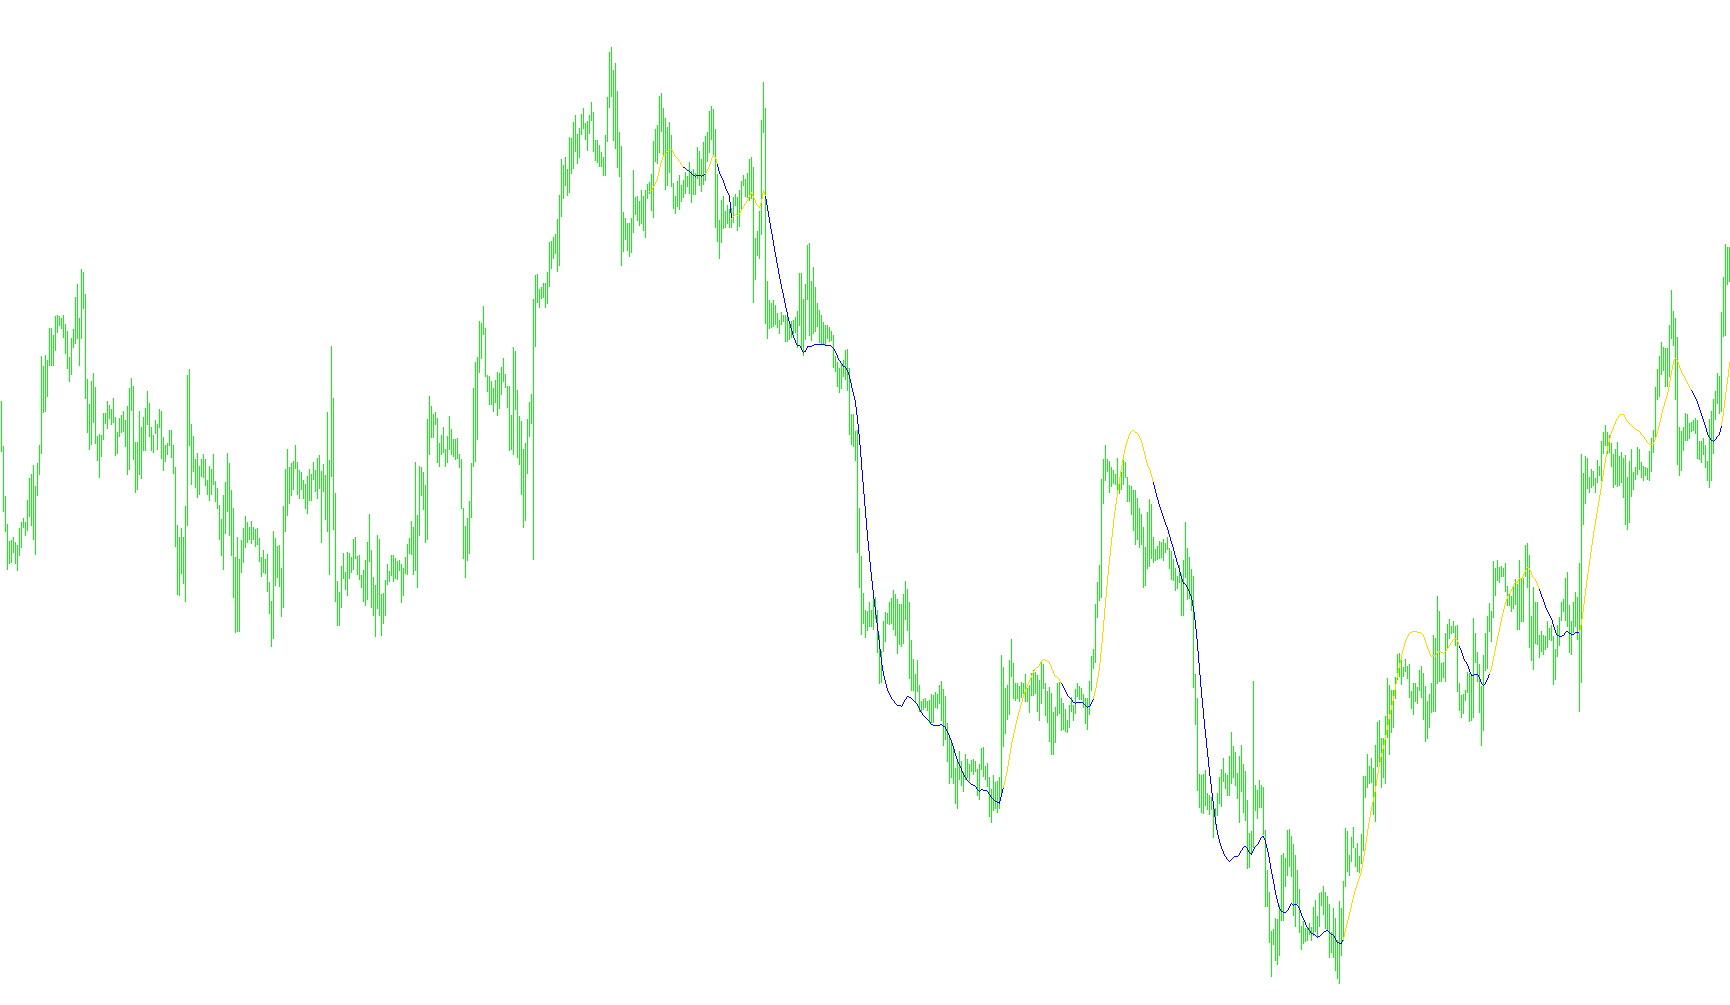
This indicator utilizes a recursive Kalman-inspired algorithm to estimate price momentum and velocity, generating dual tracking lines that bifurcate based on directional kinetic shifts.

Kalman filter_v2
Indicator

Kalman filter_v2

This indicator employs a recursive feedback loop to estimate price trajectory by calculating instantaneous velocity and error variance across various price data modes.

KAMA
Indicator

KAMA

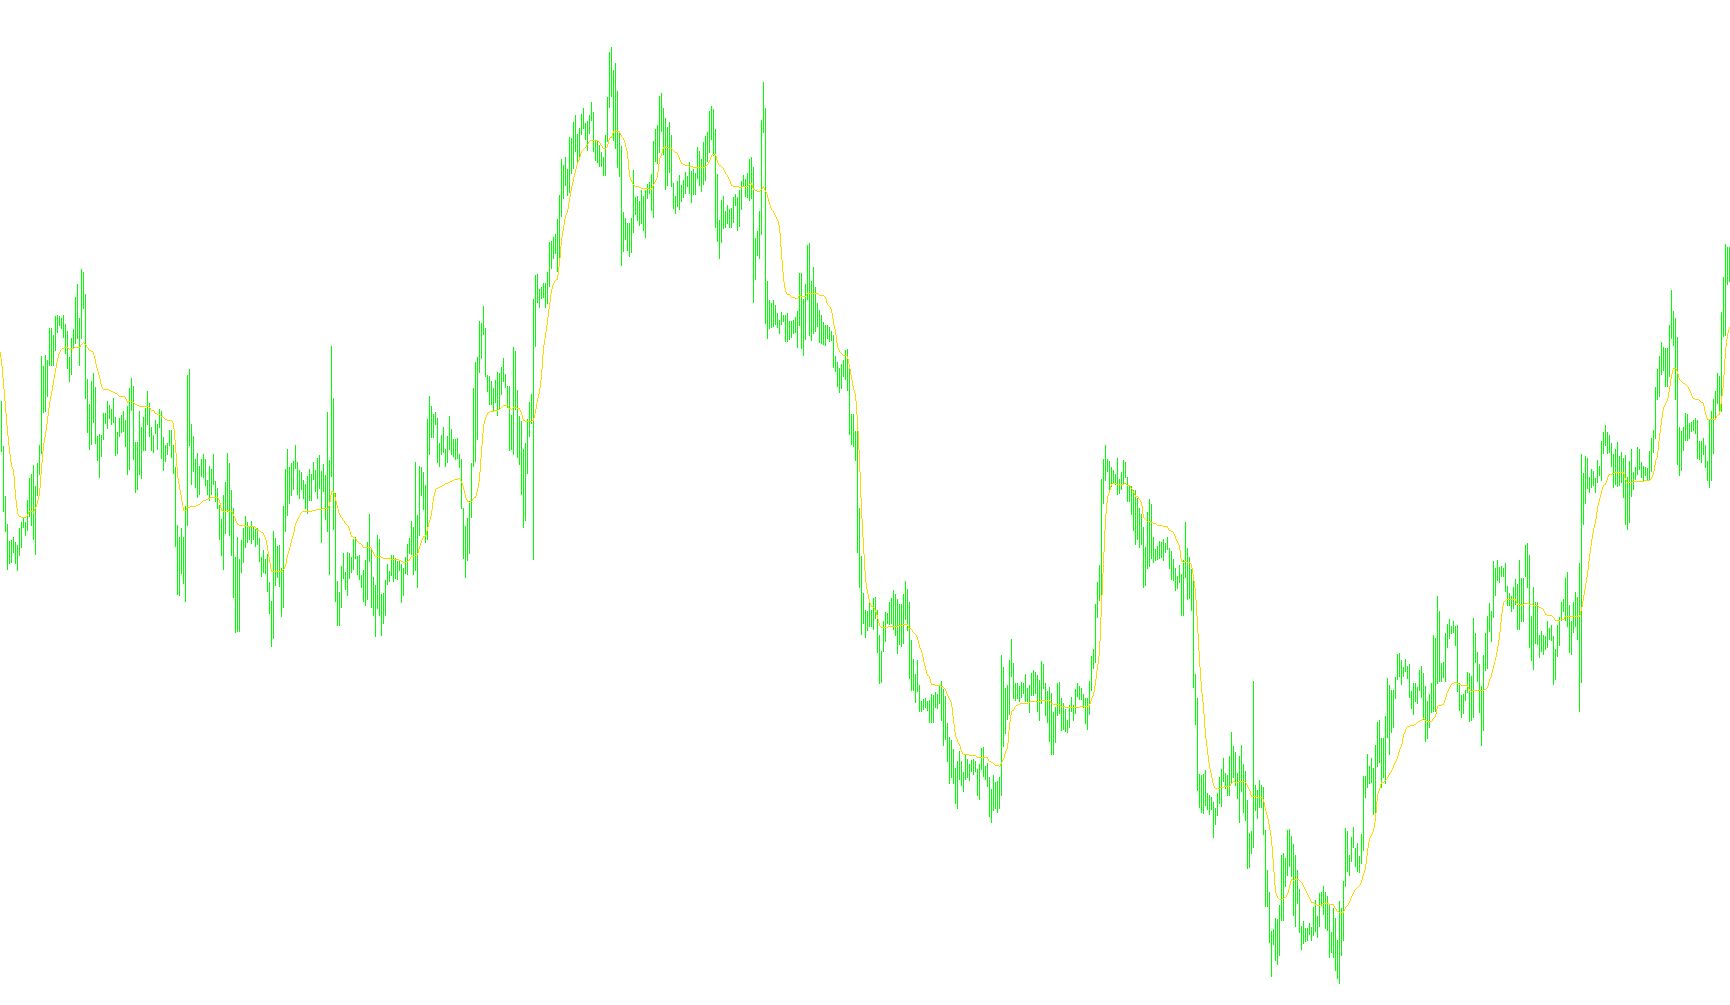
This algorithm calculates a dynamic moving average by weighting price movements against local noise variance to filter out market fluctuations.

KAMARev
Indicator

KAMARev

This indicator calculates a customized momentum path by blending price movement with a volatility-sensitive constant to filter noise and highlight directional trends.

KAMARev2
Indicator

KAMARev2

This indicator calculates a modified Kaufman Adaptive Moving Average by weighting price direction against realized volatility to filter market noise and highlight significant trend shifts.

KAMARev2_v1
Indicator

KAMARev2_v1

The algorithm calculates a smoothed average price by weighing the Efficiency Ratio against historical volatility to filter noise and identify significant trend momentum.

KAMARev_v1
Indicator

KAMARev_v1

This indicator calculates a dynamic smoothing coefficient based on the efficiency ratio of price movement against local volatility to filter market noise and identify underlying trends.

Kamikaze[1]
Indicator

Kamikaze[1]

iMA

This indicator identifies bullish and bearish market biases by calculating the deviation between typical price and Simple Moving Averages across 5, 15, 30, and 60-minute intervals.

Kanal_Ant
Indicator

Kanal_Ant

iMA

This indicator projects a multi-layered dynamic corridor by calculating three distinct sets of upper and lower bands based on Fibonacci ratios (0.382, 0.618, and 1.0) applied to a moving average.

KantorInformationDD
Indicator

KantorInformationDD

iMA

This indicator aggregates multi-timeframe SMA averages to project daily and hourly weighted levels while providing real-time breakeven tracking and swap cost dynamics.

Kase CD Peak
Indicator

Kase CD Peak

iATRiMAOnArrayiStdDevOnArray

This indicator quantifies price action symmetry by normalizing high-low spreads against ATR and applying multi-stage smoothing to identify momentum shifts and volatility extremes.

Indicator

KaseCD Peak oscilator

iATRiMA
KasePeakOscilator_v1
Indicator

KasePeakOscilator_v1

iATRiMAOnArrayiStdDevOnArray

This indicator identifies trend reversals by calculating a relative high-low variance normalized by volatility and filtering momentum shifts through moving average deviations.

Kaufman
Indicator

Kaufman

This indicator utilizes a modified Kaufman Adaptive Moving Average to filter market noise and identify trend reversals based on price efficiency and momentum thresholds.

Kaufman2
Indicator

Kaufman2

This indicator filters market volatility by dynamically adjusting a moving average's responsiveness based on the ratio of price movement to cumulative noise.

Kaufman2_v1
Indicator

Kaufman2_v1

This algorithm dynamically adjusts smoothing by calculating the ratio between price movement magnitude and historical volatility to filter market noise.

Kaufman2_v2
Indicator

Kaufman2_v2

This algorithm calculates a dynamic moving average by scaling the price reaction based on the ratio between directional movement and market noise.

Indicator

Kaufman3

Indicator

Kaufman3_v1

Kaufman_Bands
Indicator

Kaufman_Bands

This indicator calculates an efficiency-ratio based smoothed average adjusted by market noise to generate dynamic trend signals and volatility bands.

Kaufman_Bands_v1
Indicator

Kaufman_Bands_v1

This indicator identifies momentum shifts by filtering market noise through an efficiency ratio and generating signal arrows based on volatility-adjusted price deviations.

Kaufman_Bands_v2
Indicator

Kaufman_Bands_v2

This indicator synthesizes Kaufman's Adaptive Moving Average with Bollinger Band dynamics to filter market noise and identify momentum shifts through volatility-adjusted trend tracking.

Kaufman_v1
Indicator

Kaufman_v1

This indicator calculates a smoothed average momentum by weighing price volatility against noise to identify directional trend shifts via threshold-based signal points.

Kaufman_v2
Indicator

Kaufman_v2

This indicator calculates an adaptive moving average that dynamically adjusts its sensitivity based on the Efficiency Ratio to filter market noise and identify directional momentum shifts.

Kaufman_v3
Indicator

Kaufman_v3

This indicator utilizes an Efficiency Ratio to dynamically adjust the smoothing of a moving average, filtering market noise to identify significant trend momentum shifts.

KaufWMAcross
Indicator

KaufWMAcross

iMA

This indicator identifies bullish and bearish trend shifts by detecting the exact price point where a Kaufman Adaptive Moving Average crosses a Linear Weighted Moving Average.

KaufWMAcross_v2
Indicator

KaufWMAcross_v2

iMA

This indicator identifies trend reversals by detecting price action crossovers between the Kaufman Adaptive Moving Average and a Linear Weighted Moving Average.

KC
Indicator

KC

iATRiMA

This indicator generates a dynamic corridor by offsetting an Exponential Moving Average by a multiple of the Average True Range to visualize price volatility limits.

KC_v1
Indicator

KC_v1

iATRiMA

This indicator calculates a dynamic trading channel by offsetting an Exponential Moving Average by a multiplier of the Average True Range to identify volatility-based extremes.

KC_v2
Indicator

KC_v2

iATRiMA

This indicator projects a dynamic trading corridor by calculating the deviation of an Exponential Moving Average based on a multiplier of the Average True Range.

KDJ
Indicator

KDJ

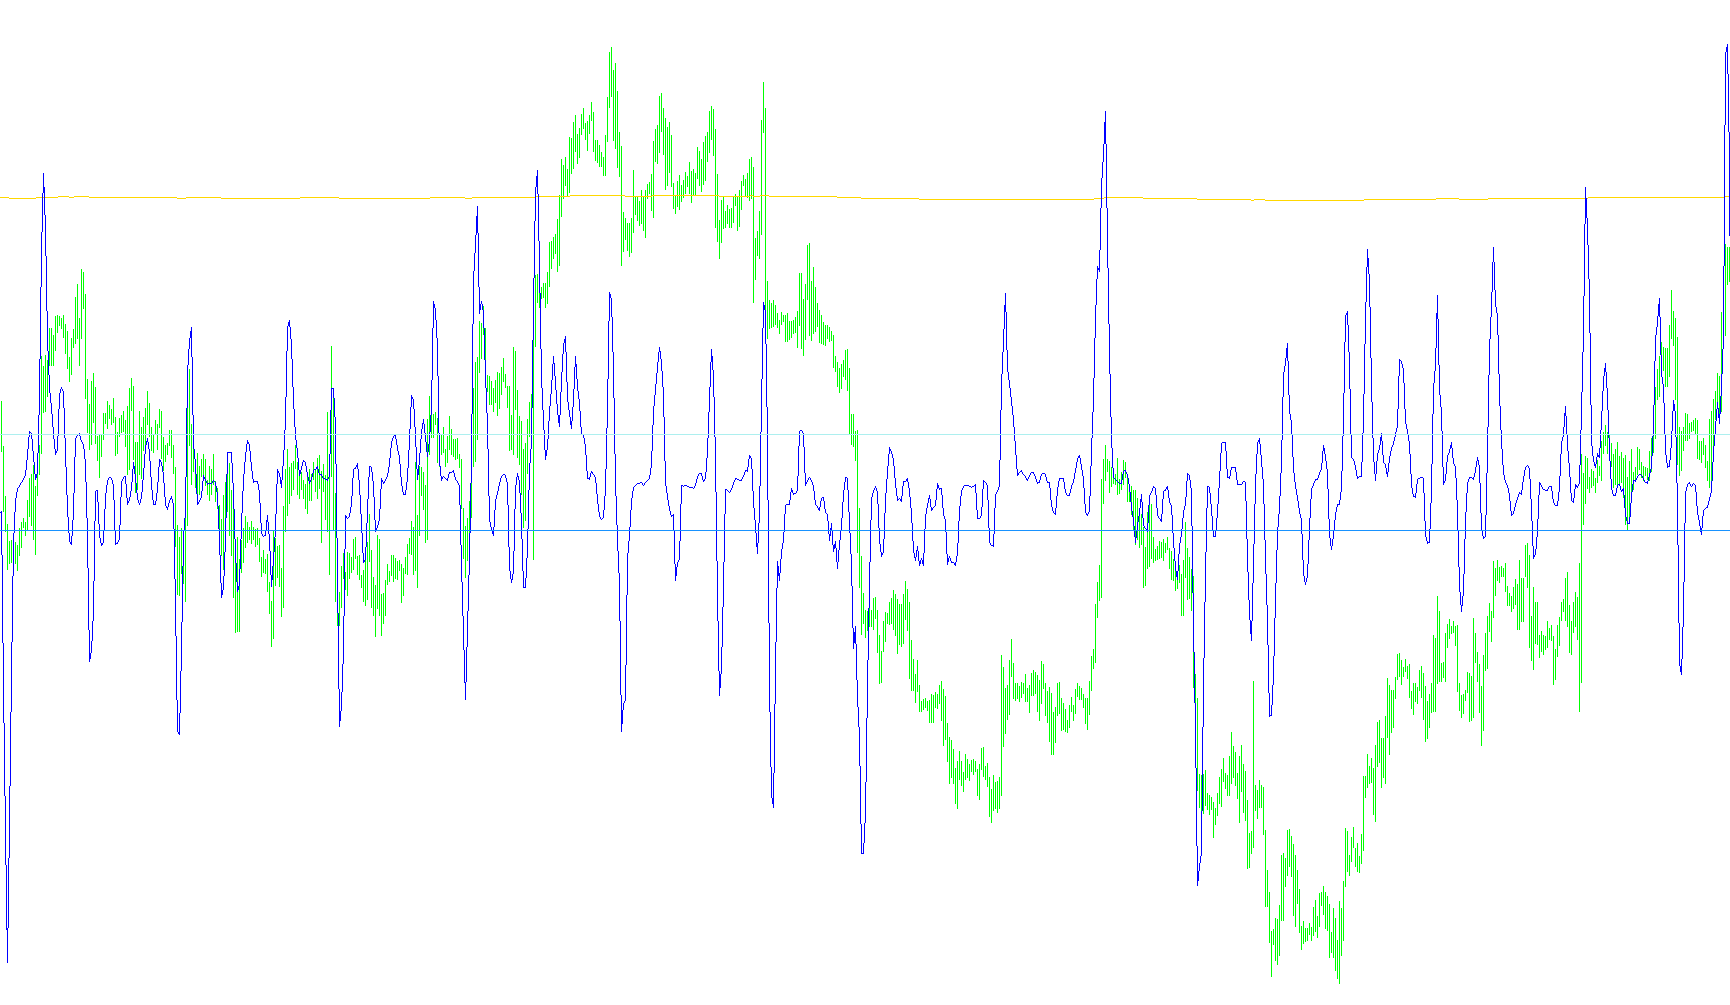
This indicator calculates the Relative Strength Value (RSV) based on high and low price extremes to derive K, D, and J momentum components through smoothed moving averages.

Indicator

kdjalert

kdj_v1
Indicator

kdj_v1

This indicator calculates momentum by deriving a smoothed Relative Strength Value (RSV) to generate K, D, and J components along with a differential variance histogram.

kdj_v2
Indicator

kdj_v2

This indicator calculates the relative strength of price action by transforming a smoothed range value into three distinct components to identify overbought and oversold conditions.

Keltner Channel
Indicator

Keltner Channel

iMA

This indicator calculates a dynamic trading corridor by offsetting a typical price moving average with the mean daily range to visualize price expansion and contraction.

Keltner Channels B
Indicator

Keltner Channels B

iATRiMA

This indicator calculates a centralized moving average baseline flanked by upper and lower boundaries derived from customized range-based volatility offsets.

Keltner Channels F
Indicator

Keltner Channels F

iATRiMA

This indicator calculates a central moving average flanked by upper and lower boundaries derived from the product of K-factor and either Average True Range or custom range variance.

Keltner Channels
Indicator

Keltner Channels

iMA

This indicator maps price action boundaries by offsetting a simple moving average of typical prices by the mean absolute range of recent candles.