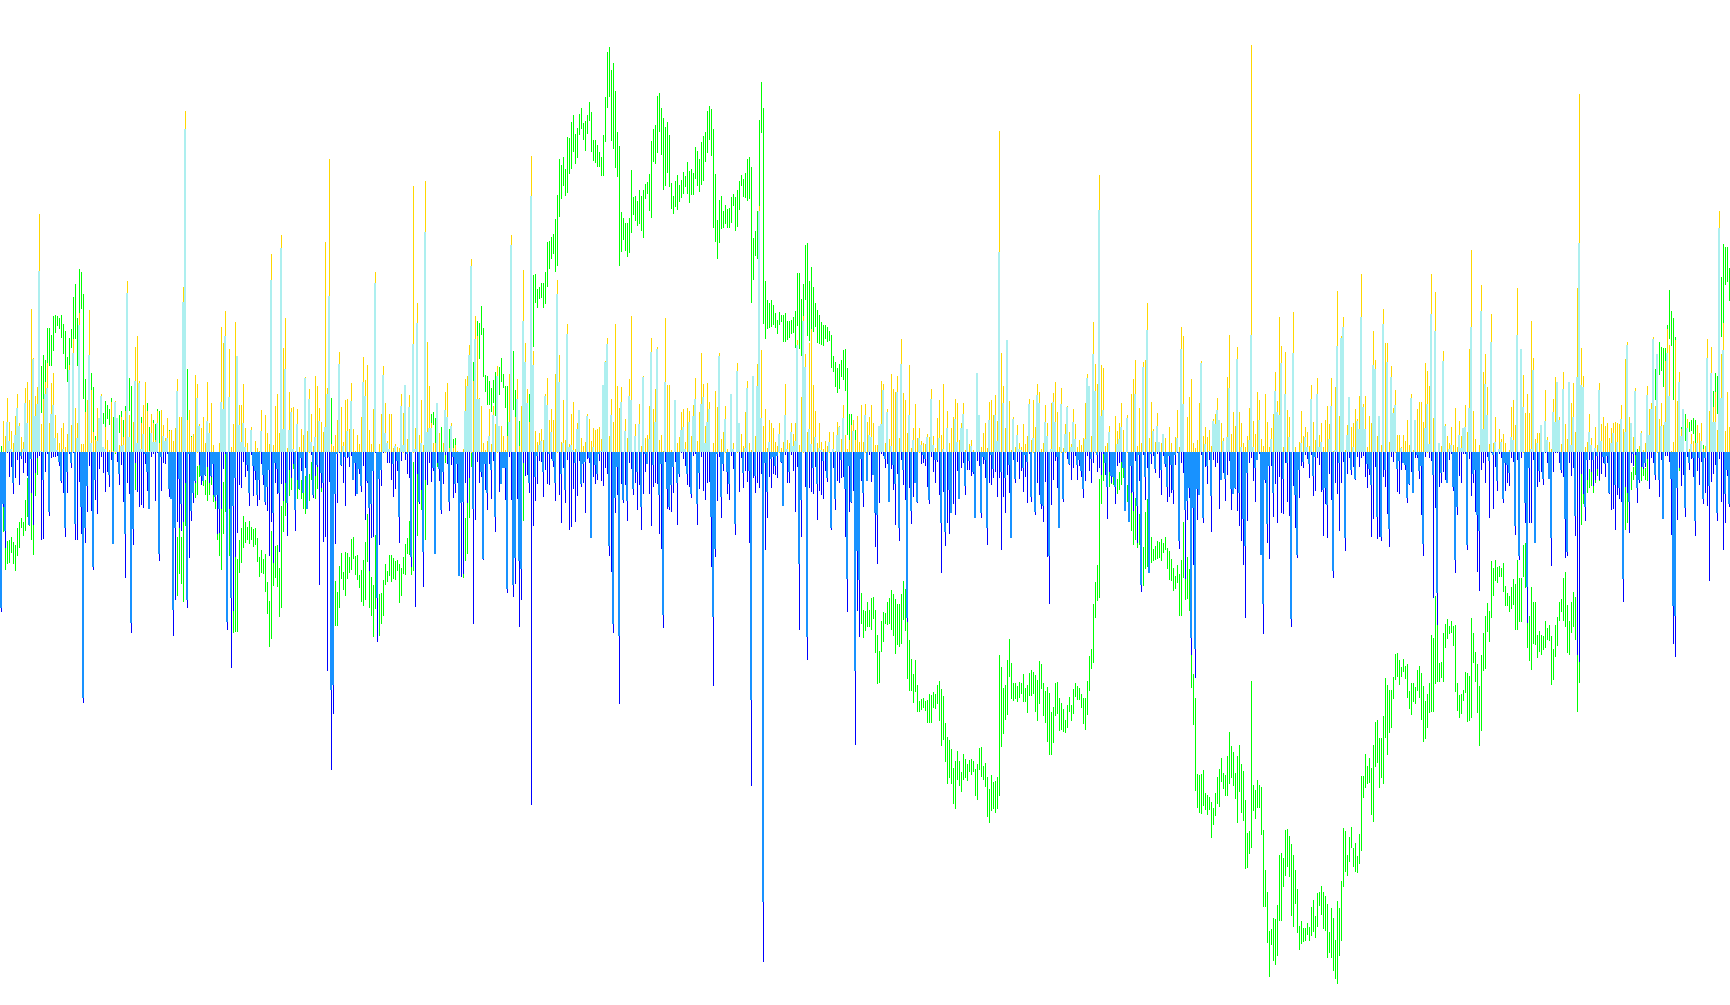
This tool is designed to provide a visual representation of price movement by stripping away the standard "noise" of currency charts and focusing on the relative distance of price action from the opening point of each candle. By isolating these specific movements, it helps traders visualize the intensity and direction of price fluctuations more clearly.
Core Functionality
The script processes every historical bar on your chart to determine three key metrics for each period:
- The High Distance: How far the price climbed above the opening price.
- The Low Distance: How far the price dropped below the opening price.
- The Closing Sentiment: The final net position of the candle relative to its start.
How It Works Visually
Instead of displaying standard prices, this indicator creates a dedicated visual window where movements are plotted as histograms. Here is how the logic translates into what you see on your screen:
- Range Mapping: For every single candle, the script calculates the maximum upward reach (High) and the maximum downward reach (Low). These are plotted as distinct data points, allowing you to see the total "swing" or volatility of a price bar regardless of where it eventually finished.
- Directional Filtering: The script intelligently separates "winning" moves from "losing" moves.
- If a candle closed higher than it opened (a bullish move), the logic highlights the closing price distance specifically.
- If a candle closed lower than it opened (a bearish move), it isolates that downward closing distance instead.
- Color Coding: To make these movements intuitive at a glance, the script uses a dual-color system (Blue and Red). This creates a clear visual distinction between upward momentum and downward pressure, helping you quickly identify the prevailing trend and the strength of price action over time.
Key Benefits for the User
By using this logic, you can more easily observe the "stretch" of the market. Rather than looking at complex wicks and bodies, you are presented with a cleaned-up view of how aggressively the price pushed in either direction relative to its opening position. It effectively turns raw price data into a visual map of momentum and volatility.
//+------------------------------------------------------------------+
//|                                             Linear Price Bar.mq4 |
//|                                      Copyright © 2006, Keris2112 |
//|                                                             none |
//+------------------------------------------------------------------+
#property copyright "Copyright © 2006, Keris2112"
#property link      "none"

#property indicator_separate_window
#property indicator_buffers 4
#property indicator_color1 Blue
#property indicator_color2 Red
#property indicator_color3 Blue
#property indicator_color4 Red


//---- buffers

double ExtMapBuffer1[];
double ExtMapBuffer2[];
double ExtMapBuffer3[];
double ExtMapBuffer4[];

//+------------------------------------------------------------------+
//| Custom indicator initialization function                         |
//+------------------------------------------------------------------+
int init()
  {
//---- indicators
   SetIndexStyle(0,DRAW_HISTOGRAM);
   SetIndexBuffer(0,ExtMapBuffer1);
   SetIndexStyle(1,DRAW_HISTOGRAM);
   SetIndexBuffer(1,ExtMapBuffer2);
   SetIndexStyle(2,DRAW_HISTOGRAM,EMPTY,3);
   SetIndexBuffer(2,ExtMapBuffer3);
   SetIndexStyle(3,DRAW_HISTOGRAM,EMPTY,3);
   SetIndexBuffer(3,ExtMapBuffer4);

//----
   return(0);
  }
//+------------------------------------------------------------------+
//| Custor indicator deinitialization function                       |
//+------------------------------------------------------------------+
int deinit()
  {
//----

//----
   return(0);
  }
//+------------------------------------------------------------------+
//| Custom indicator iteration function                              |
//+------------------------------------------------------------------+
int start()
  {
   int    counted_bars=IndicatorCounted();
   int i;
   int UpDays, DownDays, NeutralDays;
   double BarH, BarL, BarC;

//----
   for(i=0; i<Bars; i++)
      {
      BarH = High[i]-Open[i];
      BarL = Low[i]-Open[i];
      BarC = Close[i]-Open[i];
      if(BarC>0) UpDays += 1;
         else if(BarC<0) DownDays +=1;
         else if(BarC==0) NeutralDays +=1;


      ExtMapBuffer1[i] = BarH;
      ExtMapBuffer2[i] = BarL;
//      SortBuffer1[i] = BarH;
//      SortBuffer2[i] = BarL;
      if(Close[i]>Open[i])
         {
         ExtMapBuffer3[i] = BarC;
         ExtMapBuffer4[i] = 0;
         }
         else
         {
         ExtMapBuffer3[i] = 0;
         ExtMapBuffer4[i] = BarC;
         }


      }

//----
   return(0);
  }
//+------------------------------------------------------------------+
Comments