Linear Regression Line2_v1
Download script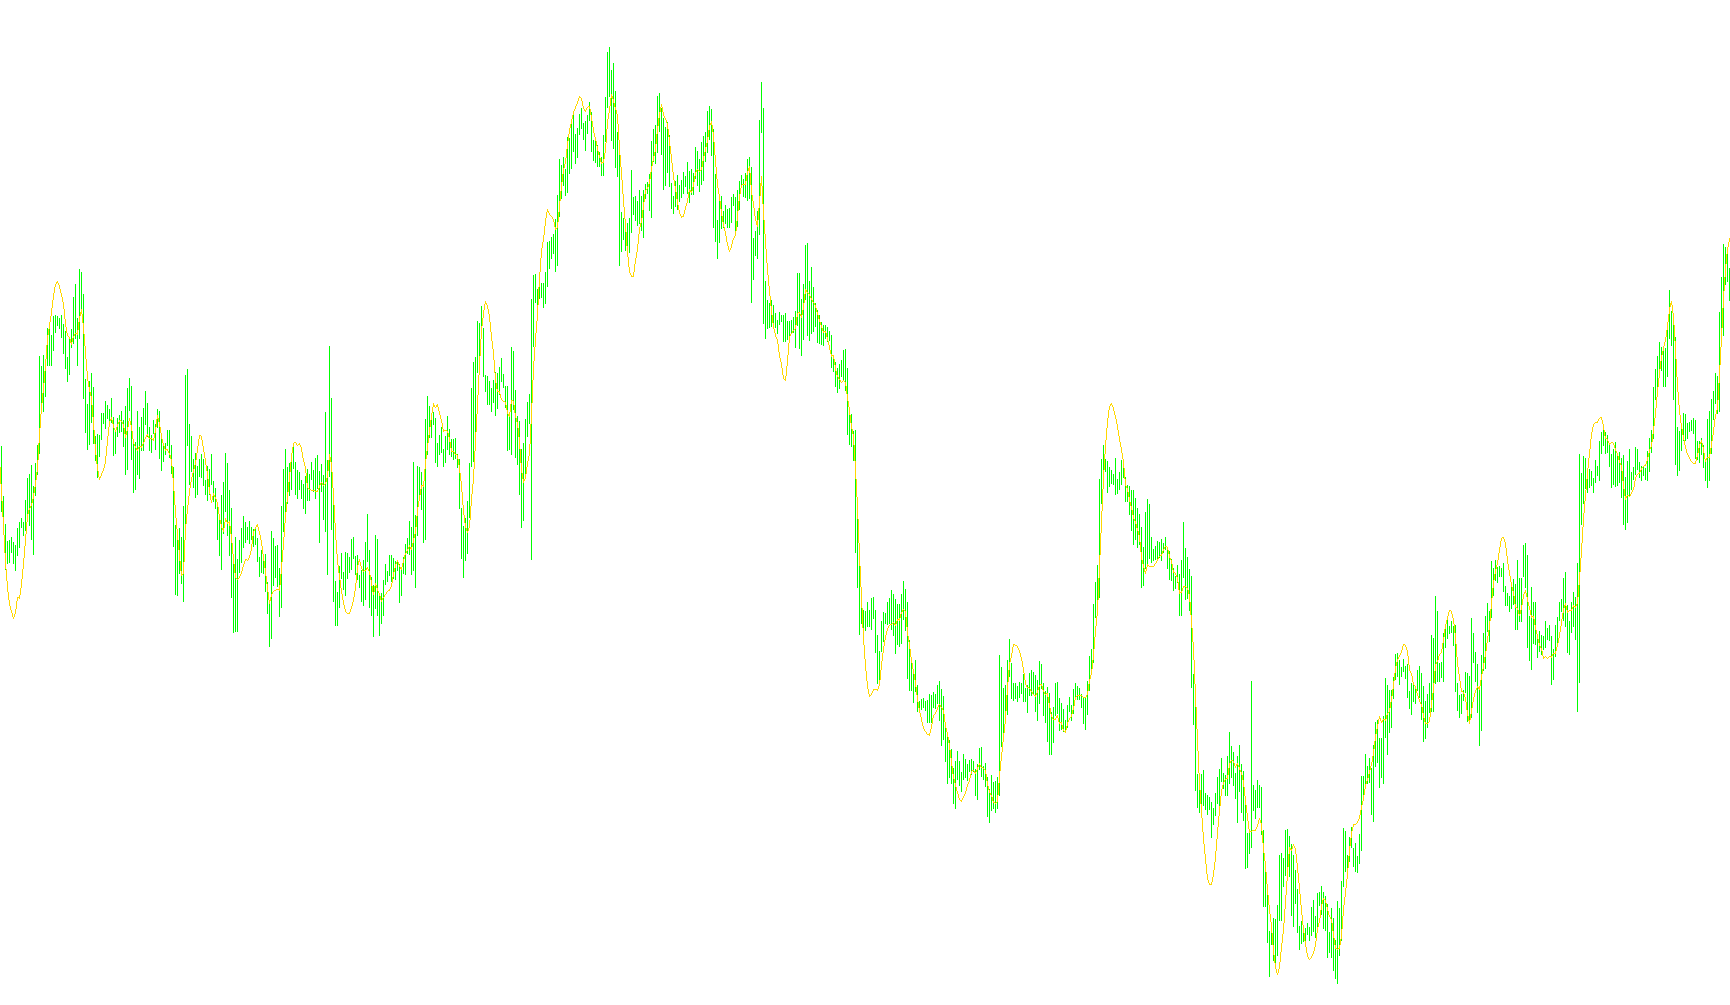
This script is designed to provide a visual tool for traders by identifying and plotting a "Line of Best Fit" on a price chart. It utilizes a mathematical concept known as Linear Regression to help smooth out market noise and identify the underlying trend of an asset's price movement over a specific period.
Core Logic and Functionality
The primary objective of this script is to calculate the most accurate straight line that passes through a set of historical price points. Instead of simply connecting dots, it looks at a rolling window of data to determine the direction and velocity of the market.
How it works step-by-step:
- User-Defined Period: The tool starts by looking at a specific number of previous candles (the "Period"). This allows you to choose whether you want to see a short-term trend or a long-term historical trajectory.
- Data Collection: For every point on the chart, the script gathers the closing prices for the duration of the chosen period.
- Mathematical Calculation: It performs a series of calculations to determine two vital components of a trend line:
- The Slope (m): This determines how steeply the price is rising or falling.
- The Intercept (yint): This establishes where the line sits relative to the current price.
- Trend Plotting: By combining the slope and the intercept, the script calculates a single coordinate for every point in time. These coordinates are then joined together to draw a continuous orange line on your chart.
Key Benefits for the User
Because this script uses regression logic rather than simple moving averages, it offers several unique characteristics:
- Trend Clarity: It provides a "cleaner" view of the market by ignoring minor price fluctuations (volatility) and focusing on the overarching path of the price.
- Dynamic Adaptation: As new price data enters the chart, the line automatically recalculates. If the price begins to change direction significantly, the slope of the line will adjust to reflect that new momentum.
- Visual Reference: The orange line serves as a constant reference point. When the current price is significantly above the line, it may suggest an overextended upward move; when below, it may indicate a downward trend.
In summary, this script transforms raw, jagged price data into a structured visual path, helping you identify whether the market is currently trending up, down, or moving sideways based on its most recent historical behavior.
/*-----------------------------+
|			       |
| Shared by www.Aptrafx.com    |
|			       |
+------------------------------*/

//+------------------------------------------------------------------+
//|                                       Linear Regression Line.mq4 |
//|                                                      MQL Service |
//|                                           scripts@mqlservice.com |
//|                              modified by: Ronald Verwer/ROVERCOM |
//|                                                     09 June 2006 |
//+------------------------------------------------------------------+
#property copyright "MQL Service"
#property link      "www.mqlservice.com"

#property indicator_chart_window
#property indicator_buffers 1
#property indicator_color1 Orange
#property indicator_width1 2

//---- input parameters
extern int LRLPeriod=14;
//---- buffers
double LRLBuffer[];

int shift=0;
int n=0;
double sumx=0, sumy=0, sumxy=0, sumx2=0, sumy2=0;
double m=0, yint=0, r=0;
//+------------------------------------------------------------------+
//|                    INITIALIZATION FUNCTION                       |
//+------------------------------------------------------------------+
int init()
  {
//---- indicators
   SetIndexStyle(0,DRAW_LINE);
   SetIndexBuffer(0,LRLBuffer);
   IndicatorDigits(Digits);
   if(LRLPeriod < 2) LRLPeriod = 2;
   IndicatorShortName("Linear Regression Line ("+LRLPeriod+")");
   SetIndexDrawBegin(0,LRLPeriod+2);
   IndicatorDigits(MarketInfo(Symbol(),MODE_DIGITS)+4);
//----
   return(0);
  }
//+------------------------------------------------------------------+
//|                   DEINITIALIZATION FUNCTION                      |
//+------------------------------------------------------------------+
int deinit()
  {
   return(0);
  }
//+------------------------------------------------------------------+
//|                      ITERATION FUNCTION                          |
//+------------------------------------------------------------------+
int start()
  {
   int limit;
   int counted_bars=IndicatorCounted();
   if(counted_bars<0) counted_bars=0;
   if(counted_bars>0) counted_bars--;
   limit=Bars-counted_bars;

   for(int shift=limit-1; shift>=0; shift--)
      {
         sumx = 0;
         sumy = 0;
         sumxy = 0;
         sumx2 = 0;
         sumy2 = 0;
         for(n = 0; n <= LRLPeriod-1; n++)
             {
               sumx = sumx + n;
               sumy = sumy + Close[shift + n];
               sumxy = sumxy + n * Close[shift + n];
               sumx2 = sumx2 + n * n;
               sumy2 = sumy2 + Close[shift + n] * Close[shift + n];
             }
         if(LRLPeriod*sumx2-sumx*sumx==0)
            {m=(LRLPeriod*sumxy-sumx*sumy)/(0.00000001);}
         else
            {m=(LRLPeriod*sumxy-sumx*sumy)/(LRLPeriod*sumx2-sumx*sumx);}
         yint=(sumy+m*sumx)/LRLPeriod;
         if(MathSqrt((LRLPeriod*sumx2-sumx*sumx)*(LRLPeriod*sumy2-sumy*sumy))==0)
            {r=(LRLPeriod*sumxy-sumx*sumy)/(0.00000001);}
         else
            {r=(LRLPeriod*sumxy-sumx*sumy)/MathSqrt((LRLPeriod*sumx2-sumx*sumx)*(LRLPeriod*sumy2-sumy*sumy));}
         LRLBuffer[shift]=yint-m*LRLPeriod;
         //Print (" "+shift+" "+LRLBuffer[shift]);
      }
   return(0);
  }
//+------------------------------------------------------------------+
Comments