LastDayHighLow
Download script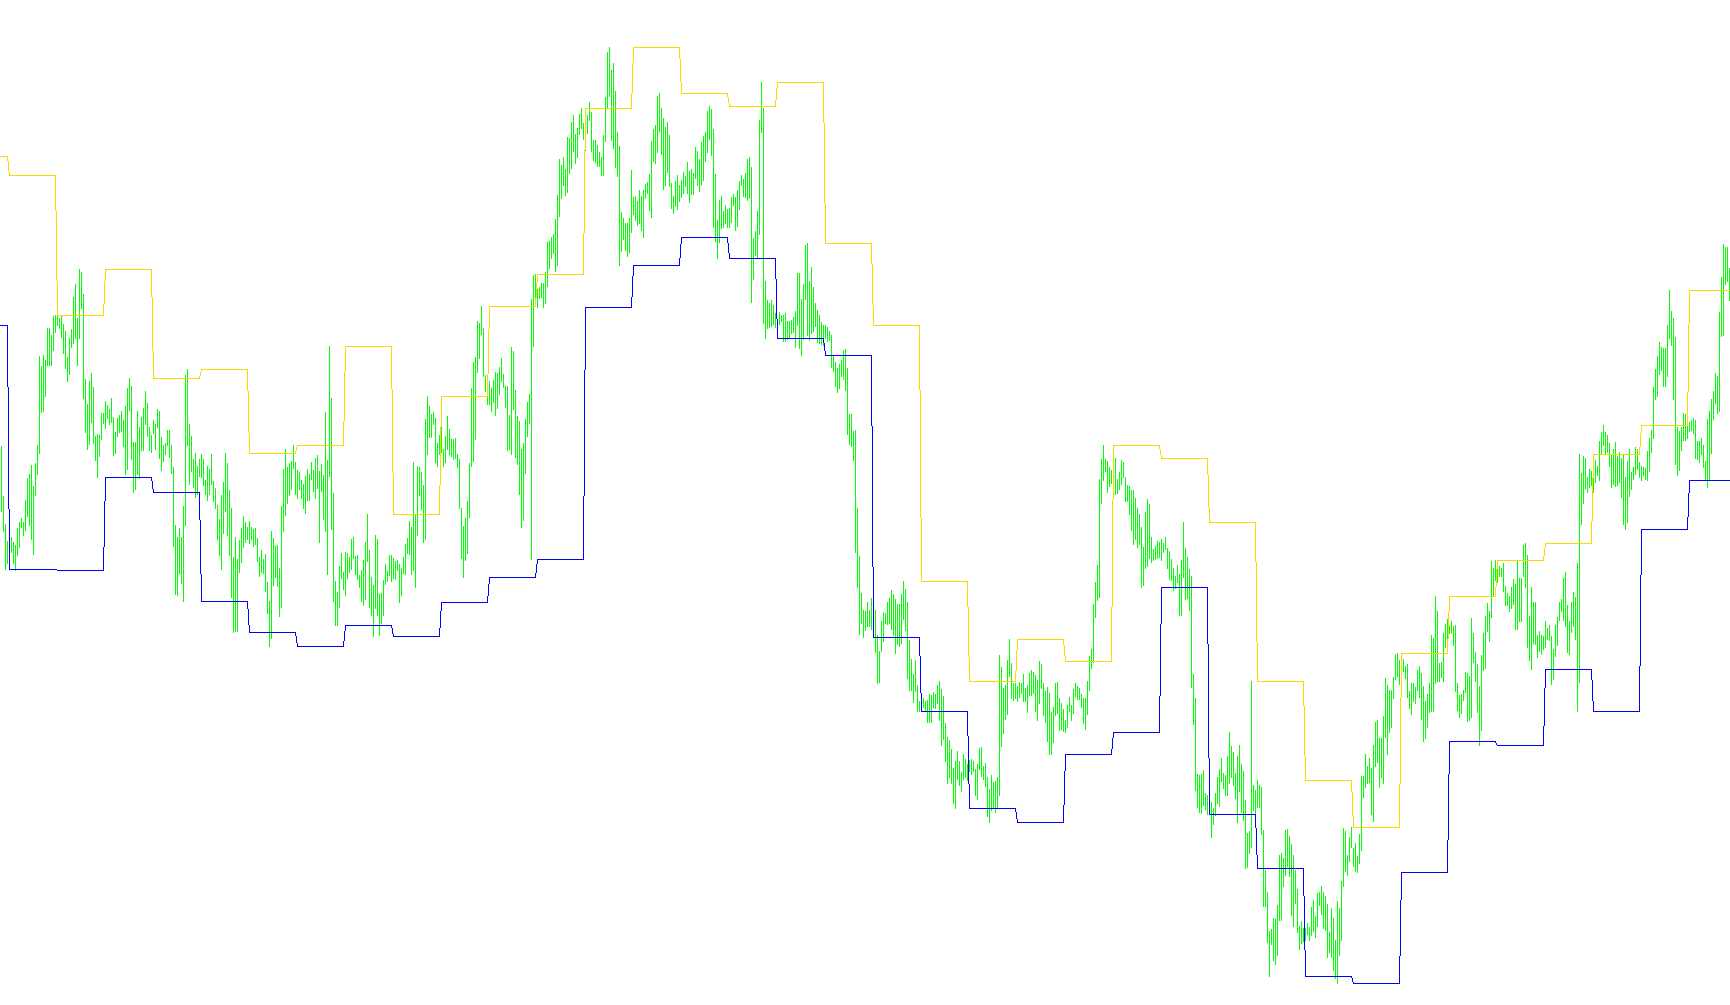
This tool is designed to provide traders with a clear visual reference of the previous day's price extremes directly on their current trading chart. By identifying these specific boundaries, it helps you understand where the market moved during the preceding 24-hour session, allowing for better identification of support and resistance levels.
How it Works
The script automatically scans the daily historical data to find two key pieces of information: the highest price reached and the lowest price reached during the previous full trading day.
Instead of requiring you to manually switch between different timeframes (like moving from a 1-hour chart back to a Daily chart) to check these figures, the tool pulls that information automatically. It then projects these two values onto your current screen as continuous horizontal lines.
Key Visual Features
- High Boundary: Represented by a blue line, this marks the peak price of the previous day.
- Low Boundary: Represented by a red line, this marks the bottom price of the previous day.
Practical Use
Because these lines remain constant throughout your current trading day, they serve as "markers" for price action. Traders often use these levels to see if the price is breaking out beyond yesterday's range or if it is reacting to those specific limits. It essentially provides a "map" of yesterday's territory to help guide today's navigation.
//+------------------------------------------------------------------+
//|                                               LastDayHighLow.mq4 |
//|                             These are the last days high and low |
//|                                   Copyright © 2008, Serega Lykov |
//|                                       http://mtexperts.narod.ru/ |
//+------------------------------------------------------------------+
#property copyright "Copyright © 2008, Serega Lykov"
#property link      "http://mtexperts.narod.ru/"
#property indicator_chart_window
#property indicator_buffers 2
#property indicator_color1 Blue
#property indicator_color2 Red

double HighBuffer[];
double LowBuffer[];

//+------------------------------------------------------------------+
//| Custom indicator initialization function                         |
//+------------------------------------------------------------------+
int init()
  {
   SetIndexStyle(0,DRAW_LINE);
   SetIndexStyle(1,DRAW_LINE);
   IndicatorDigits(Digits);
   IndicatorShortName("Last Day High/Low");
   SetIndexBuffer(0,HighBuffer);
   SetIndexBuffer(1,LowBuffer);
   SetIndexLabel(0,"Last Day High");
   SetIndexLabel(1,"Last Day Low");
   return(0);
  }

//+------------------------------------------------------------------+
//| Custor indicator deinitialization function                       |
//+------------------------------------------------------------------+
int deinit()
  {
   return(0);
  }

//+------------------------------------------------------------------+
//| Custom indicator iteration function                              |
//+------------------------------------------------------------------+
int start()
  {
   int counted_bars = IndicatorCounted();
   if(counted_bars < 0) return(-1);
   if(counted_bars>0) counted_bars--;
   for(int i=0; i<=counted_bars; i++)
     {
      HighBuffer[i] = iHigh(NULL,PERIOD_D1,iBarShift(NULL,PERIOD_D1,Time[i])+1);
      LowBuffer[i] = iLow(NULL,PERIOD_D1,iBarShift(NULL,PERIOD_D1,Time[i])+1);
     }
   return(0);
  }
//+------------------------------------------------------------------+
Comments