infoboard
Indicator

infoboard

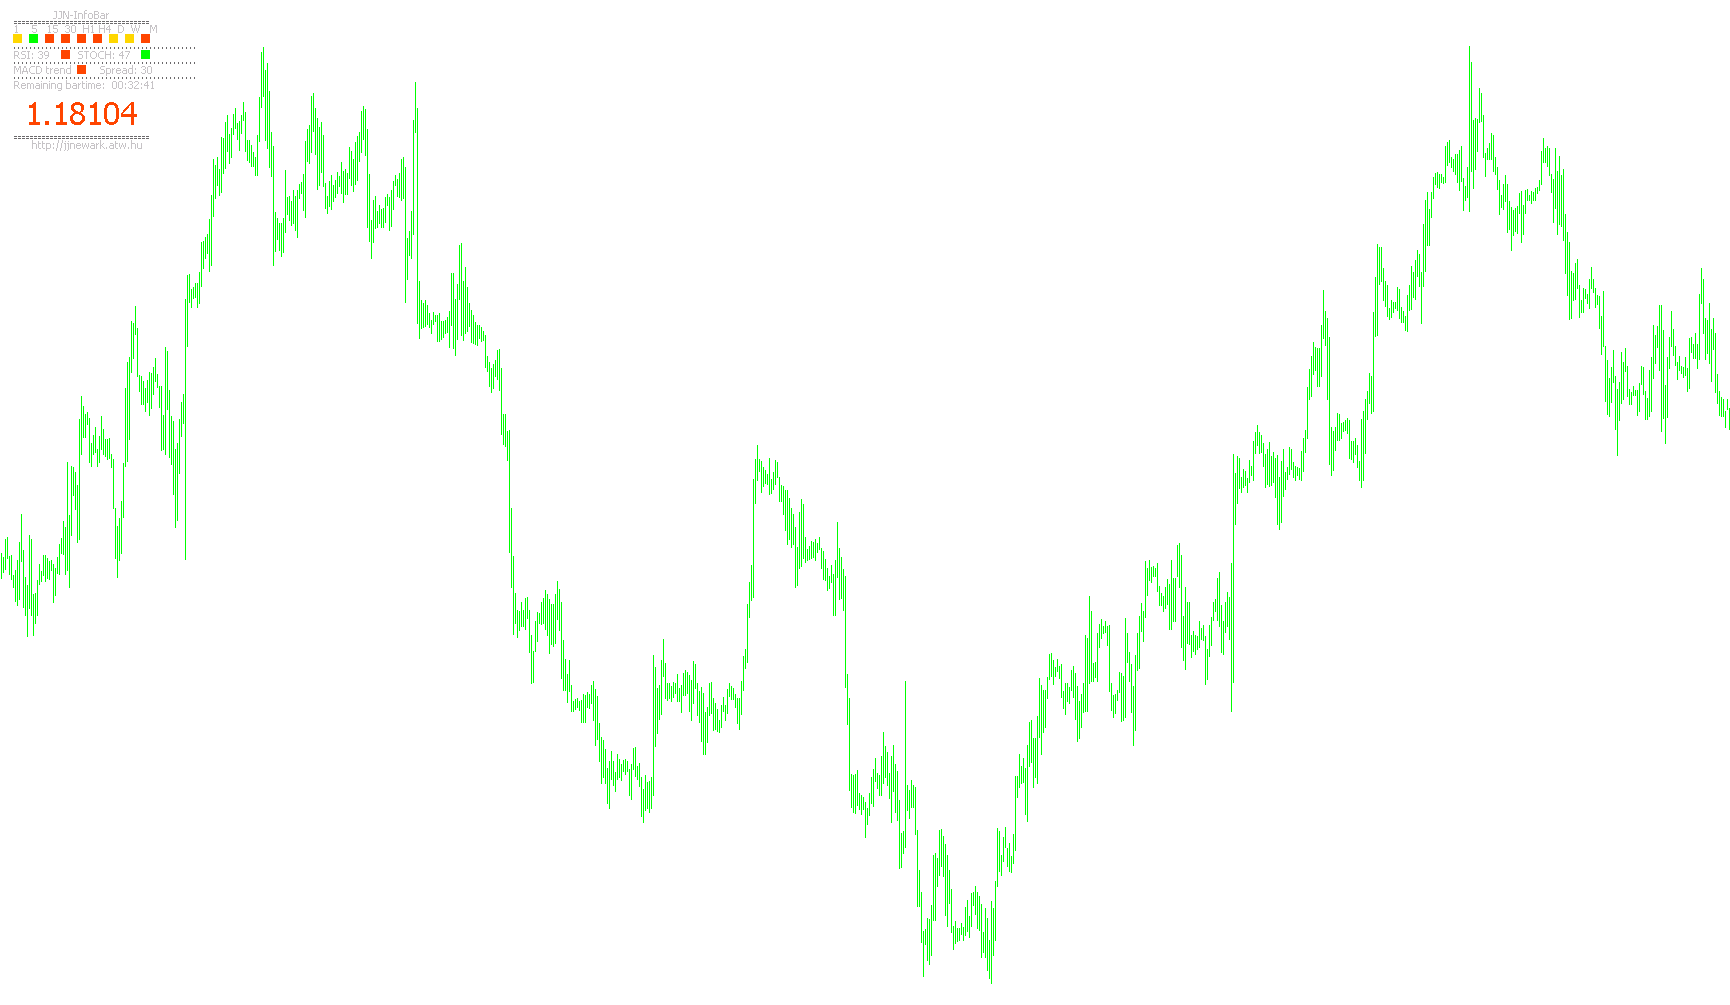
A comprehensive real-time graphical overlay that aggregates multi-timeframe fractal trends, volatility metrics, and live execution data into a single synchronized display.

infolabel
Indicator

infolabel

Dynamically renders synchronized price quotes, tick volume metrics, and dual-timezone temporal data onto a specific chart quadrant.

informer_v4
Indicator

informer_v4

This indicator provides a comprehensive real-time overview by displaying synchronized account statistics, historical trade trajectories, and live position markers with integrated magic number filtering.

Indicator

info_o_koncie

info_rectangle_drawing
Indicator

info_rectangle_drawing

A visual overlay that renders a customizable graphical panel displaying real-time asset identification, current spread values, and daily high-low volatility ranges.

Inside_Bar
Indicator

Inside_Bar

This indicator identifies and projects higher timeframe price boundaries onto lower timeframes to visualize periods of market consolidation and potential breakout zones.

Instrument
Indicator

Instrument

Visualizes price action structure by mapping high, low, open, and close boundaries into distinct histogram layers across different timeframes and instruments.

iPip_Tom_DeMark_Pivot
Indicator

iPip_Tom_DeMark_Pivot

This indicator calculates and plots daily pivot levels by weight-adjusting the previous period's high, low, and close based on the candle's directional polarity.

ipivot
Indicator

ipivot

A comprehensive technical overlay that dynamically calculates and plots five distinct pivot point methodologies—Standard, Fibonacci, Camarilla, Woodie, and DeMark—alongside automated multi-level support and resistance alerts.

ipulsar_v3
Indicator

ipulsar_v3

This indicator quantifies price level robustness by calculating the duration between local extrema breaches, applying recursive filtering to identify significant structural breakthroughs.

istddev
Indicator

istddev

This indicator plots two distinct standard deviation volatility bands on the chart, utilizing specific Fibonacci-based deviation multipliers to identify potential price exhaustion zones.

ivchannel_breakout_basic
Indicator

ivchannel_breakout_basic

iATR

Identifies trend reversals by detecting price breaches of nested high-low channels while dynamically projecting stop-loss levels based on ATR volatility.

I_CloseDifference_v-08
Indicator

I_CloseDifference_v-08

This indicator quantifies the relative momentum of base and quote currencies by aggregating price variance across a basket of global forex pairs to determine institutional strength.

i_dayatr_v1_1
Indicator

i_dayatr_v1_1

iATR

Calculates a rolling Average True Range by dynamically identifying and counting the specific number of daily candles within a user-defined timeframe.

i_daybb_v1_1
Indicator

i_daybb_v1_1

iBands

This indicator calculates Bollinger Band extremes by dynamically determining the number of bars within a specific multi-day lookback window to assess historical volatility.

i_daybears_v1_1
Indicator

i_daybears_v1_1

iBearsPower

Quantifies historical売り勢力 strength by aggregating bearish pressure over a specific rolling day window to identify persistent downward sentiment.

i_daybulls_v1_1
Indicator

i_daybulls_v1_1

iBullsPower

This indicator quantifies bullish market strength by aggregating price dynamics over a specified multi-day historical window to visualize trend potency.

i_daycci_v1_1
Indicator

i_daycci_v1_1

iCCI

Calculates the Commodity Channel Index by dynamically determining the number of bars elapsed within a multi-day window to normalize momentum across various timeframes.

i_daydemarker_v1_1
Indicator

i_daydemarker_v1_1

iDeMarker

The indicator calculates the DeMarker momentum value by dynamically aggregating bar counts across a multi-day temporal window to identify trend exhaustion.

i_dayforce_v1_1
Indicator

i_dayforce_v1_1

iForce
i_dayma_v1_1
Indicator

i_dayma_v1_1

iMA

This indicator calculates a moving average based on a variable count of elapsed calendar days rather than a fixed number of bars, adjusting automatically to historical timeframes.

i_daymomentum_v1_1
Indicator

i_daymomentum_v1_1

iMomentum

This indicator quantifies price velocity by calculating momentum across a dynamic number of bars relative to the specific daily timeframe rotation.

i_dayrsi_v1_1
Indicator

i_dayrsi_v1_1

iRSI

This indicator calculates the Relative Strength Index by dynamically determining the number of bars corresponding to a specific multi-day duration rather than using a fixed period.

i_dayrvi_v1_1
Indicator

i_dayrvi_v1_1

iRVI

This indicator calculates the Relative Value Index (RVI) by dynamically determining the specific number of bars within a rolling daily window to normalize momentum analysis.

i_daystochastic_v1_1
Indicator

i_daystochastic_v1_1

iStochastic

This indicator calculates stochastic momentum by dynamically determining the number of bars spanning a specific historical day range to smooth volatility.

i_daywpr_v1_1
Indicator

i_daywpr_v1_1

iWPR

This indicator calculates the Williams %R oscillator by dynamically determining the count of candles within a specific multi-day window rather than using a fixed bar period.

J-EM 7-21
Indicator

J-EM 7-21

iMA

This indicator identifies bullish and bearish trend reversals by detecting precise crossover points between a fast and slow Exponential Moving Average while utilizing a 10-period volatility range for dynamic signal placement.

JaysjCandlepDisplay
Indicator

JaysjCandlepDisplay

This indicator calculates and displays the real-time price movement range and candle body size across six predefined timeframes simultaneously in a dedicated sub-window.

Jay_Digital Parabolic Spy
Indicator

Jay_Digital Parabolic Spy

iSAR

This indicator synchronizes Parabolic SAR signals and price volatility across four distinct timeframes simultaneously to identify trend reversals and dynamic pip differentials.

JJN-ActiveHours
Indicator

JJN-ActiveHours

This indicator dynamically renders visual vertical demarcations to isolate specific intraday liquidity windows based on user-defined chronological thresholds.

JJN-AutoPitchforx
Indicator

JJN-AutoPitchforx

This indicator dynamically identifies historical price extremes using the ZigZag algorithm to automatically project Andrews, Schiff, and Modified Schiff pitchfork structures for trend analysis.

JJN-Bee
Indicator

JJN-Bee

iATR

This indicator identifies trend reversals by detecting price action pierces through the previous candle's open level, projecting dynamic entry, take-profit, and stop-loss zones based on Average True Range volatility.

JJN-BigTrend
Indicator

JJN-BigTrend

iMA

This indicator displays trend direction for multiple currency pairs across different timeframes using Moving Averages and High/Low price comparisons, visually indicating uptrends, downtrends, or ranging markets with distinct colors.

JJN-Fibo
Indicator

JJN-Fibo

This indicator automatically calculates and projects key retracement levels based on high and low price extremes spanning specific historical temporal units.

JJN-Infobar
Indicator

JJN-Infobar

iMACDiADXiRSIiStochastic

This indicator displays a customizable information panel showing trend direction across multiple timeframes based on ADX and PSAR, along with current RSI, Stochastic, MACD values, spread, remaining bar time, and price.

JJN-Nugget
Indicator

JJN-Nugget

iMA

This indicator identifies trend shifts by comparing the arithmetic mean of eight Fibonacci-based Exponential Moving Averages against the current price's mid-range point.

JJN-Promise
Indicator

JJN-Promise

iMAiMAOnArray

This indicator calculates the cumulative deviation of exponential moving averages using a Fibonacci-based shifting sequence to identify momentum divergences and signal volatility.

JJN-Scalper
Indicator

JJN-Scalper

iATR

This indicator identifies high-probability reversal zones by detecting price breaches of the nearest significant opposing candle's open price while utilizing Average True Range for dynamic volatility-based profit and loss targets.

JJN-TradeInfo
Indicator

JJN-TradeInfo

This indicator dynamically parses active trading positions to display real-time pips, profit figures, and directional statuses on a dedicated dashboard.

JPN_Time_SubZero
Indicator

JPN_Time_SubZero

A temporal visualization tool that maps specific localized time zones onto the chart via dynamic vertical grid lines and customizable date-time labels.

JS.Levels
Indicator

JS.Levels

This indicator dynamically projects and renders a series of horizontal price levels derived from historical high and low data points over an extended timeframe.

Indicator

JS.Levels.V2

KawaseOsyo_Price
Indicator

KawaseOsyo_Price

This indicator renders a real-time visual dashboard on the chart displaying the current asset symbol, dynamic bid/ask spread, multi-layered price formatting, and a countdown timer for the remaining bar duration.

KawaseOsyo_StochasticHistogram
Indicator

KawaseOsyo_StochasticHistogram

iStochastic

This indicator visualizes extreme momentum by isolating and scaling stochastic deviations that exceed specific overbought and oversold thresholds into a dual-histogram format.

Indicator

keycontrol_support_resistance

kijun_candles_two_colors
Indicator

kijun_candles_two_colors

iIchimokuiMA
km-sa
Indicator

km-sa

iRSI

Identifies potential trend shifts by detecting when the RSI value crosses specific oversold and overbought thresholds on a per-bar basis.

km-tc
Indicator

km-tc

iMA

Identifies bullish and bearish trends by detecting specific stacking orders of 7, 14, and 21 period exponential moving averages to trigger entry and exit signals.

km-trend_movers
Indicator

km-trend_movers

iATRiMACDiRSIiStochastic

This indicator synthesizes RSI, ATR, Stochastic, MACD, and CCI metrics alongside dual Moving Average crossovers to provide real-time directional strength classifications.

KoliErBands_Indi
Indicator

KoliErBands_Indi

This indicator calculates a dynamic price channel by identifying the median of extreme price points over a rolling window and projecting upper and lower boundaries based on the standard deviation of price variance.