i_dayrvi_v1_1
Download script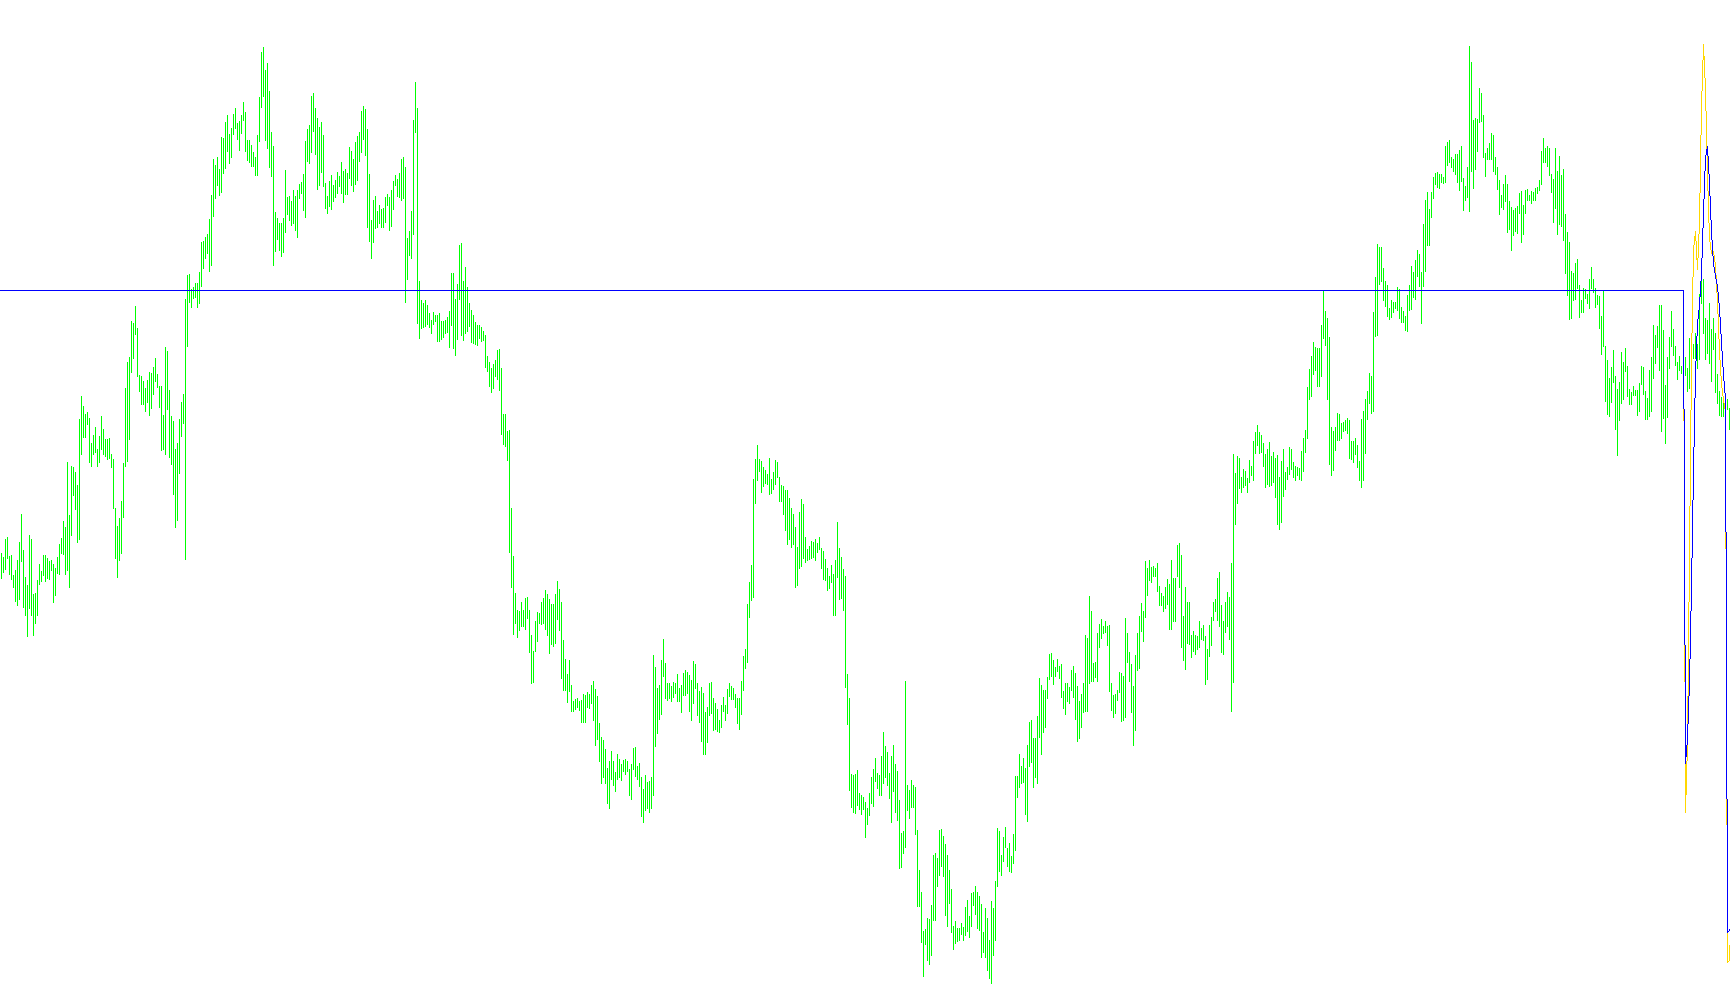
This tool is designed to provide traders with a visual representation of market momentum based on the Relative Volume Index (RVI). Unlike standard indicators that may calculate data over a fixed number of candles, this script introduces a dynamic logic tailored to handle specific timeframes effectively.
Core Functionality
The primary purpose of this indicator is to measure the relationship between volume and price movement. It produces two distinct lines on a separate window below your main chart:
- The Main RVI Line: Shows the core momentum strength.
- The Signal Line: Acts as a secondary reference point to help identify potential trend shifts or exhaustion.
How the Logic Works
To ensure accuracy across different charts, the script performs several automated checks and calculations:
- Timeframe Validation: The tool includes a safety feature that prevents it from running on very large timeframes (greater than one day). This ensures that the data remains granular enough for the calculation to be meaningful.
- Dynamic Day Counting: Instead of using a generic number, the script looks back at the historical data to determine how many "trading days" have passed within the chosen calculation window. It identifies the start and end of calendar days to ensure that the volume data is categorized correctly.
- Adaptive Calculation: The logic automatically adjusts based on the current chart period you are viewing. By calculating the number of bars required to represent a specific amount of time, it ensures that the RVI value remains consistent whether you are looking at smaller minutes or larger hours.
Visual Interpretation
The indicator is plotted with a zero-line as a baseline:
- When the lines move above the zero level, it generally indicates bullish momentum (buying pressure).
- When the lines move below the zero level, it suggests bearish momentum (selling pressure).
- By observing the interaction between the Main RVI and the Signal line, traders can better visualize whether a trend is gaining strength or beginning to lose steam.
Indicators Used
Miscellaneous
12
Views
0
Downloads
0
Favorites
i_dayrvi_v1_1
//+------------------------------------------------------------------+
//|                                                       DayRVI.mq4 |
//|                                 Copyright 2010-2015, Excstrategy |
//|                                        http://www.ExcStrategy.ru |
//+------------------------------------------------------------------+
#property copyright "ExcStrategy"
#property link      "http://www.ExcStrategy.ru"
#property version   "1.1"
#property description "RVI"
#property strict
//+------------------------------------------------------------------+
#property indicator_separate_window
#property indicator_buffers 2
#property indicator_color1 Blue
#property indicator_width1 1
#property indicator_color2 Red
#property indicator_width2 1
#property indicator_level1 0.0
#property indicator_levelcolor clrSilver
#property indicator_levelstyle STYLE_DOT
//----
extern int DaysForCalculation=2;
//---- buffers
double Buffer1[];
double Buffer2[];
//+------------------------------------------------------------------+
//|                                                                  |
//+------------------------------------------------------------------+
int init()
  {
   IndicatorBuffers(2);
//---- indicator lines
   SetIndexStyle(0,DRAW_LINE);
   SetIndexBuffer(0,Buffer1);
   SetIndexStyle(1,DRAW_LINE);
   SetIndexBuffer(1,Buffer2);
//----
   SetIndexLabel(0,"RVI");
   SetIndexLabel(0,"Signal");
//---
   DaysForCalculation=DaysForCalculation+1;
//----
   return(0);
  }
//+------------------------------------------------------------------+
//|                                                                  |
//+------------------------------------------------------------------+
int start()
  {
   if(Period()>1400)
     {
      Alert("Error! Period can not be greater than D1");
      return(0);
     }
//----
   int counted_bars=IndicatorCounted();
   int barsday;
   bool rangeday;
   datetime Time1=Time[0],Time2;
//----
   if(counted_bars>0) counted_bars--;
   int limit=Bars-counted_bars;
//----
   for(int i=0; i<limit; i++)
     {
      //----
      rangeday= false;
      barsday = 0;
      //----
      Time2=Time[i]+(1440*60*DaysForCalculation);
      if(Time1<Time2)
         if(i<Bars-MathRound(1500/Period()))
            for(int a=i; a<i+1441; a++)
              {
               //----
               barsday++;
               //----
               if(TimeDayOfYear(Time[a])!=TimeDayOfYear(Time[a+1])) a=i+1442;
              }
      //----
      Buffer1[i] = iRVI(NULL, 0, barsday, 0, i);
      Buffer2[i] = iRVI(NULL, 0, barsday, 1, i);
     }
//----
   return(0);
  }
//+------------------------------------------------------------------+
Comments