i_daystochastic_v1_1
Download script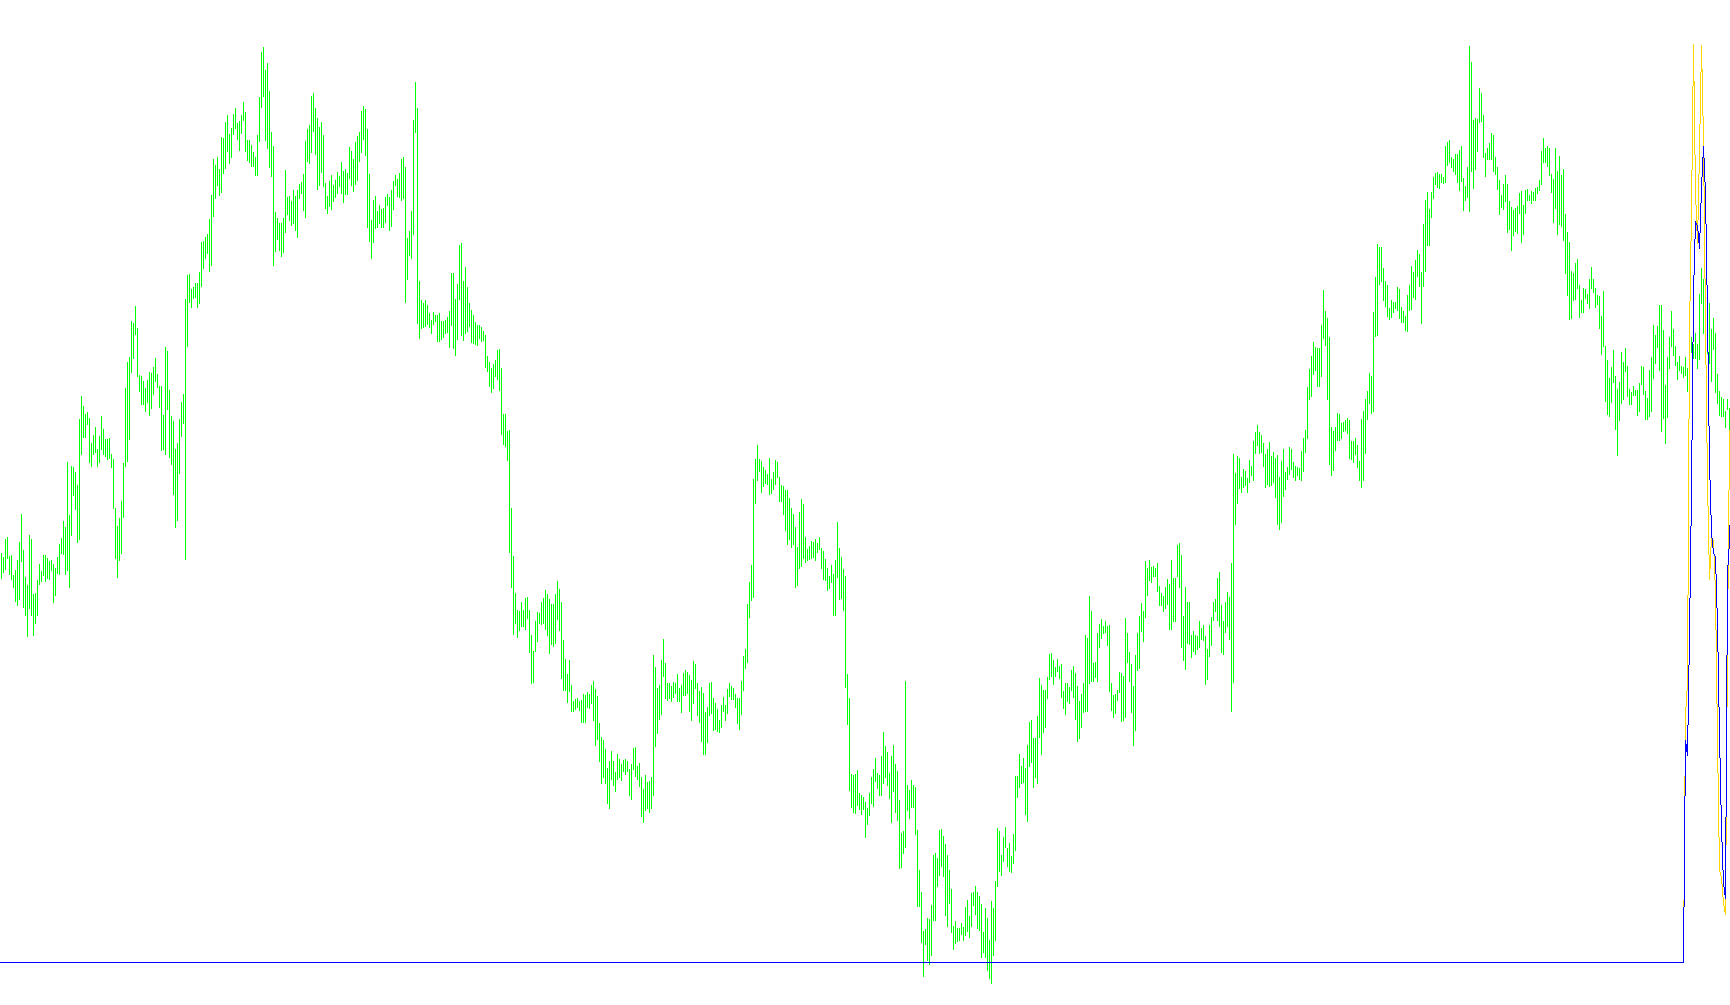
This script is designed as a specialized technical indicator for MetaTrader 4 that calculates the "Stochastic Oscillator"—a common tool used by traders to identify overbought or oversold conditions in the market. What makes this specific version unique is how it handles timeframes and data calculation.
Core Functionality
The primary purpose of this script is to provide a more accurate reading of price momentum by dynamically adjusting its look-back period based on the number of days passed. Instead of simply looking at a fixed number of candles (like the standard "14 periods"), it attempts to calculate the data relative to actual daily cycles.
Key Logic Breakdown
- Dynamic Day Tracking: The script includes a specific mechanism to count how many bars (candles) represent one full day on your current chart. By identifying when a new day begins, it creates a custom "look-back" window. This ensures that whether you are looking at a very small timeframe (like 1-minute charts) or a larger one, the indicator tries to maintain a consistent mathematical relationship with the passage of days.
- Automated Period Adjustment: It automatically calculates how many bars it needs to scan to satisfy the required "Days for Calculation" setting. This allows the indicator to scale its sensitivity based on your chosen timeframe without you having to manually change the period settings constantly.
- Dual-Line Analysis: The script plots two distinct lines on a separate window below your main price chart:
- The Main Stochastic Line: Represents the primary momentum of the market.
- The Signal Line: Acts as a moving average of the main line, used to identify trend reversals and "crosses."
- Safety Constraints: The script includes a built-in safety check to ensure it is not run on timeframes larger than one day (D1). If the timeframe is too large for the calculation logic to work, the script will provide an alert notification to the user.
Visual Presentation
The indicator operates within a separate window on your screen, ranging from 0 to 100. It features two distinct horizontal levels:
- 20 Level: Generally indicates that the market may be "oversold."
- 80 Level: Generally indicates that the market may be "overbought."
By observing where the blue and red lines move in relation to these boundaries, traders can visually identify potential entry and exit points based on the momentum of the previous days.
//+------------------------------------------------------------------+
//|                                                DayStochastic.mq4 |
//|                                 Copyright 2010-2015, Excstrategy |
//|                                        http://www.ExcStrategy.ru |
//+------------------------------------------------------------------+
#property copyright "ExcStrategy"
#property link      "http://www.ExcStrategy.ru"
#property version   "1.1"
#property description "Stochastic"
#property strict
//+------------------------------------------------------------------+
#property indicator_separate_window
#property indicator_buffers 2
#property indicator_color1 Blue
#property indicator_width1 1
#property indicator_color2 Red
#property indicator_width2 1
#property indicator_minimum 0
#property indicator_maximum 100
#property indicator_level1 20.0
#property indicator_level2 80.0
#property indicator_levelcolor clrSilver
#property indicator_levelstyle STYLE_DOT
//----
input int InpDPeriod = 3; // D Period
input int InpSlowing = 3; // Slowing
extern int Method=0;
extern int Price_field=0;
//----
extern int DaysForCalculation=2;
//---- buffers
double Buffer1[];
double Buffer2[];
//+------------------------------------------------------------------+
//|                                                                  |
//+------------------------------------------------------------------+
int init()
  {
   IndicatorBuffers(2);
//---- indicator lines
   SetIndexStyle(0,DRAW_LINE);
   SetIndexBuffer(0,Buffer1);
   SetIndexStyle(1,DRAW_LINE);
   SetIndexBuffer(1,Buffer2);
//----
   SetIndexLabel(0,"Stochastic");
   SetIndexLabel(0,"Signal");
//---
   DaysForCalculation=DaysForCalculation+1;
//----
   return(0);
  }
//+------------------------------------------------------------------+
//|                                                                  |
//+------------------------------------------------------------------+
int start()
  {
   if(Period()>1400)
     {
      Alert("Error! Period can not be greater than D1");
      return(0);
     }
//----
   int counted_bars=IndicatorCounted();
   int barsday;
   bool rangeday;
   datetime Time1=Time[0],Time2;
//----
   if(counted_bars>0) counted_bars--;
   int limit=Bars-counted_bars;
//----
   for(int i=0; i<limit; i++)
     {
      //----
      rangeday= false;
      barsday = 0;
      //----
      Time2=Time[i]+(1440*60*DaysForCalculation);
      if(Time1<Time2)
         if(i<Bars-MathRound(1500/Period()))
            for(int a=i; a<i+1441; a++)
              {
               //----
               barsday++;
               //----
               if(TimeDayOfYear(Time[a])!=TimeDayOfYear(Time[a+1])) a=i+1442;
              }
      //----
      Buffer1[i] = iStochastic(NULL, 0, barsday, InpDPeriod, InpSlowing, Method, Price_field, 0, i);
      Buffer2[i] = iStochastic(NULL, 0, barsday, InpDPeriod, InpSlowing, Method, Price_field, 1, i);
     }
//----
   return(0);
  }
//+------------------------------------------------------------------+
Comments